Transcription
The future of SaaS: Is there lightat the end of the tunnel?Software firms transitioning to SaaS saw market capitalizationsrise nearly 300% while revenues and margins remained mostlyflat: These valuations seem hard to justify today, and will beharder to justify tomorrow.WHITEPAPER
WHITEPAPERCONTENTS3Executive Summary4Introduction813172 4The Transition to SaaS is Clear6The Transition has been Uneven7Pricing has Forever ChangedHow Can SAAS Valuations Be Justified?8A. Software vs. SaaS: Financial Performance Metrics10B. Software vs. SaaS: Customer Lifetime Values (CLVs)11C. Software vs. SaaS: Market Cap Growth12A Day of Reckoning Looms12Grow in Every Direction One Can12Easy to Adopt Easy to LeaveFacing a Growth Challenge, What Can SaaS Firms Do?14Are price increases an option?14Test #1: Which Vendors Can Increase Prices?16Test #2: Will Customers Accept Price Increases?17Pricing: The Third Rail for SaaSConclusionTHE FUTURE OF SAAS: IS THERE LIGHT AT THE END OF THE TUNNEL?
WHITEPAPEREXECUTIVE SUMMARYThe shift to SaaS is real. It has given birth to new application leaders, forced traditionalsoftware companies to shift their business models, and altered end-user expectationsforever. Investors like SaaS companies, evidenced by the surging valuations of thesefirms. But many of these valuations seem difficult to justify.To shed light on this, AV&Co. undertook a series of analyses: These included a complexsurvey of approximately 700 buyers of enterprise applications, analysis of nearly30 publicly traded application firms, interviews with industry executives, and tappinginto our own knowledgebase from assisting dozens of firms throughout the applicationecosystem with their strategic and operational challenges.Some of our findings were striking. For example, we tracked eight publicly tradedenterprise software firms through the first five years of their transition to SaaS. Onaverage, revenues and margins dipped in the early years for all firms, before recoveringonly to pre-transition levels at roughly five years. Over the same period, the averagemarket capitalization of these firms surged nearly 300%.In evaluating these firms, investors are betting on long-term recurring revenue,sustained high growth rates, and eventually stable profitability. They are ignoringtraditional measures, e.g., current operating margins. But as SaaS penetration in certainmarkets approaches a ceiling, and new customer acquisition begins to slow, the endof the tunnel may be nearing. It is not clear how these SaaS firms will look whenwe reach it.To offset decelerating growth, many market leaders are focused on driving up/crossselling of the existing base (mostly via M&A), and minimizing customer churn. Butthose tactics might not be enough. Soon they may need to consider traditional tactics,(e.g., cost cutting and price increases), to boost operating margins. But cost cutting,(e.g., reduced spending on Sales and Marketing), may just slow growth faster. Andprice increases, with few exceptions, are likely to alienate price-sensitive SaaS buyers.In sum, it’s not clear if there is light at the end of the tunnel for SaaS firms. They willincreasingly struggle to maintain high valuation multiples in the face of traditionaloperating challenges.THE FUTURE OF SAAS: IS THERE LIGHT AT THE END OF THE TUNNEL? 3
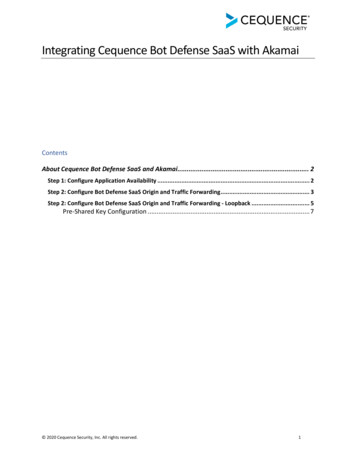
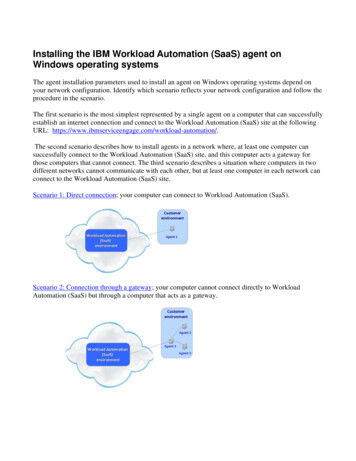
WHITEPAPERINTRODUCTIONAlthough the shift to SaaS has been occurring for 15 years, accompanied by fastgrowth and flashy headlines, many pureplay SaaS companies have yet to show aprofit. More gradually, traditional software players are evolving, and have addedSaaS as an offering or shifted to a SaaS-first strategy. Facing an existential threat ascustomers buy more directly from SaaS providers, and as SaaS reduces the need forimplementation services, channel partners are scrambling to identify and deliver new,sustainable services, and tweak their business models to survive.As we reflect on the SaaS / Software and IT Services firms we work with daily,there are some fundamental questions the market has yet to answer about thefuture of SaaS: Are SaaS economics attractive to providers and investors? How have customer needs and expectations evolved with the growth of SaaS, andhow will they evolve going forward? How must reseller channels evolve given the shift to SaaS? Or will they even survive?To shed light on these questions, AV&Co. undertook a series of analyses: Theseincluded a complex survey of approximately 700 buyers of enterprise applications,analysis of nearly 30 of publicly traded application firms, interviews with industryexecutives, and utilization of our own knowledgebase from assisting dozens of firmsthroughout the application ecosystem with their strategic and operational challenges.This first edition of thought leadership attempts to answer some (admittedly, not all) ofthese questions. A follow up edition will address the future of resellers in a SaaS world.The Transition to SaaS is ClearTwenty-four percent of spending on enterprise applications went to SaaS-based solutionsin 2015. That number is expected to grow 50% by 2020 and reach 36% of applicationspending. As noted in Figure 1, in 2016 100% of the growth experienced by applicationfirms we analyzed was due to SaaS. For traditional software firms (defined as 25% ofrevenues from SaaS) as recently as 2012 only 18% of their growth came from SaaS. Forhybrid firms (25-75% of revenues from SaaS), only 61% of their revenues came fromSaaS in 2012.4 THE FUTURE OF SAAS: IS THERE LIGHT AT THE END OF THE TUNNEL?
WHITEPAPERFigure 1: SaaS now accounts for all growth at application firmsSaaS Contribution to Overall GrowthAV&Co. Analysis of 27 Software Vendors(Software Model share of YoY Growth, ‘12 & ricProviders39%Growth fromNon-Saas82%100 %100 %100 %100 %20162012201661%Growth fromSaasSaas% ofTotal Revenues(2012 to 2016)18%201220167%201249%91%SaaS pureplays, e.g., Salesforce, are market share leaders vs traditional stalwarts,e.g., Oracle and SAP. The world’s largest software firm, Microsoft, is driving its ownaggressive transition to SaaS, most notably by “encouraging” customers to shift to theOffice 365 suite, the SaaS version of the ubiquitous Microsoft Office Suite.SaaS is for real. It is here to stay. Increasingly, it is the new normal. And it has beendisruptive: It has brought the birth of new pureplay SaaS vendors, squeezed traditionalsoftware vendors, disrupted reseller channels, and altered customerexpectations forever. SaaS has also “opened up” new buyer segments (e.g., midsized and small firms).These firms previously could not afford sophisticated applications, but nowcan thanks to OPEX-based subscription pricing and the leaner deploymentrequirements of SaaS solutions.Figure 1 – Traditional: Intuit, Oracle (software division), SAP, PTC; Hybrid: Adobe, Ansys, Atlassian, Autodesk, CallidusSoftware, Jive Software, Nuance, Sage; SaaS: Brightcove, Cornerstone onDemand, Demand Ware, Intralinks, Marketo,NetSuite, New Relic, Paycom, Qualys, Salesforce, SPS Commerce, Ultimate Software Group, Veeva Systems, Workday,Zendesk. Sources: AV&Co. AnalysisTHE FUTURE OF SAAS: IS THERE LIGHT AT THE END OF THE TUNNEL? 5
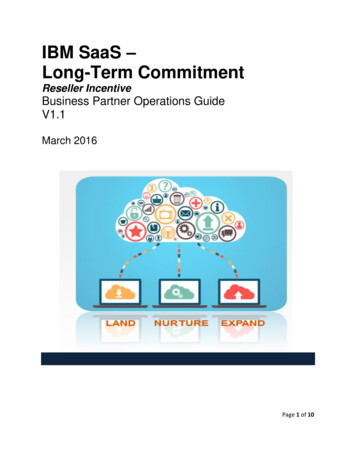
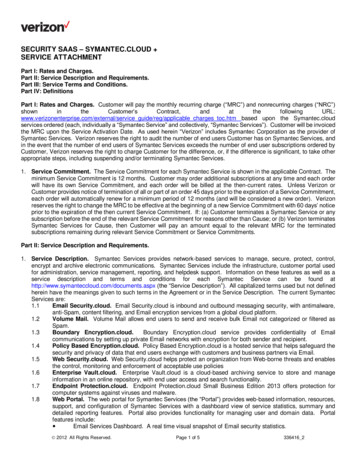
WHITEPAPERThe Transition has been UnevenThe impacts of SaaS have not been evenly distributed across a sea of applicationvendors. Per Figure 2, different enterprise applications are transitioning to SaaS atdifferent rates.Figure 2: SaaS adoption is pervasive but varies by applicationWorldwide SaaS Applications Penetration 2015 and 2020 (%)1008081%71%6060 usinessIntelligence%SCM6%9%2%5%Operations & EngineeringManufacturing2015-2020 % increase in SaaS penetration36%51%51%54%28%50%Human Capital Management (HCM), Collaboration and Customer RelationshipManagement (CRM) were some of the earliest applications to start a transition. By2020, those markets will be near 70% SaaS – arguably approaching a “SaaS ceiling”,or full SaaS penetration. Vendors in these markets are increasingly faced withdecelerating growth, price compression, and traditional vendors who have “woken up”to SaaS – rather than fight it, they now embrace it.Other markets are just now starting to accelerate a transition. Enterprise ResourcePlanning (ERP), Content Management, and Business Intelligence (BI) have seenmostly modest SaaS adoption to date, but will likely double their penetration over the2015-2020 period. Vendors in these markets should expect many of the dynamicsexperienced in Content Management and CRM, with one major exception: Traditionalsoftware vendors will not be so slow to shift to SaaS this time around in these markets.And still other markets, e.g., Supply Chain Management (SCM), have seen low adoptionto date, and are not expected to accelerate much in the near term – but their timewill come.Figure 2 – Sources: IDC Worldwide Software as a Service and Cloud Software Forecast, 2016–2020 August 2016; IDC WWHuman Capital Management and Payroll Applications Forecast June 2016; IDC WW Business Analytics Software ForecastAugust 2016; IDC WW Enterprise Resource Management Applications Forecast June 16. Note: ERP (not HCM) includespayroll applications.6 THE FUTURE OF SAAS: IS THERE LIGHT AT THE END OF THE TUNNEL?
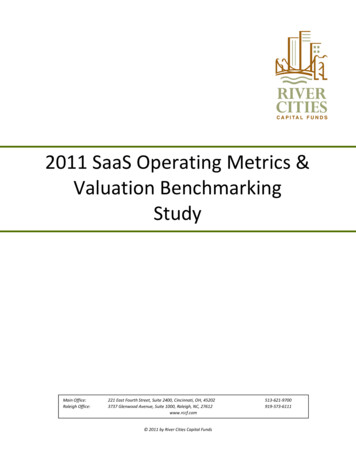
WHITEPAPERPricing has Forever ChangedSaaS has changed the pricing dynamic also, as noted in Figure 3. Markets with highSaaS penetration experience a wide range of pricing levels, and a corresponding widerange of vendor capabilities to raise or lower prices and achieve positive results. Formarkets with low SaaS penetration, the pricing bands are much tighter, and the abilityof vendors to raise or lower prices is much more consistent across vendors.There are reasons for the difference: SaaS players frequently entered markets withmuch lower pricing compared to software competitors. Their strategy was to quicklygain share and establish themselves as credible market leaders. They prioritized growthover near term profitability, and set an expectation that profitability would come later.For the most part, investors have supported this strategy.But this approach to pricing also disrupted expectations for all application customers,not just SaaS customers. SaaS pricing made some software customers begin toconsider the prices they were paying for software as excessively high, while othersoftware customers remained comfortable with their current pricing and vendors.SaaS pricing also appealed to very cost conscious buyers, who may not have boughtanything before a SaaS option was introduced. They expect all applications to havelow pricing. The result of all of this is the wide range of perceptions on vendor abilityto raise or lower prices. This is much less of an issue in low SaaS markets. Customersentiment toward pricing is more level headed.It will be interesting to watch, as high SaaS penetration markets begin to mature, ifpricing coalesces around tighter bands as we see in mature software markets – Thishas implications for the future of SaaS pricing, and ultimately the ability of SaaSvendors to compete on price, stabilize pricing, or potentially raise prices.Figure 3: Pricing flexibility is more varied for SaaS vendors vs software vendorsPricing Flexibility by Vendor and SaaS Application1 (N 391)Shade represents SaaS penetrationMore AbleHigh Price ElasticityCollab(Citrix)SaaS PenetrationGrowthPotentialHigh SaaSLow SaaSCollab(Cisco)BI (Oracle)HR (Kronos)HR (Oracle)HR (SAP)Ability to LowerPrices and GrowUser BaseLess AbleCollab(Microsoft)HR (Workday)CRM (Microsoft)BI(SAP)MarketSaturationCRM (Oracle)ERP(Oracle)CRM(SAP)ERP(SAP)BIERP (Microsoft)(Microsoft)CRM(Salesforce)Low PriceElasticityAbility to Raise Priceswith Minimal ChurnMore AbleFigure 3 – Source: 2017 AV&Co. SaaS Survey, IDC, Gartner, Expert InterviewsTHE FUTURE OF SAAS: IS THERE LIGHT AT THE END OF THE TUNNEL? 7
WHITEPAPERHOW CAN SAAS VALUATIONS BE JUSTIFIED?At Altman Vilandrie & Co., we assist software and SaaS companies and applicationresellers with their strategic and operational challenges. We also assist investorsin their evaluation of the same types of companies. We have worked with a rangeof management teams, and conducted deep analyses across the applicationecosystem. With every question we answer, new questions arise. Of those, oneseems incredibly important regarding the future of the application industry: Are SaaSvaluations justified?To address this we evaluated a range of publicly traded software and SaaS firms, andcompared them across three vectors: A. Traditional financial performance metrics B. Customer Lifetime Value (CLVs) estimates C. Market cap growth relative to revenue and operating margin growthA. Software vs. SaaS: Financial Performance MetricsSaaS firms have high valuation multiples, as noted in Figure 4, driven by the perceivedvalue of long-term recurring revenue relationships and sustained growth rates. Butare these multiples justified? To answer this, we pivoted to another question: Howdo Software, Hybrid and SaaS firms stack up against each other across some basicfinancial performance metrics?Figure 4: SaaS multiples exceed software comparablesRevenue Multiples on Market Per figure 5, we evaluated 28 application firms across three categories: Softwarefirms ( 75% of revenue from software vs other categories); SaaS firms ( 75% ofrevenues from SaaS); and Hybrids ( 75% of revenues from Software or SaaS). Acrosstwo key financial metrics (Sales and Marketing as a % of revenues and COGS as a %of revenues), Software companies perform much better, followed by Hybrids. SaaScompanies had poorer metrics (though it is worth noting that SaaS firm metrics haveimproved slightly in recent years).Figure 4 – Sources: 2017 AV&Co. SaaS survey; AV&Co. analysis of 27 software companies: Intuit, Oracle (softwaredivision), SAP, PTC, Adobe, Ansys, Autodesk, Callidus Software, Jive Software, Nuance, Sage, Atlassian, Brightcove,Cornerstone onDemand, Demand Ware, Intralinks, Marketo, NetSuite, New Relic, Paycom, Qualys, Salesforce, SPSCommerce, Ultimate Software Group, Veeva Systems, Workday, Zendesk8 THE FUTURE OF SAAS: IS THERE LIGHT AT THE END OF THE TUNNEL?
WHITEPAPERFigure 5: SaaS firms have higher operating expense profilesSales & Marketing(Expense type as % of Revenue, ‘11-’16)SaaS-Centric51%50%50%49%44%40%SaaS / 34%On-Prem 201430%31%25%26%20152016Cost Of Goods Sold(Total COGS as % of Revenue, ’11-’16)SaaS /On-Prem 0152016Those bullish on SaaS insist this is not how to evaluate SaaS firms. Rather, we shouldfocus on recurring revenue over time, or better yet, free cash flows. This is difficultgiven the pace of change in the market, especially at firms undergoing a transitionfrom software to SaaS. It also varies based on the penetration of SaaS in an overallmarket, e.g., CRM vs Business Intelligence.Figure 5 – SaaS-Centric providers generate 75% of Rev from SaaS; Hybrids generate 25-75% of Rev from SaaS;Traditionals generate 25% of Rev from SaaS. Traditional: Intuit, Oracle (software division), SAP, PTC; Hybrid: Adobe,Ansys, Atlassian, Autodesk, Callidus Software, Jive Software, Nuance, Sage; SaaS: Brightcove, Cornerstone onDemand,Demand Ware, Intralinks, Marketo, NetSuite, New Relic, Paycom, Qualys, Salesforce, SPS Commerce, Ultimate SoftwareGroup, Veeva Systems, Workday, ZendeskSources: AV&Co. AnalysisTHE FUTURE OF SAAS: IS THERE LIGHT AT THE END OF THE TUNNEL? 9
WHITEPAPERB. Software vs. SaaS: Customer Lifetime Values (CLVs)Nonetheless, we evaluated one well-known software firm as it transitioned to SaaS.For this firm, we could compare customer lifetime value estimates for a typicalsoftware customer vs a typical SaaS customer. Per Figure 6, we found that thecompany would have to drive significant up/cross selling (an incremental 35% ofsubscription list pricing) as well as price increases (15%) for SaaS customers toreach the same CLVs as its software customers.Figure 6: For SaaS firms to match software firm contribution margins will requireaggressive up/cross-selling and price increasesExample Present Value of Customer ContributionMargins in Traditional License vs. SaaS ModelFlagship Product of a Leading Hybrid License/SaaS Provider 26% gap betweenLicense and “steadystate” SaaS1 Software license rack rate of 2,600 with15% maintenance subscription, discountedat 30%2 SaaS rack rate annual subscription of 600 1,758 1,613 1,792 1,297is discounted at 66% in year one, and 45%in every year thereafter3 SaaS annual subscription of 6004 Assumes 35% average revenue upsellstarting in year 25 Assumes 35% upsell (per above) AND 15%price increase in year 3 75912345Traditional Licenseand maintenanceSaaS(with discount;no upsell)SaaS(without discount;no upsell)SaaS(without discount;35% upsell)SaaS(without discount;35% upsell; 15%price increase)Still, one could argue that over time these CLVs could improve, and SaaS customerscould become more attractive, and potentially justify valuation multiples. How muchCLV improvement could justify a valuation hike?Figure 6 – Source: AV&Co. Research and Analysis, Provider website, earnings call and financial statements, TrefisResearch, Bridge Group, ZS Associates Research, Pacific Crest SaaS Survey. Assumptions: 6 year customer lifetimein both traditional and SaaS models. SaaS gross margins slightly lower than traditional (65% vs. 70%). SaaS new logocommission higher (in 2013, 10% SaaS vs. 4% traditional). SaaS cash flows accumulate over a longer period of time,resulting in less value due to discounting (time value of money). WACC 8%. * Contribution margin is calculated from therevenue for the product subtracted by the cost per acquisition (e.g. Sales Commission) and annual cost from the product(e.g. COGS)10 THE FUTURE OF SAAS: IS THERE LIGHT AT THE END OF THE TUNNEL?
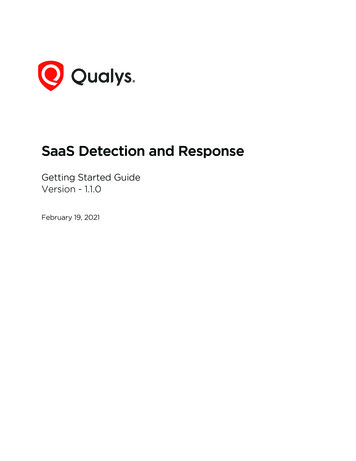
WHITEPAPERC. Software vs. SaaS: Market Cap GrowthTo test this, we conducted an additional analysis: We examined eight publicly tradedsoftware firms with stated strategies to shift from software to SaaS. We evaluatedthem over the first 5 years of their transition, as noted in Figure 7.Figure 7: Financial metrics dipped in the first 5 years for software firms transitioningto SaaS – but market caps surged 300%Performance During Software Firm Transition to SaaS(Years 1-6)1Avg. Revenue(% of pre-SaaSmigration revenue,indexed to 1 at startof migration)2Avg. OperatingMargin(% of revenue)120%100%100%80%Avg. MarketCapitalization(% of pre-SaaSmigration market cap,indexed to 1 at startof migration)010%12Revenue reachesminimum at year 23456Operating margin recovers topre-transition levels6%0%0%-10%3Revenue recovers topre-transition levels,begins to accelerate140%Operating margin reachesminimum at year 4012345656Market cap grows,market cap/revenue ratioincreases nearly 300%500%400%300%200%100%100%0%01234Across the eight firms, revenue fell in the early years, dropping on average 20% byyear two before recovering slowly to pre-transition levels by the fifth year. After that,revenue growth appears to accelerate. The margin story was less clear. Averageoperating margins slowly fell from 6% to slightly negative by year 4, before recoveringto pre-transition levels between year 5 and 6.Most interesting, during the same five-year period, while revenue and margins dippedbefore recovering only to pre-transition levels, the average valuation of these firmsincreased by nearly 300%. That’s quite a rise in the face of modest financial metricsduring the period.Is it reasonable that a company transitioning customers from onemethod of consuming an application to another has in parallelincreased its value by 300% in five years?Figure 7 – AV&Co. Research and Analysis, Autodesk, Callidus, Adobe, Intuit, PTC, Oracle, Sage and
NetSuite, New Relic, Paycom, Qualys, Salesforce, SPS Commerce, Ultimate Software Group, Veeva Systems, Workday, Zendesk. Sources: AV&Co. Analysis THE FUTURE OF SAAS: IS THERE LIGHT AT THE END OF THE TUNNEL? 5 WHITEPAPER. The Transition has been Uneven The impacts of SaaS have not been evenly distributed across a sea of application