Transcription
2011 SaaS Operating Metrics &Valuation BenchmarkingStudyMain Office:Raleigh Office:221 East Fourth Street, Suite 2400, Cincinnati, OH, 452023737 Glenwood Avenue, Suite 1000, Raleigh, NC, 27612www.rccf.com 2011 by River Cities Capital Funds513-621-9700919-573-6111
OverviewFounded in 1994, River Cities Capital Funds (“RCCF”) is a venture capital fund that invests 3 MM - 10MM in minority preferred equity positions in expansion-stage IT and Healthcare companies. We seek topartner with exceptional management teams to build great companies that offer significant potential forgrowth and superior returns for investors and entrepreneurs. The firm has raised 400 MM and made85 investments since forming its first fund in 1994.River Cities first encountered the SaaS model with its EVault investment in 2001. Since then, we’veinvested 45 MM in nine portfolio companies and have had four successful exits in our SaaS portfolio.The focus of our investment consideration in this segment is finding single instance, multi-tenant SaaScompanies with a critical mass of customers in a large market. Investment candidates will demonstrateattractive gross margins, strong customer renewals, efficient customer acquisition models and anexperienced management team.Select River Cities SaaS ExitsEvaultacquired bySeagateMX Logicacquired byMcAfee, Inc.Initial Public Offering 185 mm2007 170 mm2009 33 mm2010Initial Public Offering 57 mm2010Select River Cities InvestmentsVoice-based marketingautomation solutionsOnline Pre-constructionmanagement serviceClincal communicationsservice for hospitalsand physician practicesFor more information on our SaaS experience investing strategy, please contact:Rob HeimannDirector513-621-9700rheimann@rccf.comJune 2011Parag RathiSenior Analyst513-621-9700prathi@rccf.com2River Cities
Table of ContentsINTRODUCTION . 4SUMMARY OF KEY FINDINGS . 4SAAS INTRODUCTION . .6STUDY OVERVIEW . 6COMPANY PROFILES . 7CAPITAL EFFICIENCY . 8PUBLIC COMPS. IPO STATISTICS & FUNDING . 8CUMULATIVE CAPITAL EFFICIENCY. 9VALUATION METRICS . 11PUBLIC SAAS COMPANY VALUATION METRICS. 11SAAS MERGER AND ACQUISITIONS VALUATION METRICS . 14RIVER CITIES’ PORTFOLIO COMPANY VALUATION METRICS . 15KEY OPERATING METRICS . 16REVENUE GROWTH . 16GROSS MARGINS . 18SALES & MARKETING EFFECTIVENESS . 19RESEARCH & DEVELOPMENT . 23GENERAL & ADMINISTRATIVE . 24CAPITAL EXPENDITURE . 25PROFITABILITY . 26CONCLUSION . 28LOOKING AHEAD . 28June 20113River Cities
IntroductionSummary of Key FindingsBelow is a summary of the key findings from the following benchmarking report: Analysts estimate the size of the SaaS market to be 17 billion in 2010 growing to over 40 billionby 2014, which still represents less than 20% of the overall software market. To date only 25 SaaS companies have tapped the public market, out of which a couple, Omnitureand Salary.com were acquired in the last couple of years. Thus, currently there are 23 public pureplay SaaS providers across a myriad of industries. However, traditional software vendors continueto expand their SaaS offerings. As market adoption for SaaS businesses accelerates, so too does the appetite from public equityinvestors. In the 11.5 years ending July 2009, 17 SaaS companies had been taken public. Anadditional 8 have gone public since July 2009, including two River Cities’ portfolio companies,SciQuest and SPS Commerce. Public SaaS companies are still relatively small with only one company achieving revenue in excessof 1 billion and the majority less than 250 MM in revenue. The average public, pure-play SaaS Company generated 67 MM in trailing twelve months (TTM)revenue when it went public. To achieve this scale, those same public companies raised onaverage 57 MM of pre-IPO equity funding. Most industry estimates suggest that SaaS companies require approximately 50% - 70% morecapital to achieve cash flow breakeven than their traditional licensed software companycounterparts. Additionally, the average number of years for those SaaS companies to becomepublic increased to just less than 10 years from 8.5 a couple years ago. The primary SaaS valuation metrics include multiples of both recurring revenue and free cash flow,especially at maturity. Also important are contracted monthly recurring revenue growth, capitalefficiency and churn rates. Other qualitative considerations consist of intellectual property, pricingpower (e.g. switching costs, ability to up-sell additional applications, etc.) and market size. Public SaaS company valuations have returned to nearly six times TTM revenue, a level last seenin early 2008. The comparable average multiple of free cash flow at the date of this studyapproximates 40 times TTM EBITDA. Best-of-breed SaaS companies achieve gross margins in the 70% range and manage annual churnrates below 15%. SaaS vendors who have reached scale ( 75 MM in TTM revenue for purposesof this report) generate EBITDA margins in the high teens to low 20% range. Not surprisingly, giventhe attractive industry growth, most companies aggressively reinvest cash into productdevelopment and sales and marketing to fuel top-line growth, at the expense of near-termprofitability. As a result, only 11 out of 25 public SaaS companies reached EBITDA positiveoperations when they were sub 50 MM in revenue. In 2010, all the public comparables, exceptCornerstone OnDemand (-21%) and DemandTec (4%), generated EBITDA margins greater than 10%reflecting the maturity of the public comparables.June 20114River Cities
Ultimately, valuation is driven by confidence in a company’s ability to generate healthy free cashflow margins. Out of the 23 public comparables, Concur (24%), LogMeIn (22%), NetSuite (18%) andSalesforce.com (17%) generated the highest free cash flow margins in 2010 and it appears that themarket is rewarding these companies by valuing them at an average of 9.3 times revenue as ofMay, 2011. Particular attention in this study is devoted to sales and marketing efficiency and effectiveness.Well-performing SaaS companies achieve payback on sales and marketing investments in less than24 months, with the better performing SaaS companies achieving payback in less than 15 months.Simply translated, 24 month payback equates to a 50% ROI on sales and marketing investment and12 month payback represents 100% ROI. SaaS companies demonstrating payback below 15 months should consider further investment insales and marketing. Those experiencing longer than 2 year payback should probably consideralternate spend initiatives to drive more efficient growth. Every public SaaS company that we reported on in 2009 except Ultimate Software showedmeasurable detioration in their return on sales and marketing investments with the averagepayback increasing to 38 months in 2010 from 27 in 2008. Among the several new public SaaScompanies, only Responsys and SPS Commerce demonstrated improved ROI on sales andmarketing initiatives. Public SaaS companies spent an average 22% of revenue on research and development between 15 MM and 50 MM in TTM revenue. Influencing the percentage spend is price point, number ofcustomers served and level of a specificity/technicality associated with the service offering.Between 5 MM - 15 MM in TTM revenue, these same companies spent approximately 39%. An analysis of general and administrative expenses demonstrates that SaaS companies spendapproximately 2 MM at 10 MM in TTM revenue. Above 15 MM in revenue, companies tend toinvest about 20% of their revenue in general and administrative expenses. Not surprisingly, capital expenses for SaaS companies are higher than on-premise softwarecompanies, given the required infrastructure to host their customers’ data. Capital expenditurepercentage of revenue for public SaaS companies last year (2010) ranges from 5% to 12%.June 20115River Cities
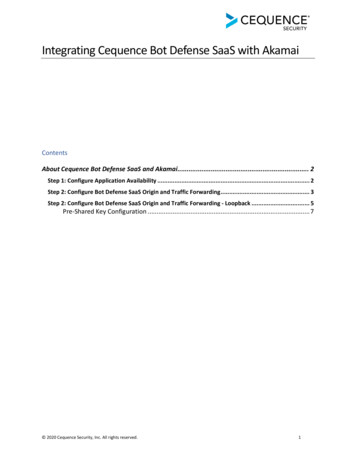
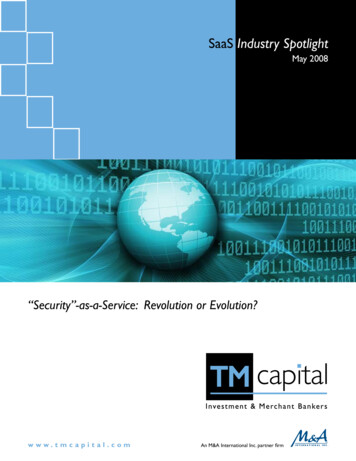
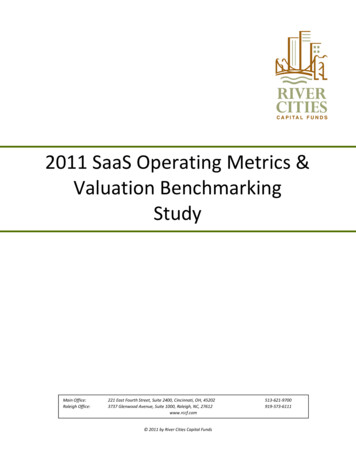
SaaS IntroductionSaaS represents a transformational delivery model for business software and associated data, both ofwhich are hosted in the cloud and accessed via a web browser. As compared to on-premise softwarevendors that maintain multiple versions of their software, pure SaaS vendors need only deploy andsupport a single instance of the software codebase across all of their customers. This multi-tenancyapproach extends significant economies of scale to customers by way of shared infrastructure andoperational support for the software.Demand for SaaS is driven by the need for customers to reduce IT-related costs, decrease deploymenttimes and foster innovation. Another popular benefit is that most customers pay a subscription alongthe way, eliminating hefty upfront software license fees. All in all, the SaaS model extends moreflexibility to customers, which is critical in an environment with economic uncertainty, changingworkplaces and escalating expectations.As a result of the abovebenefits, SaaS growth ratesare forecasted to be greaterthan five times that of theiron-premise rivals over thenext five years. Still underpenetrated, analystsestimate the SaaS marketachieved approximately 17billion in 2010 revenue. IDCGroup estimates that thesize of the SaaS market willreach 40.5 billion by 2014,which still represents lessthan 20% of the overallsoftware market.Estimated size of SaaS marketStudy OverviewGiven the recurring nature of the revenue model, SaaS businesses provide wonderful predictability.Considering River Cities’ nine SaaS portfolio company investments and metrics from public companiesduring their developmental period, we have established a best of breed analysis of key operatingmetrics, which supports fact-based recommendations to River Cities’portfolio companies. Additionally,the perspective and experience allows us to more critically assess new SaaS investment opportunities.Key operating metrics for the subject companies were collected for the years ending 2001-2010. Inaddition, data was collected from public companies’ S-1 filings to compare relative operating metrics ata comparable stage of development as our portfolio companies (e.g. pre- 50 MM revenue). Forexample, Salesforce.com, a 1.7 billion company was analyzed in the 2001 to 2003 time frame when ithad revenues between 5.4 MM and 96 MM. Key metrics considered in this study include capitalefficiency, revenue growth, gross margins, sales and marketing expenditure, research and developmentexpenditure, general and administrative expenditure, capital expenditures and EBITDA margins.June 20116River Cities
Company ProfilesGiven the emerging nature of the Software as a Service business model, currently there are only 23public pure play SaaS vendors. Salesforce.com is the largest, generating approximately 1.71 billion in2010 revenue. Revenue achievement drops substantially when considering the rest of the universe,most of whom are generating less than 250 MM in trailing twelve months revenue. The public SaaSuniverse spans a variety of services including E-commerce, Human Capital Management (HCM), ITsecurity, marketing, supply chain / procurement and other back office applications. The go-to-marketstrategies vary by company with some employing a broad base approach and most others throughvertical market specialization (including higher-education, legal, life sciences, retail and manufacturing).The following table profiles twenty five best-of-breed public SaaS companies and nine River Cities’portfolio companies that were considered in the study:1Revenue for salesforce.com is for the 12 month period ending January 2011.June 20117River Cities
Capital EfficiencyPublic Comps. IPO Statistics & FundingAs market adoption for SaaS businesses accelerates, so too does the appetite from public equityinvestors. In the 11.5 years ending July 2009, 17 SaaS companies had been taken public. An additional 8have gone public since July 2009 , including two River Cities’ portfolio companies, SciQuest and SPSCommerce. Two companies, Omniture and Salary.com were acquired, leaving 23 public pure play SaaScompanies as of May 2011.To access the public markets, the following 25 SaaS companies achieved average trailing twelve monthsrevenue of 67 MM with nine below 50 MM. The following chart highlights key IPO-related metrics ofthe public SaaS vendors before they went public:Growing a SaaS business is capital intensive because revenue and cash flow are typically spread out overthe life of the contract concurrent with the monthly delivery of the software services. Not surprisingly,the faster the company’s growth, the more capital that is required. By comparison, perpetual softwarelicense vendors typically collect the respective license fees upfront. Industry experts estimate that SaaSJune 20118River Cities
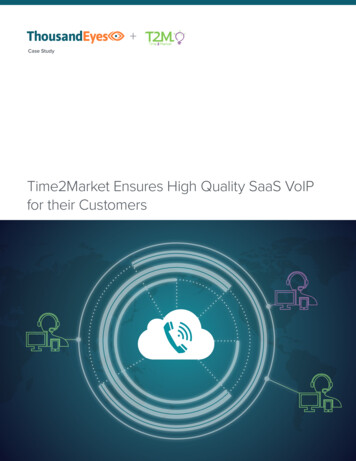
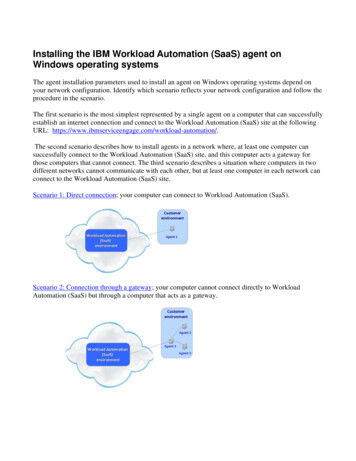
companies typically take longer to achieve cash flow breakeven than their license software companycounterparts. As noted above, the average pre-IPO equity raised for all twenty five companies was 57MM. 17 out of the 25 public SaaS companies had positive EBITDA margins at the time of their IPO.Cumulative Capital EfficiencyExhibit 3 highlights a simplistic efficiency ratio, which demonstrates the capital efficiency of a businessby measuring a company’s TTM revenue relative to the total amount of capital raised pre-IPO withincertain revenue ranges up to 50 MM in revenue. The ratio divides trailing twelve months (TTM)revenue by the cumulative debt and equity raised. A 200% ratio suggests that a company generated inTTM revenue twice the total debt and equity that it raised.(Note: As with all of the exhibits in this report, the graphs to the right of the chart include all availabledata points from the associated companies. A company might have multiple data points within theconsidered revenue range as it grows through the ranges over time.)To the extent stock or equity consideration for acquisitions was not publicly disclosed, their respectivecapital efficiency metrics are exaggerated since acquisition price is excluded from the denominator(total debt and equity raised.) Salary.com is such an example that attempted to grow through smallacquisitions, hit the wall during the recession and was forced to sell to Kenexa in September 2010. As aresult, their capital efficiency shown above is artificially high. Excluding Salary.com, Public SaaSJune 20119River Cities
companies posting revenue below 50 MM produced capital efficiency ratios between 6% and 173%.River Cities’ portfolio companies generated efficiency ratios between 15% and 158% in that same range.At the time of their IPO, SaaS companies gained significant leverage as the average capital efficiencyrose to approximately 150%. Only Concur (35%) and Liveperson (15%) posted efficiency ratiossignificantly less than 100% at the time of their IPO.Within River Cities’ portfolio, three efficient performers (including SciQuest and SPS Commerce)demonstrated capital efficiency ratios greater than 120%. SciQuest was the most efficient RCCFperformer generating 42.5 MM in TTM revenue on 23 MM in total capital raised. To gain betterinsight to the above ratios, we explore the sales and marketing effectiveness of each of these companiesin further detail later in this study.Note that Capital efficiency ratios for River Cities’ portfolio companies (including SciQuest and SPSCommerce) were calculated starting with the financing round in which RCCF first invested. As anexample, SPS raised a reported 73 MM,however, 43 MM was recapitalized in the 2002 financing inwhich River Cities first participated. Similarily, SciQuest raised a reported 154 MM, which includesequity required to take the Company public in 1999. River Cities participated in a take-privatetransaction in 2004 that effectively cleared 131 MM of prior equity from a failed dot com B-2-Bmarketplace strategy.June 201110River Cities
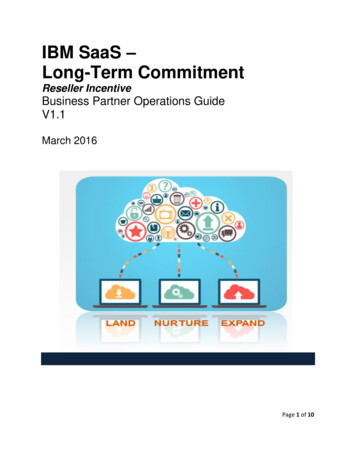
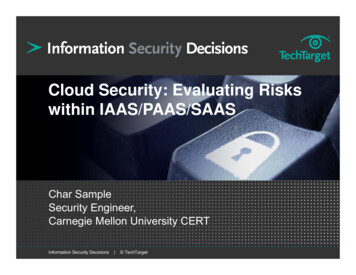
Valuation MetricsPublic SaaS Company Valuation MetricsWhile all companies are ultimately valued on the present value of their discounted future cash flows,industry analysts tend to rely more on comparable multiples of revenue and free cash flow (EBITDA usedas a proxy for cash flow) for valuing SaaS businesses. As of May 2011, public SaaS companies’ traded atapproximately 5.8 times TTM revenue and approximately 40 times EBITDA:Current public SaaS valuations represent a nice recovery from the downturn of late 2008 / early 2009and have recovered to median valuations of six times TTM revenue last seen in early 2008, although stillbelow the peak valuations in late 2007.June 201111River Cities
Exhibit 5 highlights that SaaSmarket valuations startedplummeting in 2008 andbottomed out in early 2009,down by about 75% from levelsachieved in late 2007. GivenSaaS growth rates are close tofive times those of traditionalpublic software companies, SaaSmultiples trade at a premiumover traditional public softwarecompanies, which tend to bevalued in the two to three timesTTM revenue range.However, we will see later in this report that the sales and marketing effectiveness of these companieshas declined significantly, implying that more capital is required to maintain revenue growth rates. Ascompanies require more cash to sustain revenue growth (relative to historic norms), one might questionthe ability to sustain valuations that are on median 5.8 times ttm revenue.Regardless of the economic environment, several other factors impact SaaS company valuations, thedominant consideration being revenue growth. Exhibit 6 shows that public companies deliveringstronger revenue growth are generally rewarded with higher valuation multiples. 9 of the 23 public SaaSvendors who achieved year over year growth of greater than 25% in Q1’11 averaged an EV / Revenuemultiple of 9.3x. Other important considerations include gross margin percentage, churn rates, pricingpower (e.g. switching costs, up-sell opportunities) and free cash flow margins.June 201112River Cities
While relative revenue growth rates are important across the sector, so too is the cost to sustain thosegrowth rates, which is not considered in Exhibit 6 above. Take NetSuite as an example. In 2008, thecompany demonstrated annual revenue growth of 39% with payback on sales and marketing2investment of 32 months at wh
SciQuest and SPS Commerce. Public SaaS companies are still relatively small with only one company achieving revenue in excess of 1 billion and the majority less than 250 MM in revenue. The average public, pure-play SaaS Company generated 67 MM in trailing twelve months (TTM) revenue when it