Transcription
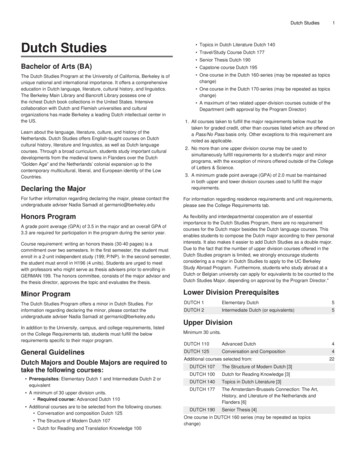
Journal of Financial Risk Management, 2019, 8, 55-72http://www.scirp.org/journal/jfrmISSN Online: 2167-9541ISSN Print: 2167-9533Financial Risk Management in Dutch SMEs: AnEmpirical AnalysisRené-Pascal van den BoomAvans University of Applied Science, Breda, The NetherlandsHow to cite this paper: van den Boom, R.P. (2019). Financial Risk Management inDutch SMEs: An Empirical Analysis. Journal of Financial Risk Management, 8, ved: March 12, 2019Accepted: June 2, 2019Published: June 5, 2019Copyright 2019 by author(s) andScientific Research Publishing Inc.This work is licensed under the CreativeCommons Attribution InternationalLicense (CC BY en AccessAbstractFinancial Risk Management plays an important role in safeguarding the continuity of enterprises. This paper analyzes current financial risk management(FRM) practices applied by Dutch Small and Medium-sized Enterprises(SMEs). In particular, the methods used by SMEs to manage credit risks, exchange rate risks, liquidity risks and interest rate risks. Data of 97 DutchSMEs, gathered in the period 2013-2017, show SMEs focus on risk processrather than setting up an organizational structure to embed the process.However, the attention firms pay on process is positively correlated to organizational structure. Where SMEs, within the risk management process, appear to have a correlated equal focus on risk identification, measurement andevaluation, mitigating risks seems to be treated more separately. Finally, theanalysis of possible determinants shows that the level of financial risk management in Dutch SMEs is determined by two variables: the level of educationof the risk manager and the degree of decentralization.KeywordsFinancial Risk Management, Risk Management Process, Small andMedium-Sized Enterprises (SMEs), Empirical Analysis1. IntroductionIn many developed economies, Small and Medium-sized Enterprises (SMEs) areimportant contributors to the business environment (Ayyagari et al., 2007; Burgstaller & Wagner, 2015). In The Netherlands, SMEs contribute 63% to GrossValue Added (GVA) and employ 67% of the labor force in 2012. Already, in thisdecade nearly 4200 Dutch SMEs went bankrupt. Figure 1 shows the number ofdefaults among small companies, 10 - 50 employees, and midsized companies,50 - 250 employees.DOI: 10.4236/jfrm.2019.82005 Jun. 5, 201955Journal of Financial Risk Management
R. P. van den BoomFigure 1. Defaults of dutch SMEs in this decade. The green line shows the number of defaults among small firms with 10 - 50 employees. The other line shows the number of defaults of midsized companies (50 - 250 employees). After de economic recession thenumber decreases over time. In 2018 defaults increased by 7, to 41 midsized companies.Source: CBS, “De Staat van het MKB”. January 11, 2019.Businesses are facing increasing challenges because of the growing variety ofmarkets and products required to meet their customers’ needs (Thun et al.,2011). Business risks appear in different forms and increase over time. Managingthese risks becomes of more importance. Where SMEs are less able to reducerisks strategically, i.e. increasing the variety of markets, products and suppliers,managing financial risks becomes of more importance to avoid the ensuing financial distress which increases the probability of default. Default risks chieflymanifest themselves during periods when SMEs encounter difficulties meetingtheir short-term liabilities. Liquidity problems occur when, for instance, creditors pay their debt later than expected or creditors do not pay at all. In addition,when products are sold in non-euros, the received amount in euros can be lessthan expected due to decreased exchange rates. For solving short-term liquidityproblems SMEs are highly dependent on loans from banks (Altman et al., 2010;Norden, 2015). It is imperative for SMEs to invest in sound financial risk management which can allow a firm to continue to raise capital (Rochette, 2009).The introduction of Basel II (1999) and III (2010) reinforced this inextricablelink between a firm’s ability to manage financial risks on the one hand andfunding on the other.Serveas & Tamayo (2009) concluded inadequate management of financialrisks is the main cause of 15% of all bankruptcies. A Graydon survey in 2014 onfirmed that 18% of bankruptcies of SMEs are due to insufficient risk management practices, such as failing administration and credit control. A literature review by Verbano & Venturini (2013) noted potential insolvency is due to the factthat SMEs lack resources to develop instruments to assess the financial soundnessof their businesses. The lack of resources and well-supported staff needed forsound risk management are also mentioned by Lavia & Hiebl (2014) and Burgstaller & Wagner (2015) probably because SMEs cannot afford to rededicate resourcesdue to their constraints (Marcelino-Sadaba et al., 2014).Falkner & Hiebl (2015) concluded a sufficient risk management process isimportant and further empirical research is required on risk identification, riskanalysis, strategy implementation and control as part of the risk managementprocess at SMEs. Still, in 2019, family firms, which the majority of SMEs are,show a lower adoption of risk management, especially in family firms wherethere is a family CEO (Hiebl et al., 2019). To the best of our knowledge, no reDOI: 10.4236/jfrm.2019.8200556Journal of Financial Risk Management
R. P. van den Boomsearch on financial risk management in Dutch SMEs has been carried out to thisdate.The purpose of this paper is to provide insight into the manner in whichDutch SMEs manage financial risks. We provide a framework to characterizeFRM activities which can help researchers. Our systematical approach may alsobe useful for practitioners to assess and improve their FRM. We use a stylizedmodel to describe FRM activities consisting of two risk management dimensions: risk management process and organizational structure. The risk management process consists of four components: risk identification, measurement,treatment and evaluation. Analysis of our data show that within the risk management process there is a strong correlation between risk identification, measurement and evaluation, with the exception of risk treatment. We also describeactivities within the organizational structure dimension and their relation to theprocess activities. An additional two factors, the level of education of the riskmanager and the degree of decentralization, contribute to the difference in levelsof financial risk management employed by Dutch SMEs.The remainder of this paper is organized as follows. Section 2 discusses the literature review relating to financial risks and financial risk management (FRM).The methodology on which the study is based is presented in Section 3. Section 4describes the data used to analyze current practices. We describe and discuss thestatus of Dutch SMEs in relation to the FRM aspects in Section 5. Finally, section6 summarizes the findings and recommendations.2. Literature ReviewFinancial risk management as assessing and overcoming the potential risks froma long-term strategic perspective, contributes to the firms’ value (Culp, 2002;Meulbroek, 2002; Jin et al., 2006; Rochette, 2009; Pérez-Gonzalez et al., 2013;Farrell and Gallagher, 2015). Keizer et al. (2002) define risk management as theprocess of creating value by using financial techniques and methodologies tomanage exposure to risk. This suggests that risk management is a process thatidentifies the loss exposure faced by organizations on the basis of which the mostappropriate technique for addressing such exposures is selected (Rejda, 2011).According to Vaughan & Vaughan (2001) risk management starts with the identification of external events that have an impact on the achievement of primarybusiness objectives. Measuring/analyzing this impact is the next step necessaryin making a rational decision on how to control the risk. This may involve thedecision for the company either to avoid, reduce, transfer or treat the risk by thecompany itself. Therefore, the third step is to decide and execute the decision.For instance, by instructing employees when the execution of risk managementactions is decentralized. The process ends with an evaluation of the decision interms of the effect of risks on achieving companies’ goals. This final step includes aspects relating to efficiency, the costs of risk treatment and the effect oncompanies’ risk goals.DOI: 10.4236/jfrm.2019.8200557Journal of Financial Risk Management
R. P. van den BoomBeauchamp-Akatova & Curran (2013), similar to the ISO Risk ManagementStandard (Ciocoiu & Dobrea, 2010), note risk management should be a continuous and developing process embedded within the organizational strategy. Riskevaluation should be an integral part of all decisions. According to Rejda (2013),the risk management process is institutionalized when all key business managers, taking part in the risk management process and assuming ownership ofrisks, impart the risk management process to the entire organization throughstaff training. In addition to a well-structured organization, a strong and consistent risk culture is required to embed the risk management process (Elahi, 2013).In those cases where management delegates responsibilities and authorities ofeach of the previous mentioned actions to more junior staff, it is important toensure that the risk behavior is aligned with the managers’ risk appetite. Moreover, risk awareness of employees and an internal risk culture should be alignedwith strategies and objectives (COSO, 1992). Spreading out risk ownershipthroughout the entire company, and at the same time improving risk awareness,knowledge and skills (Nocco & Stulz, 2006; Servaes & Tamayo, 2009) may bemostly informal in SMEs (Gao et al., 2013). Sukumar et al. (2011) confirmedformal learning programs and continuous education to employees are rarely offered (Sukumar et al., 2011).Results of an empirical research on German SMEs (Henschel, 2006) show thatthe handling of risks is strongly concentrated on owner-managers and that riskmanagement is carried out in a rather rudimentary way. In most firms the linkbetween risk management and business planning is not well developed. Servaes& Tamayo (2009) show that in many cases risk-based thinking is not incorporated into every-day business activities and corporate strategies. Defining objectives for the risk management function, measuring and evaluating risk management itself, should be the next step towards a more effective risk managementprocess. Kim & Vonortas (2014) investigated aspects of risk management inyoung small enterprises. They conclude that firms across all types of sectors useinternal risk mitigation strategies to manage technology risks and operationalrisks. Financial risk is managed by tapping informal and formal networks suchas strategic alliances. Brustbauer (2016) confirms that compared to larger firms,smaller firms generally put less effort in identifying, assessing and monitoringrisks. This may be the result of an entrepreneur’s personal interpretation and theability to manage the risks.Previous research shows that size is an indicator for the level of risk management applied (Alexander, 1949; Colquitt et al., 1999; Henschel, 2008; Beasley,2005; Virdi, 2005; Brustbauer, 2016). Various studies have moreover identified anumber of external factorsas distinguishing factors: type of industry (Beaver,1966, Beasley, 2005; Henschel, 2008 and Bodnar, 2013), high growth business(Virdi, 2005), external accountant and regulations (Beasley, 2005) and the volatility of financial performance (Hoyt & Liebenberg, 2008). Other studies introduced internal factors. Dickinson (2001), Beasley (2005), Henschel & Gao (2011)argue that internal factors, such as a manager’s personal risk aversion, determineDOI: 10.4236/jfrm.2019.8200558Journal of Financial Risk Management
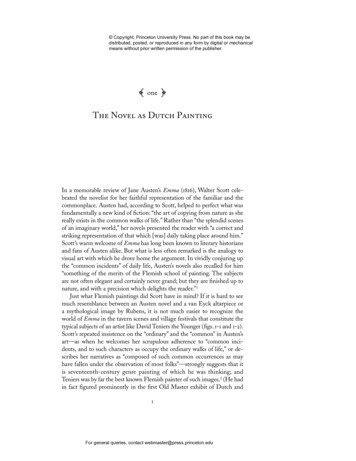
R. P. van den Boomthe level of risk management applied. Beasley (2005) found the presence of acorporate risk officer as a possible determinant. Colquitt et al. (1999) and Bodnar (2013) found background and training of the risk manager to be determining factors. To the best of our knowledge the factors pertaining to the level ofeducation of the risk manager, the number of subsidiaries and the degree of decentralization have not yet been discussed or tested as determinants for the levelof financial risk management applied at SMEs. In this research these three newvariables as well as the size factor are included as possible determinants.3. MethodologyTo explore management of financial risks, a framework tailored for SMEs needsto be developed. Also, this framework needs to be helpful in assessing determinant factors. In line with Monda & Giorgino (2013) we define financial riskmanagement (FRM) as a systematic and integrated approach to the managementof short-term financial risks that a company faces. Our model embodies two dimensions: a well-defined risk management process and an organizational structure necessary to implement and maintain the process. Figure 2 shows our proposed stylized financial risk management model.The risk management process dimension is defined as a step-by-step approachfollowing Vaughan & Vaughan (2001). The risk management process includesfour components: risk identification, measurement, treatment and evaluation.The first step is the identification of risk areas. Next for each risk area the exposure to risk is measured. Then, decisions can be made and executed at predetermined levels throughout the firm. The process ends by evaluating the outcomein terms of efficiency, costs of the instruments used, and effectiveness as theachievement of the objectives in terms of exposure. This step also includes anevaluation of the total process and reporting to the risk management or theboard. Each component comprises several items.The second dimension, organizational structure, also comprises four components. Financial risk policies, sources used for developing policies, financial risktargets and the allocation of FRM responsibilities effectively support the processin achieving the firms’ overall strategy and objectives. COSO (1992) uses theterms strategies and objectives for resp. policies and targets. Evaluation and reporting of the outcomes of the process (COSO, 1992) are included in responsibilities. Here too, each component comprises several items.Table 1 presents the breakdown of financial risk management in 2 dimensions, 8 components and 21 items. The last column denotes the measurementscale for each item1. Closed-end questions for each item form the basis of ourquestionnaire which is used for gathering data. The answers of the nominal scalequestions are used to describe risk activities performed by SMEs. For instance,the question related to item ‘defining risk areas’ is: We determine our risk areas:[1] Not, [2] Per transaction, [3] From our business planning, [4] from ourHenschel (2005) and Brustbauer (2016) included ordinal as well as nominal scaled items.1DOI: 10.4236/jfrm.2019.8200559Journal of Financial Risk Management
R. P. van den BoomFigure 2. Stylized financial risk management model. Our model contains two dimensionsof FRM: the Risk Management Process and the Organizational Structure required for executing and monitoring the process. Each dimension contains four components.Table 1. FRM breakdown in dimensions, components and items.DimensionsComponentsItems1) Defining risk areas (5)A) Identification 2) Prioritizing risk areas (5)B) MeasurementRisk ManagementProcessC) TreatmentD) EvaluationE) scaleOrdinalOrdinal3) Time horizon exposure (3)Nominal4) Risk area targets (4)Ordinal5) Risk area exposure (3)Ordinal6) Risk management software (4)Ordinal7) Satisfaction software (4)Ordinal8) Risk management instructions (4)Nominal9) Risk attitude (3)Ordinal10)Learning programs (4)Ordinal11) Process evaluation (3)Ordinal12) Risk area policies (5)Ordinal13) Reporting risk process (3)Ordinal14) Reporting outcome process (5)Ordinal15) Reporting risk management (5)Nominal16) Implementing risk management (5)Nominal17) Executing risk management (5)Nominal18) Evaluating risk management (5)NominalF) Policies FRM 19) FRM policies firm’s level (4)OrdinalG) Sources FRM 20) Sources used (4)OrdinalH) Targets FRM 21) FRM targets firm’s level (5)OrdinalThis table presents the breakdown of FRM. Each dimension consists of four components. Each componentscomprises several items. Each item refers to one question of our questionnaire. The number of answeringcategories per question is put in parentheses. 15 questions are nominally scaled, six are ordinally scaled. Inthe final column the type of answering categories is presented.DOI: 10.4236/jfrm.2019.8200560Journal of Financial Risk Management
R. P. van den Boombusiness planning with external developments or [5] from our long term strategy. The other 15 questions are ordinally scaled and form the basis of the riskmanagement scores. Component scores are calculated as the unweighted averages of related item scores. Dimension scores are calculated as the unweightedaverages of related components. All scores are calculated on a 1 - 5 scale.Four questions (size, number of subsidiaries, level of education and degree ofdecentralization) served as possible determinants for FRM activities, one question to categorize firms by type of industry. Since we also asked firms to scoreprocess items related to their main financial risk area, one final question relatedto the most important financial risk area ended the questionnaire. Then, independent enterprises complying with The Commission of the European Communities’ (2003) criteria regarding size (10 - 249 FTEs) were approached to takepart in this study. These firms were asked to answer the process questions fromthe point of the most important risk area. After screening the quality of thequestionnaires received during the period 2013-2016, 97 cases were selected. Independent of the type of risk the answers of process related questions can becompared for one risk management standard should be sufficient to manage alltypes of risks (Kogan & Nikonov, 2009).Considering the ordinal scale items, FRM at Dutch SMEs is described per riskdimension and per component in terms of frequencies, means and standarddeviations. The correlations between risk dimensions and components are analyzed using Pearson’s correlation. The correlation between items using Spearman’s rho. For testing the possible determinants firms are divided into differentcategories. T-tests on means of dimensions and items were run per category.4. Data and Summary StatisticsFor Dutch SMEs publicly available data are scarce or non-existent. A surveymethod is an appropriate method for collecting relevant data collection (Kellermanns & Eddleston, 2004). Our empirical study was carried out using data of 97Dutch SMEs which participated in the survey and sufficiently completed thequestionnaire. The selected companies are classified by primary activities:Trade/Service/Logistics (n 37), Engineering (35), Construction (13), IT (7) andAuditing/Training/Consulting (5). Characteristics as regards level of educationof the risk manager, size, degree of decentralization and number of subsidiariesare presented in Table 2 and Table 3.We expect larger firms to be able to afford more highly educated staff. UsingHenschel’s categorization, 34% (33/97) of our data relates to small firms (“10 50 FTE”; Henschel: 14%), 56% (54/97) to medium sized firms (“51 150 FTE”and “151 250 FTE”; 82%) and 10% (10/97) to large firms (“ 250”; 4%). Table2 shows that 44% of the firms have staff with a level of education exceeding abachelor’s degree. Although the level of education increases with size (in 42% 44% - 50% have a level higher than a bachelor’s degree), the differences are verysmall. Regression analysis confirms a possible positive, although not significantcorrelation(r 0.095; p 0.356).DOI: 10.4236/jfrm.2019.8200561Journal of Financial Risk Management
R. P. van den BoomTable 2. Data following the level of education and company size (FTE).Size (FTE)Educational level risk manager - 5051 - 150151 - 250Proportion “Fit” Bachelor1930554 Bachelor1424543Total33541097Proportion Bachelor42%44%50%44%This table presents the level of the risk manager’s education and size of 97 SMEs. The percentages “Proportion Bachelor” are calculated as follows: number of “ Bachelor”/“Total”.Table 3. Data by number of subsidiaries and degree of decentralization.Degree of edTotalProportion as expectedNo23163959%Yes29295850%Total52459754%This table presents the degree of decentralization related to number of (international) subsidiaries. 52(54%) out of 97 firms organize their financial risk management in a centralized manner. 59% (23/39) offirms without subsidiaries organize their risk management as expected, namely in a centralized manner.The cell “Total” in the column “Proportion as expected” contains a percentage which is calculated using thebold numbers, as follows: [23 (no – centralized) 29 (yes – decentralized)]/97.Firms with subsidiaries are expected to manage financial risk in a decentralized manner (Table 3). A firm’s degree of centralization is categorized as “Centralized” when tasks, responsibilities and authorities with respect to FRM aresolely allocated to senior management (54% 52/97). We expect firms with subsidiaries to be inclined to decentralize tasks, responsibilities and authorities, andfirms without subsidiaries to apply a centralized approach. Table 3 shows that in54% ((23 29)/97) of all cases risks are controlled at the expected level. In bothgroups the majority meet our expectation (59% and 50% respectively). This isconfirmed through correlation analysis (r 0.110, p 0.283).Unreported results show that firms with a higher number of subsidiaries employ a larger labor force (r 0.110, p 0.035). In addition, firms that approachrisk management in a more decentralized manner tend to have more highlyeducated risk managers (r 0.2281, p 0.024).Table 4 presents the main risk areas reported by the firms in question as themost or second most important by type of industry. Credit risk 79% (77/98) andliquidity risk 47% (46/98) are mentioned as the most significant risk areas2. 50%(19/38) of all SMEs with their core business in trade/services/logistics mentioneda different risk area as the most or second important. 12 of these SMEs refer toIn the period 2008-2013, in the Netherlands approximately 25% of all defaulted SMEs was causedby late or none payments of their clients. The growing attention in the last 50 years for developingsophisticated rating models for financial and non-financial institutions, and the presence of allkinds of instruments to deal with debtor’s risk, i.e. factoring, support our outcome.2DOI: 10.4236/jfrm.2019.8200562Journal of Financial Risk Management
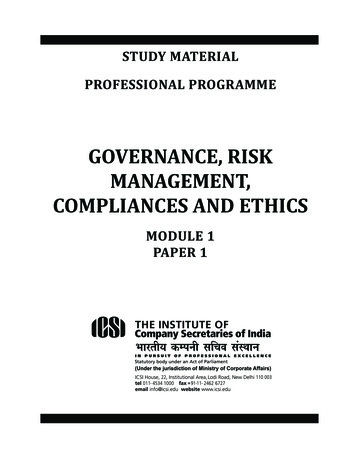
R. P. van den BoomTable 4. Self-reported financial risk by type of industry.Self-reported main risk areasType of IndustryCreditLiquidity Exchange s/logistics204211037Total4821312497511131135This table presents summary statistics of 97 Dutch SMEs that participated in this survey, classified by typesof industry and the number of times that various types of risk were reported as most important risk areas.Using Henschel’s categorization (Henschel, 2008), 5% of our data refers to Auditing/consulting/training(Henschel: 11%), 13% to Construction (31%), 36% to Engineering (35%), 7% to IT (11%) and 38% toTrade/services/logistics (12%). In these two largest types of industries the percentages of credit and liquidityrisks are 46% and 20% respectively (engineering), and 20% and 11% respectively (trade/services/logistics).the risk of inventory, which is understandable considering the fact that in suchfirms inventory forms a considerable part of current assets.The credit risk aspect mainly comes into play when shorter time horizons aretaken into consideration. Unreported data show that firms with subsidiaries appear to define their risk areas on the basis of a longer time horizon.5. ResultsThis section describes the most important outcomes of our study. We have twoobjectives: 1) to describe the current financial risk management activities appliedby Dutch SMEs and 2) to test the variables (education level of the risk manager –degree of decentralization – size by number of FTEs – number of subsidiaries) asdeterminants for the level of financial risk management at Dutch SMEs.In the first subsection we report FRM activities at SMEs. Basic statistics andcorrelations per dimension, per component as well as per item are discussed.Next, frequencies of the allocation of responsibilities per possible determinantare reported. Last, we analyze whether our selected variables are possible determinants for FRM activities using t-test per component and per item. Interestingresults are mentioned in the comments.5.1. Financial Risk Management Activities at SMEsIn this subsection activities are described at component level. Noticeable resultsof correlation analysis between components within the process dimension aswell as with components within the organizational structure dimension are included. We define a firm as an underperformer when the firms’ componentscore is below the average score.Financial Risk Management Dimensions and ComponentsTable 5 reports basic statistics, means and standard deviations, of the four riskprocess components scores and three3 of the organizational components. TheOrganizational component responsibilities only consist of nominal scaled items.3DOI: 10.4236/jfrm.2019.8200563Journal of Financial Risk Management
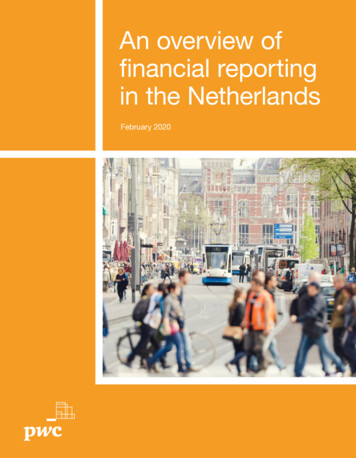
R. P. van den BoomTable 5. Descriptives and correlations FRM components.DescriptivesPearson’s correlations, n 97ComponentsMeanSt.devABCDEA) Identification3.320.987B) Measurement3.150.8600.348**C) Treatment3.341.2540.096D) Evaluation3.251.2130.531** 0.582**F). Policies2.721.8370.352** 0.377** 0.292** 0.609**G). Sources2.921.3970.334** 0.384** 0.306** 0.517** 0.442**H) Targets3.031.7230.420** 0.350**FG.1610.1870.1380.614** 0.716** 0.382**In this table Pearson’s correlation is used for all scores are measured on a ratio scale. The mean scores andstandard deviations of risk process components in the third and fourth column respectively, represent theunweighted averages of the item scores related to the components. **. Correlation is significant at a 0.01level (2-tailed).calculated scores are sufficiently different (all standard deviations 0.85) compared to a standard deviation of 1.4 when answers are equally distributed.The component “Mean” in Table 5 implies SMEs put more effort in managing the process (all means 3.15) than in the organizational structure (all means 3.04). Even so, analysis shows firms put effort in both dimensions simultaneously (r 0.684; p 0.000), exacerbated by a 81% (17/21) significance rate atcomponent level.Table 5 demonstrates a strong correlation between identification, measurement and evaluation, which implies that within dimension “process” SMEsmanage treatment separately. However, in the group of underperformers onidentification (n 46) we note 59% (27/46) of these firms also underperform intreatment. In addition, nearly 75% of the underperformers on measurement alsounderperform in treatment. So, we adjust our former implication: the components identification, measurement and evaluation are strongly correlated withinthe total group, treatment is correlated to the other components only in thegroup underperformers.Table 5 also presents a coherent organizational structure. Firms which establish policies use sources as basis for policies and use targets that are transposedfrom policies.Financial Risk Management Items: Components in DetailTable 6 reports basic statistics, means and standard deviations of all items. Allscores are sufficiently different (all standard deviations 0.85) compared to astandard deviation of 1.4 when answers are equally distributed.As far as Identification is concerned, one would expect SMEs to define the riskareas before prioritizing. The figures in Table 6 show that firms are slightly indifferent (r 0.283, p 0.005). Unreported data shows most firms distract risksfrom business planning (46), of which 20 prioritize risk areas by exposures froma historical perspective. 27 firms identify risks at transaction level, of which onlyDOI: 10.4236/jfrm.2019.8200564Journal of Financial Risk Management
R. P. van den BoomTable 6. Descriptives and correlations FRM items.Correlations, Spearman’s rho, n 97ItemsMeanSt.dev121) Defining risk areas3.281.2312) Prioritizing risk areas3.371.227 0.283**4) Risk area targets3.351.665 0.305** 0.313**45679101112135) Risk area exposure3.101.1680.010 0.275** 0.1706) Risk management software2.691.1800.0680.0390.0700.251*7) Satisfaction software3.491.449-0.0360.1810.1760.1210.230*9) Risk attitude3.491.5280.0220.1460.1470.1090.057 0.289**10) Learning programs3.191.506-0.0340.019 00.150.078-0.09911) Process evaluation3.411.370 0.372** 0.392** 0.464** 0.232*0.140 0.294** 0.231*12) Risk area policies3.601.4550.255* 0.325** 0.634** 0.1870.04013) Reporting risk process3.231.7770.215* 0.480** 0.225* 0.239*0.148 0.295** 0.0760.070 0.414** 0.361**14) Reporting outcomeprocess2.731.6800.256* 0.317** 0.395** 0.247*0.154 0.304** 0.1320.066 0.527** 0.455** 0.617**19) FRM policies firm’s level2.721.836 0.265** 0.297** 0.415** 0.214*20) Sources used2.911.38821) FRM targets firm’s level3.031.723 0.365** 0.279** 0.497** 0.1760.214* 0.278** 0.1900.0540.327* 0.249* 0.0011419200.110 0.406**0.1500.252* 0.281** 0.007 0.379**0.230*
when products are sold in noneuros, the received amo- unt in euros can be less than expected due to decreased exchange rates. For solving short-term liquidity problems SMEs are highly dependent on loans from banks (Altman et al., 2010; Norden, 2015). It is imperative for SMEs to invest in sound financial risk man-