Transcription
LETTERdoi:10.1038/nature11082Topological domains in mammalian genomesidentified by analysis of chromatin interactionsJesse R. Dixon1,2,3, Siddarth Selvaraj1,4, Feng Yue1, Audrey Kim1, Yan Li1, Yin Shen1, Ming Hu5, Jun S. Liu5 & Bing Ren1,6The spatial organization of the genome is intimately linked to itsbiological function, yet our understanding of higher order genomicstructure is coarse, fragmented and incomplete. In the nucleus ofeukaryotic cells, interphase chromosomes occupy distinct chromosome territories, and numerous models have been proposedfor how chromosomes fold within chromosome territories1. Thesemodels, however, provide only few mechanistic details about therelationship between higher order chromatin structure and genomefunction. Recent advances in genomic technologies have led to rapidadvances in the study of three-dimensional genome organization. In particular, Hi-C has been introduced as a method for identifying higher order chromatin interactions genome wide2. Here weinvestigate the three-dimensional organization of the human andmouse genomes in embryonic stem cells and terminally differentiated cell types at unprecedented resolution. We identify large,megabase-sized local chromatin interaction domains, which weterm ‘topological domains’, as a pervasive structural feature of thegenome organization. These domains correlate with regions of thegenome that constrain the spread of heterochromatin. The domainsare stable across different cell types and highly conserved acrossspecies, indicating that topological domains are an inherentproperty of mammalian genomes. Finally, we find that theboundaries of topological domains are enriched for the insulatorbinding protein CTCF, housekeeping genes, transfer RNAs andshort interspersed element (SINE) retrotransposons, indicatingthat these factors may have a role in establishing the topologicaldomain structure of the genome.To study chromatin structure in mammalian cells, we determinedgenome-wide chromatin interaction frequencies by performing theHi-C experiment2 in mouse embryonic stem (ES) cells, human ES cells,and human IMR90 fibroblasts. Together with Hi-C data for the mousecortex generated in a separate study (Y. Shen et al., manuscript inpreparation), we analysed over 1.7-billion read pairs of Hi-C datacorresponding to pluripotent and differentiated cells (Supplementary Table 1). We normalized the Hi-C interactions for biases in thedata (Supplementary Figs 1 and 2)3. To validate the quality of our Hi-Cdata, we compared the data with previous chromosome conformationcapture (3C), chromosome conformation capture carbon copy (5C),and fluorescence in situ hybridization (FISH) results4–6. Our IMR90Hi-C data show a high degree of similarity when compared to a previously generated 5C data set from lung fibroblasts (Supplementary Fig. 4).In addition, our mouse ES cell Hi-C data correctly recovered a previously described cell-type-specific interaction at the Phc1 gene5(Supplementary Fig. 5). Furthermore, the Hi-C interaction frequenciesin mouse ES cells are well-correlated with the mean spatial distanceseparating six loci as measured by two-dimensional FISH6(Supplementary Fig. 6), demonstrating that the normalized Hi-C datacan accurately reproduce the expected nuclear distance using an independent method. These results demonstrate that our Hi-C data are ofhigh quality and accurately capture the higher order chromatin structures in mammalian cells.We next visualized two-dimensional interaction matrices using avariety of bin sizes to identify interaction patterns revealed as a result ofour high sequencing depth (Supplementary Fig. 7). We noticed that atbin sizes less than 100 kilobases (kb), highly self-interacting regionsbegin to emerge (Fig. 1a and Supplementary Fig. 7, seen as ‘triangles’on the heat map). These regions, which we term topological domains,are bounded by narrow segments where the chromatin interactionsappear to end abruptly. We hypothesized that these abrupt transitionsmay represent boundary regions in the genome that separate topological domains.To identify systematically all such topological domains in thegenome, we devised a simple statistic termed the directionality indexto quantify the degree of upstream or downstream interaction bias fora genomic region, which varies considerably at the periphery of thetopological domains (Fig. 1b; see Supplementary Methods for details).The directionality index was reproducible (Supplementary Table 2)and pervasive, with 52% of the genome having a directionalityindex that was not expected by random chance (Fig. 1c, false discoveryrate 5 1%). We then used a Hidden Markov model (HMM) based onthe directionality index to identify biased ‘states’ and therefore inferthe locations of topological domains in the genome (Fig. 1a; seeSupplementary Methods for details). The domains defined by HMMwere reproducible between replicates (Supplementary Fig. 8).Therefore, we combined the data from the HindIII replicates andidentified 2,200 topological domains in mouse ES cells with a mediansize of 880 kb that occupy ,91% of the genome (SupplementaryFig. 9). As expected, the frequency of intra-domain interactions ishigher than inter-domain interactions (Fig. 1d, e). Similarly, FISHprobes6 in the same topological domain (Fig. 1f) are closer in nuclearspace than probes in different topological domains (Fig. 1g), despitesimilar genomic distances between probe pairs (Fig. 1h, i). These findings are best explained by a model of the organization of genomic DNAinto spatial modules linked by short chromatin segments. We definethe genomic regions between topological domains as either ‘topological boundary regions’ or ‘unorganized chromatin’, depending ontheir sizes (Supplementary Fig. 9).We next investigated the relationship between the topologicaldomains and the transcriptional control process. The Hoxa locus isseparated into two compartments by an experimentally validated insulator4,7,8, which we observed corresponds to a topological domainboundary in both mouse (Fig. 1a) and human (Fig. 2a). Therefore,we hypothesized that the boundaries of the topological domains mightcorrespond to insulator or barrier elements.Many known insulator or barrier elements are bound by the zincfinger-containing protein CTCF (refs 9–11). We see a strong enrichment of CTCF at the topological boundary regions (Fig. 2b andSupplementary Fig. 10), indicating that topological boundary regions1Ludwig Institute for Cancer Research, 9500 Gilman Drive, La Jolla, California 92093, USA. 2Medical Scientist Training Program, University of California, San Diego, La Jolla, California 92093, USA.Biomedical Sciences Graduate Program, University of California, San Diego, La Jolla, California 92093, USA. 4Bioinformatics and Systems Biology Graduate Program, University of California, San Diego, LaJolla, California 92093, USA. 5Department of Statistics, Harvard University, 1 Oxford Street, Cambridge, Massachusetts 02138, USA. 6University of California, San Diego School of Medicine, Department ofCellular and Molecular Medicine, Institute of Genomic Medicine, UCSD Moores Cancer Center, 9500 Gilman Drive, La Jolla, California 92093, USA.30 0 M O N T H 2 0 1 2 VO L 0 0 0 N AT U R E 1 2012 Macmillan Publishers Limited. All rights reserved
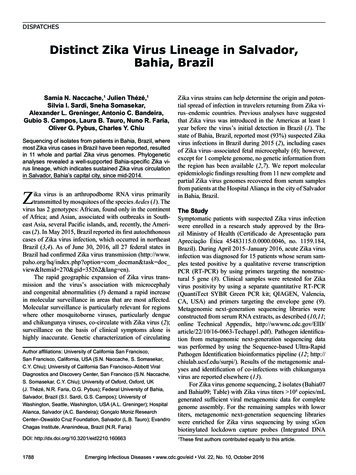
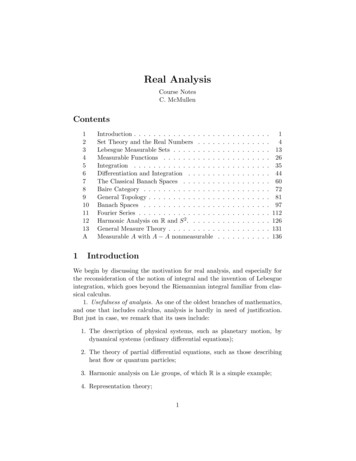
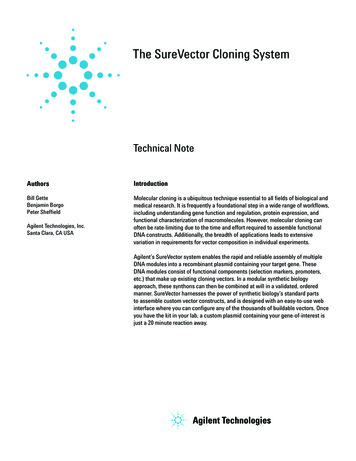
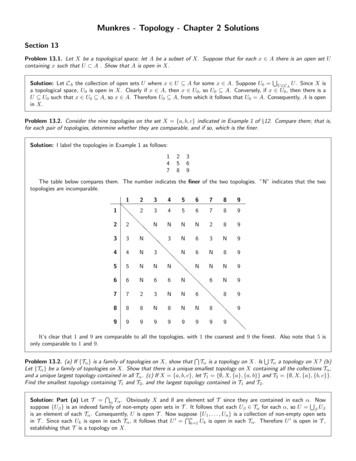
RESEARCH LETTER100Normalizedinteracting counts0Intra-domainInter-domain4030201000 0.5 1.0 1.5 2.0Genomic distance (Mb)dra InterInt74500000 74600000FISH probes:Domain 2Domain 1Chr2:DomainHMM state50 -HMM statemESC DImESC DICTCF binding sites per 10 kbb‘Inter-domain’g96200000 96300000Inter-domainHoxd 3Hoxd12Hoxd4Hoxd11Mir10bHoxd10Hoxd9Hoxd8iMeasured distanceSquared interprobedistance (d2)between FISH probesIntra-domainHoxb clusterGenomic distanceGenomic distance (kb)between FISH probeshCTCF0.3e0.10–500 kbhESC0Boundary0.10hESC domain30hESC DI–30IMR90 domain30IMR90 DI–3016hESC H3K9me3016IMR90 H3K9me300.040.020.00Figure 1 Topological domains in the mouse ES cell genome. a, NormalizedHi-C interaction frequencies displayed as a two-dimensional heat mapoverlayed on ChIP-seq data (from Y. Shen et al., manuscript in preparation),directionality index (DI), HMM bias state calls, and domains. For bothdirectionality index and HMM state calls, downstream bias (red) and upstreambias (green) are indicated. b, Schematic illustrating topological domains andresulting directional bias. c, Distribution of the directionality index (absolutevalue, in blue) compared to random (red). d, Mean interaction frequencies at allgenomic distances between 40 kb to 2 Mb. Above 40 kb, the intra- versus interdomain interaction frequencies are significantly different (P , 0.005, Wilcoxontest). e, Box plot of all interaction frequencies at 80-kb distance. Intra-domaininteractions are enriched for high-frequency interactions. f–i, Diagram of intradomain (f) and inter-domain FISH probes (g) and the genomic distancebetween pairs (h). i, Bar chart of the squared inter-probe distance (from ref. 6)FISH probe pairs. mESC, mouse ES cell. Error bars indicate standard error(n 5 100 for each probe pair).share this feature of classical insulators. A classical boundary elementis also known to stop the spread of heterochromatin. Therefore, weexamined the distribution of the heterochromatin mark H3K9me3 inhumans and mice in relation to the topological domains12,13. Indeed,we observe a clear segregation of H3K9me3 at the boundary regionsthat occurs predominately in differentiated cells (Fig. 2d, e andSupplementary Fig. 11). As the boundaries that we analysed inNon-boundaryassociated27,122 500 kbIMR90mESCCortexfBoundaryseparates twoLAD domainsBoundaryseparates LAD andnon-LAD domainBoundaryseparates twonon-LAD domainsBoundary Boundary 500 kb 500 kblog2 (H3K9me3/input)3.003.0Boundary 500 kblog2 ciated4,846500.120.08All CTCF sites31,968c0.2Boundary Boundary 500 kb 500 kblog2 (H3K9me3/input)50 -–50Gm53Hoxb3 xb9Hoxb4Hoxb7Hoxb6Hoxb5HIBADHHOXA1 EVX1NS5ATP1JAZF1BC031342HOXA7HOXA9HOXA2BC034444 A6HOXA131,159 shared boundaries‘Intra-domain’Median normalizedinteraction countsDegree of biasBBiasedupstreamChr11:FISH probes:Normalized interacting counts00 10 20 30 40 50DI (absolute value)dAFalse positiverate 1%0.227500000–301,754 shared boundaries0.60.4Putative boundaryBiaseddownstreameDI (actual)DI (random)0.827000000SKAP2Distance of 80-kbP-value 1.65 10–126AInteractions upstream1.0100 200 300 400 500 600 700cInteractions downstreamB600Chr7:Domains30DI -0b1 – Empiricalcumulative 00Domains50DI–50HMM state5CTCF0.2H3K4me3 5 0.3RNA PolII 5 0.5p300 30.2H3K4me1 30.2Stk31NpyMpp6 CycsCbx3 Skap2Evx1Jazf1Creb5Chn22410003K15RikDfna5 Npvf Nfe2l3Hoxa1HibadhTrilIgf2bp3Hnrnpa2b1Hoxa2 ik9430076C15RikHoxa4 Mir196bCcdc126C530044C16RikSnx10Hoxa5 Hoxa10D330028D13RikHoxa6 Hoxa11Mira Hoxa13Hoxa7 5730457N03RikfCS5 insulatoraNormalizedinteracting countsNormalizedinteractingcountsa2 PH2LOC647012Figure 2 Topological boundaries demonstrate classical insulator orbarrier element features. a, Two-dimensional heat map surrounding the Hoxalocus and CS5 insulator in IMR90 cells. b, Enrichment of CTCF at boundaryregions. c, The portion of CTCF binding sites that are considered ‘associated’with a boundary (within 620-kb window is used as the expected uncertaintydue to 40-kb binning). d, Heat maps of H3K9me3 at boundary sites in humanand mouse. e, UCSC Genome Browser shot showing heterochromatinspreading in the human ES cells (hESC) and IMR90 cells. The two-dimensionalheat map shows the interaction frequency in human ES cells. f, Heat map ofLADs (from ref. 14) surrounding the boundary regions. Scale is the log2 ratio ofDNA adenosine methylation (Dam)–lamin B1 fusion over Dam alone (Dam–laminB1/Dam).Fig. 2d are present in both pluripotent cells and their differentiatedprogeny, the topological domains and boundaries appear to pre-markthe end points of heterochromatic spreading. Therefore, the domainsdo not seem to be a consequence of the formation of heterochromatin.Taken together, the above observations strongly suggest that the topological domain boundaries correlate with regions of the genome displaying classical insulator and barrier element activity, thus revealing a2 N AT U R E VO L 0 0 0 0 0 M O N T H 2 0 1 2 2012 Macmillan Publishers Limited. All rights reserved
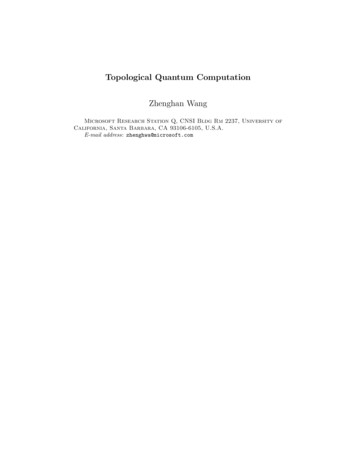
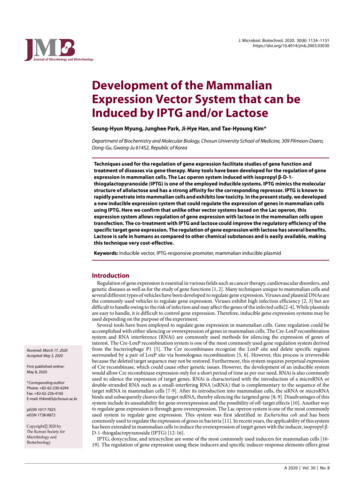
LETTER RESEARCHamESC only Cortex only776169hESC only678Overlap893Cortex-enricheddynamic interacting region400Chr12 400 kbH3K4me3 50.3RNA Pol II 50.5CTCF 50.2H3K4me1 30.2Foxg1cdFoxg1 RNA-seq dinteractions1,272 (96.6%)8,616 (98.2%)43 (3.4%)154 (1.8%)Intra-domainInter-domain 3–3log2 mESC r.p.k.m.cortex r.p.k.m.xrte(Co)mESC in humans1,944 totalOverlap1,476hESC3,030 totalhESC in mouse2,792 totalNormalizedinteractioncountsOverlap1,502Mouse 42Mir3058Ube2nCraddNudt4hmESC2,117 totalHuman to mouseP 2.2 10–16Mouse to humanP 2.2 aSynuclein)3mePhc1Genes atcortex-specificinteractions0fNanog96400400 kbChr1250.350.550.230.2Foxg151000000Genes atmESC-specificinteractions15CESIMR90 spotential link between the topological domains and transcriptionalcontrol in the mammalian genome.We compared the topological domains with previously describeddomain-like organizations of the genome, specifically with the A and Bcompartments described by ref. 2, with lamina-associated domains(LADs)10,14, replication time zones15,16, and large organized chromatinK9 modification (LOCK) domains17. In all cases, we can see that topological domains are related to, but independent from, each of thesepreviously described domain-like structures (Supplementary Figs 12–15). Notably, a subset of the domain boundaries we identify appear tomark the transition between either LAD and non-LAD regions of thegenome (Fig. 2f and Supplementary Fig. 12), the A and B compartments (Supplementary Fig. 13, 14), and early and late replicating chromatin (Supplementary Fig. 14). Lastly, we can also confirm thepreviously reported similarities between the A and B compartmentsand early and late replication time zone (Supplementary Fig. 16)16.We next compared the locations of topological boundaries identified in both replicates of mouse ES cells and cortex, or between bothreplicates of human ES cells and IMR90 cells. In both human andmouse, most of the boundary regions are shared between cell types(Fig. 3a and Supplementary Fig. 17a), suggesting that the overalldomain structure between cell types is largely unchanged. At theboundaries called in only one cell type, we noticed that trend ofupstream and downstream bias in the directionality index is still readilyapparent and highly reproducible between replicates (SupplementaryFig. 17b, c). We cannot determine if the differences in domain callsbetween cell types is due to noise in the data or to biological phenomena,such as a change in the strength of the boundary region between celltypes18. Regardless, these results indicate that the domain boundariesare largely invariant between cell types. Lastly, only a small fraction ofthe boundaries show clear differences between two cell types, suggestingthat a relatively rare subset of boundaries may actually differ betweencell types (Supplementary Fig. 18).The stability of the domains between cell types is surprising givenprevious evidence showing cell-type-specific chromatin interactionsand conformations5,7. To reconcile these results, we identified celltype-specific chromatin interactions between mouse ES cell and mousecortex. We identified 9,888 dynamic interacting regions in the mousegenome based on 20-kb binning using a binomial test with an empiricalfalse discovery rate of ,1% based on random permutation of thereplicate data. These dynamic interacting regions are enriched fordifferentially expressed genes (Fig. 3b–d, Supplementary Fig. 19 andSupplementary Table 5). In fact, 20% of all genes that undergo a fourfold change in gene expression are found at dynamic interacting loci.This is probably an underestimate, because by binning the genome at20 kb, any dynamic regulatory interaction less than 20 kb will bemissed. Lastly, .96% of dynamic interacting regions occur in the samedomain (Fig. 3e). Therefore, we favour a model where the domainorganization is stable between cell types, but the regions within eachdomain may be dynamic, potentially taking part in cell-type-specificregulatory events.The stability of the domains between cell types prompted us toinvestigate if the domain structure is also conserved across evolution.To address this, we compared the domain boundaries between mouseES cells and human ES cells using the UCSC liftover tool. Most of theboundaries appear to be shared across evolution (53.8% of humanboundaries are boundaries in mouse and 75.9% of mouse boundariesare boundaries in humans, compared to 21.0% and 29.0% at random,P value ,2.2 3 10216, Fisher’s exact test; Fig. 3f). The syntenic regionsin mouse and human in particular share a high degree of similarity intheir higher order chromatin structure (Fig. 3g, h), indicating thatthere is conservation of genomic structure beyond the primarysequence of DNA.We explored what factors may contribute to the formation of topological boundary regions in the genome. Although most topologicalboundaries are enriched for the binding of CTCF, only 15% of CTCF60Btg14930556N09RikHuman LOC256021LOC643339 BTG1CLLU1PLEKHG7CLLU1OSEEA1UBE2NFigure 3 Boundaries are shared across cell types and conserved inevolution. a, Overlap of boundaries between cell types. b, Genome browsershot of a cortex enriched dynamic interacting region that overlaps with theFoxg1 gene. c, Foxg1 expression in reads per kilobase per million readssequenced (r.p.k.m.) in mouse ES cells and cortex as measured by RNA-seq.d, Heat map of the gene expression ratio between mouse ES cell and cortex ofgenes at dynamic interactions. e, Pie chart of inter- and intra-domain dynamicinteractions. f, Overlap of boundaries between syntenic mouse and humansequences (P , 2.2 3 10216 compared to random, Fisher’s exact test).g, h, Genome browser shots showing domain structure over a syntenic region inthe mouse (g) and human (h) ES cells. Note: the region in humans has beeninverted from its normal UCSC coordinates for proper display purposes.binding sites are located within boundary regions (Fig. 2c). Thus,CTCF binding alone is insufficient to demarcate domain boundaries.We reasoned that additional factors might be associated with topological boundary regions. By examining the enrichment of a variety of0 0 M O N T H 2 0 1 2 VO L 0 0 0 N AT U R E 3 2012 Macmillan Publishers Limited. All rights reserved
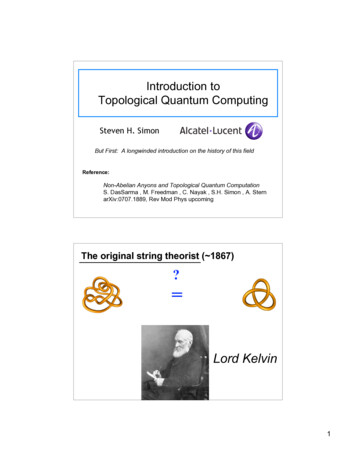
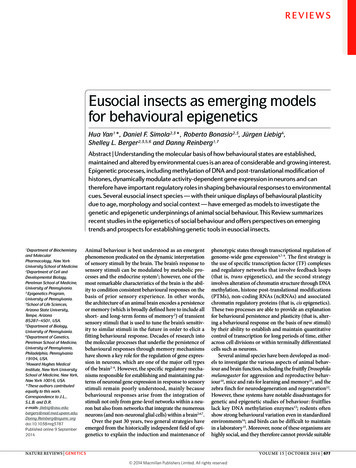
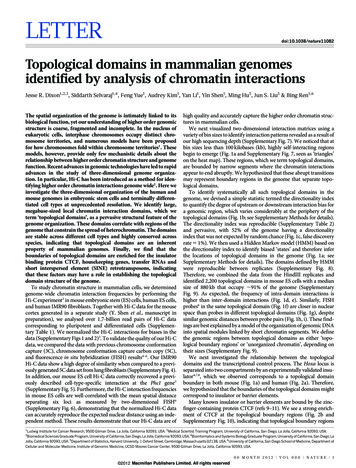
RESEARCH LETTER2–41–6H3K4me1log2(mark/input) ( 10–1)log2(mark/input) ( 10–1)H3K36me3–264H3K9me30–2220–500 kb Boundary 500 kbGRO-seq210.80–500 kb Boundary 500 kb0–500 kb Boundary 500 kbcObservedExpected (random)P 2.2 10–161,5001,000P 2.2 10–16500P 0.05dtRge NAnesHousege keene pinsgCTCF0TSS/(10 kb total TSS) ( 10–6)IMR90 H3K4me31.6BiologicalprocessBenjamini corrected P-value2,0003Repeats per 10-kbTSS4Peaks per 10 kb ( 10–1)0–8–40–500 kb Boundary 500 kb –500 kb Boundary 500 kb –500 kb Boundary 500 kb –500 kb Boundary 500 kbHousekeepingTissue specificMETHODS SUMMARY6Cell culture and Hi-C experiments. J1 mouse ES cells were grown on gammairradiated mouse embryonic fibroblasts cells under standard conditions (85% highglucose DMEM, 15% HyClone FBS, 0.1 mM non-essential amino acids, 0.1 mMb-mercaptoethanol, 1 mM glutamine, LIF 500 U ml21, 13 Gibco penicillin/streptomycin). Before collecting for Hi-C, J1 mouse ES cells were passaged ontofeeder free 0.2% gelatin-coated plates for at least two passages to rid the culture offeeder cells. H1 human ES cells and IMR90 fibroblasts were grown as previouslydescribed13. Collecting the cells for Hi-C was performed as previously described,with the only modification being that the adherent cell cultures were dissociatedwith trypsin before fixation.Sequencing and mapping of data. Hi-C analysis and paired-end libraries wereprepared as previously described2 and sequenced on the Illumina Hi-Seq2000platform. Reads were mapped to reference human (hg18) or mouse genomes(mm9), and non-mapping reads and PCR duplicates were removed. Twodimensional heat maps were generated as previously described2.Data analysis. For detailed descriptions of the data analysis, including descriptions of the directionality index, hidden Markov models, dynamic interactionsidentification, and boundary overlap between cells and across species, seeSupplementary Methods.4–500 kb Boundary 500 �210–21000eBoundaries and associated marks8Housekeeping6.0%4 500 kbFinally, we analysed the enrichment of repeat classes around boundaryelements. We observed that Alu/B1 and B2 SINE retrotransposons inmouse and Alu SINE elements in humans are enriched at boundaryregions (Fig. 4a and Supplementary Figs 24 and 25). In light of recentreports indicating that a SINE B2 element functions as a boundary inmice24, and SINE element retrotransposition may alter CTCF bindingsites during evolution25, we believe that this contributes to a growingbody of evidence indicating a role for SINE elements in the organization of the genome.In summary, we show that the mammalian chromosomes are segmented into megabase-sized topological domains, consistent withsome previous models of the higher order chromatin structure1,26,27.Such spatial organization seems to be a general property of the genome:it is pervasive throughout the genome, stable across different cell typesand highly conserved between mice and humans.We have identified multiple factors that are associated with theboundary regions separating topological domains, including the insulator binding factor CTCF, housekeeping genes and SINE elements.The association of housekeeping genes with boundary regions extendsprevious studies in yeast and insects and suggests that non-CTCFfactors may also be involved in insulator/barrier functions in mammalian cells28.The topological domains we identified are well conserved betweenmice and humans. This indicates that the sequence elements andmechanisms that are responsible for establishing higher order structures in the genome may be relatively ancient in evolution. A similarpartitioning of the genome into physical domains has also beenobserved in Drosophila embryos29 and in high-resolution studies ofthe X-inactivation centre in mice (termed topologically associateddomains or TADs)30, indicating that topological domains may be afundamental organizing principle of metazoan genomes.8–610–610Other gene3.3%BoundarymESCSINE element10–810–810120–500 kb12RN TraA nsNo Ripr latoc ion- bonm ue ncem lCe ssell c ingM bra oprycem n otelebr b einan ou ce- nd omen o pcl rg lexos aned elStl leruM Rib umctito os enuralch omcoon ensdriotit Rnue Nnt A bof inrib dinos gomeBoundaries with mark 20 kbbH3K4me3Median r.p.k.m. ( 10–1)TSS/(10 kb total TSS) ( 10–6) Peaks per 10 kb ( 10–1)aPeaks per 10 kb ( 10–1)histone modifications, chromatin binding proteins and transcriptionfactors around topological boundary regions in mouse ES cells, weobserved that factors associated with active promoters and gene bodiesare enriched at boundaries in both mouse and humans (Fig. 4a andSupplementary Figs 20–23)19,20. In contrast, non-promoter-associatedmarks, such as H3K4me1 (associated with enhancers) and H3K9me3,were not enriched or were specifically depleted at boundary regions(Fig. 4a). Furthermore, transcription start sites (TSS) and global run onsequencing (GRO-seq)21 signal were also enriched around topologicalboundaries (Fig. 4a). We found that housekeeping genes were particularly strongly enriched near topological boundary regions (Fig. 4b–d;see Supplementary Table 7 for complete GO terms enrichment).Additionally, the tRNA genes, which have the potential to functionas boundary elements22,23, are also enriched at boundaries (P value,0.05, Fisher’s exact test; Fig. 4b). These results suggest that high levelsof transcription activity may also contribute to boundary formation. Insupport of this, we can see examples of dynamic changes in H3K4me3at or near some cell-type-specific boundaries that are cell-type specific(Supplementary Fig. 24). Indeed, boundaries associated with bothCTCF and a housekeeping gene account for nearly one-third of all topological boundaries in the genome (Fig. 4e and Supplementary Fig. 24).20.2%CTCF other gene27.9%CTCF housekeepinggene27.6%CTCF onlyNothing14.9%Figure 4 Boundary regions are enriched for housekeeping genes.a, Chromatin modifications, TSS, GRO-seq and SINE elements surroundingboundary regions in mouse ES cells or IMR90 cells. b, Boundaries associatedwith a CTCF binding site, housekeeping gene, or tRNA gene (purple) comparedto expected at random (grey). c, Gene Ontology P-value chart. d, Enrichment ofhousekeeping genes (gold) and tissue-specific genes (blue) as defined byShannon entropy scores near boundaries normalized for the number of genesin each class (TSS/10 kb/total TSS). e, Percentage of boundaries with a givenmark within 20 kb of the boundaries.Received 26 September 2011; accepted 27 March 2012.Published online 11 April 2012.1.2.3.4.5.6.7.Cremer, T. & Cremer, M. Chromosome territories. Cold Spring Harb. Perspect. Biol.2, a003889 (2010).Lieberman-Aiden, E. et al. Comprehensive mapping of long-range interactionsreveals folding principles of the human genome. Science 326, 289–293 (2009).Yaffe, E. & Tanay, A. Probabilistic modeling of Hi-C contact maps eliminatessystematic biases to characterize global chromosomal architecture. Nature Genet.43, 1059–1065 (2011).Wang, K. C. et al. A long noncoding RNA maintains active chromatin to coordinatehomeotic gene expression. Nature 472, 120–124 (2011).Kagey, M. H. et al. Mediator and cohesin connect gene expression and chromatinarchitecture. Nature 467, 430–435 (2010).Eskeland, R. et al. Ring1B compacts chromatin structure and represses geneexpression independent of histone ubiquitination. Mol. Cell 38, 452–464 (2010).Noordermeer, D. et al. The dynamic architecture of Hox gene clusters. Science 334,222–225 (2011).4 N AT U R E VO L 0 0 0 0 0 M O N T H 2 0 1 2 2012 Macmillan Publishers Limited. All rights reserved
LETTER .23.Kim, Y. J., Cecchini, K. R. & Kim, T. H. Conserved, developmentally regulatedmechanism couples chromosomal looping and heterochromatin barrieractivity at the homeobox gene A locus. Proc. Natl Acad. Sci. USA 108, 7391–7396(2011).Phillips, J. E. & Corces, V. G. CTCF: master weaver of the genome. Cell 137,1194–1211 (2009).Guelen, L. et al. Domain organization of human chromosomes revealed bymapping of nuclear lamina interactions. Nature 453, 948–951 (2008).Handoko, L. et al. CTCF-mediated functional chromatin interactome in pluripotentcells. Nature Genet. 43, 630–638 (2011).Xie, W. et al. Base-resolution analyses of sequence and parent-of-origin dependentDNA methylation in the mouse genome. Cell 148, 816–831 (2012).Hawkins, R. D. et al. Distinct epigenomic landscapes of pluripotent and lineagecommitted human cells. Cell Stem Cell 6, 479–491 (2010).Peric-Hupkes, D. et al. Molecular maps of the reorganization of genome-nuclearlamina interactions during differentiation. Mol. Cell 38, 603–613 (2010).Hiratani, I. et al. Genome-wide dynamics of replication timing revealed by in vitromodels of mouse embryogenesis. Genome Res. 20, 155–169 (2010).Ryba, T. et al. Evolutionarily conserved replication timing profiles predict longrange chromatin interactions and distinguish closely related cell types. GenomeRes. 20, 761–770 (2010).Wen, B., Wu, H., Shinkai, Y., Irizarry, R. A. & Feinberg, A. P. Large histone H3 lysine 9dimethylated chromatin blocks distinguish differentiated from embryonic stemcells. Nature Genet. 41, 246–250 (2009).Scott, K. C., Taubman, A. D. & Geyer, P. K. Enhancer blocking by the Drosophilagypsy insulator depends upon insulator anatomy and enhancer strength. Genetics153, 787–798 (1999).Bilodeau, S., Kagey, M. H., Frampton, G. M., Rahl, P. B. & Young, R. A. SetDB1contributes to repression of genes encoding developmental regulators andmaintenance of ES cell state. Genes Dev. 23, 2484–2489 (2009).Marson, A. et al. Connecting microRNA genes to the core transcriptional regulatorycircuitry of embryonic stem cells. Cell 134, 521–533 (2008).Min, I. M. et al. Regulating RNA polymerase pausing and transcription elongation inembryonic stem cells. Genes Dev. 25, 742–754 (2011).Donze, D. & Kamakaka, R. T. RNA polymerase III and RNA polymerase II promotercomplexes are heterochromatin barriers in Saccharomyces cerevisiae. EMBO J. 20,520–531 (2001).Ebersole, T. et al. tRNA genes protect a reporter gene from epigenetic silencing inmouse cells. Cell Cycle 10, 2779–2791 (2011).24. Lunyak, V. V. et al. Developmentally regulated activation of a SINE B2 repeat as adomain boundary in organogenesis. Science 317, 248–251 (2007).25. Schmidt, D. et al. Waves of retrotransposon expansion remodel genomeorganization and CTCF binding in multiple mammalian lineages. Cell. 148,335–348 (2012).26. Jhunjhunwala, S. et al. The 3D structure of the immunoglobulin heavy-chain locus:implications for long-range genomic interactions. Cell 133, 265–279 (2008).27. Capelson, M. & Corces, V. G. Boundar
Therefore, we combined the data from the HindIII replicates and identified 2,200 topological domains in mouse ES cells with a median size of 880kb that occupy ,91% of the genome (Supplementary Fig. 9). As expected, the frequency of intra-domain interactions is higher than inter-domain interactions (Fig. 1d, e). Similarly, FISH