Transcription
USF Centrifugal FanPerformance Supplement Engineering Information Air Performance Sound Performance April2016
Table of ContentsEngineering DataMotor Starting Torque . 3V-Belt Drives . 3Wheel Moments of Inertia . 3Fan RPM Limitations . 3Effects of Air Density . 4Effect of Installation on Performance . 5Sound Performance Testing .6-7Sample Fan Selection .8-9Air and Sound Performance DataTabulated Air & Sound Performance .11-59Greenheck Fan Corporation certifies thatthe model USF-BI and USF-AF shownherein are licensed to bear the AMCA seal.The ratings shown are based on tests andprocedures performed in accordance withAMCA Publication 211 and comply with therequirements of the AMCA Certified RatingsProgram.Greenheck Fan Corporation certifies that themodel USF-BI and USF-AF shown herein arelicensed to bear the AMCA Seal. The ratingsshown are based on tests and proceduresperformed in accordance with AMCAPublication 211 and AMCA Publication 311 andcomply with the requirements of the AMCACertified Ratings Program.MODELAMCASIZESUSF-BI 200AMCA Air6 - 10USF-BI 200AMCA Sound and Air12 - 22USF-BI 300AMCA Air6 - 10USF-BI 300AMCA Sound and Air12 - 24USF-BI 300AMCA Air27 - 49USF-AF 400AMCA Sound and Air18 - 49USF-BI 400AMCA Sound and AirAll sizes (7 - 49)Computer Aided Product Selection Program — CAPSAll Greenheck products are supported by the industry’s best product literature, electronicmedia, and Computer Aided Product Selection program, CAPS. Online, you can alsofind electronic copies of our product literature as well as storage, installation andmaintenance information in our Installation and Operation Manuals.And, of course, you can always count on the personal service and expertise of ournational and international representative organization. To locate your nearest Greenheckrepresentative call 715-359-6171 or visit our website at www.greenheck.comTo-Scale Drawings and Fan SpecificationsTo-scale CAD drawings along with detailed centrifugal specifications can be found online at greenheck.com or within ourComputer Aided Product Selection program (CAPS).2
Engineering DataMotor Starting TorqueUSF-400 Moments of Inertia (lb-ft2)When selecting a motor for a centrifugal fan, the motor must becapable of driving the fan at operating speed and also capable ofaccelerating the fan wheel, shaft and drive to the operating speed.Moments of inertia are shown for steel wheels. Aluminum wheelsare one-third of the value shown.The fan performance tables and curves in this catalog show thebrake horsepower required to operate the fan once it is brought tooperating speed. For applications requiring a large air volume at alow static pressure, the BHP required at the fan’s operating RPMmay not be sufficient to initially start the fan. If the time required tobring the fan to speed is excessive, the motor winding insulationcan be damaged due to excessive temperature rise and the life ofthe motor seriously affected.Fan Size7-10121315161820222427303336404449For a belt drive fan, the required motor starting torque capabilitycan be expressed by the following formula:22WRM2WRM2WRF WRFx(FRPMMRPM)2x (1.1) The moment of inertia that the motor must2 becapable of turning at the motor shaft, lb-ft The moment of inertia of the fan wheel, lb-ft2Steel Backward InclinedCentrifugal WheelsClass 4663Class 541821Steel AirfoilCentrifugal WheelsClass 2741Class 530816FRPM Fan RPMMRPM Motor RPMFan RPM LimitationsThe maximum allowable wheel RPM shown on the fan performancepages are for fans of standard steel operating at 70 F. Since thestrength of the fan wheel, shaft and bearings decreases with anincrease in temperature, maximum allowable speeds must bereduced by the correction factors shown below.V-Belt DrivesConstant Speed DrivesAdvantages of constant speed drives include low vibration levels,ease of assembly and low cost. Fan speed changes can beaccomplished in most cases simply by changing the motor pulley.Maximum RPM Correction Factors For High TemperaturesConstant speed drives are recommended over variable speeddrives for applications that require motors 15 HP and larger, and allapplications requiring 3600 RPM motors.Variable Speed DrivesVariable speed drives allow the fan speed to be changed byadjusting the pitch diameter of the motor pulley. The power to thefan must be off and locked out, and the belts must be removedbefore manually adjusting the variable pitch pulley.Temperature ( F)Steel701.00200.97250.96300.95400.933
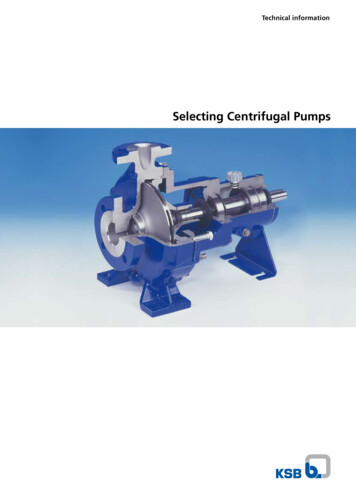
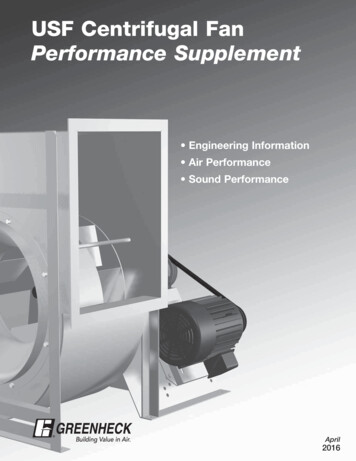
Engineering DataEffect of Air Density – Temperature and ElevationRatings in the fan performance tables and curves of this catalog are based on standard air (clean, dry air with a density of 0.075 pounds percubic foot, barometric pressure at sea level of 406.75 inches wg, temperature of 70 F). Selecting a fan to operate at conditions other thanstandard air requires an adjustment to both static pressure and brake horsepower.One cubic foot of air has a constant volume regardless of temperature or elevation. However, air density changes with non-standardtemperature or elevation. Therefore, when selecting a fan to operate at a non-standard air density using standard air density tables andcurves, corrections must be made to parameters affected by air density. These parameters are static pressure and brake horsepower.For example, a size30 USF 400-BI centrifugalfan is to deliver 13,000 cfmat 4.85 inches wg staticpressure. Elevation is 2000feet, temperature is 150 F.Dry Air Density Correction Factor (I-P)Multiply Standard Air Density, 0.075 lbm / ft3 by the Factor to obtain Density at Condition pbAltitude, (Z)Barometric 008000900010000in. 2221.3920.58The 4.85 inches wg static( pb ) in. wg 421.71 406.75 392.21 378.20 364.61 351.29 338.37 326.00 313.90 302.07 290.79 279.78pressure refers to the static-40 1.309 1.262 1.217 1.174 1.131 1.090 1.050 1.012 0.974 0.937 0.902 0.868pressure at the operating air0 1.195 1.152 1.111 1.071 1.033 0.995 0.959 0.924 0.889 0.856 0.824 0.793density, in this case at 2000feet, 150 F. Intuitively, we40 1.099 1.060 1.022 0.986 0.950 0.915 0.882 0.850 0.818 0.787 0.758 0.729realize that at higher than70 1.037 1.000 0.964 0.930 0.896 0.864 0.832 0.801 0.772 0.743 0.715 0.688standard elevations and100 0.981 0.946 0.913 0.880 0.848 0.817 0.787 0.759 0.730 0.703 0.677 0.651temperatures, air densitywill be lower than standard.150 0.901 0.869 0.838 0.808 0.779 0.750 0.723 0.696 0.670 0.645 0.621 0.598Temperature F, (t)Therefore, we must determine200 0.832 0.803 0.774 0.747 0.720 0.693 0.668 0.644 0.620 0.596 0.574 0.552what static pressure at250 0.774 0.746 0.720 0.694 0.669 0.645 0.621 0.598 0.576 0.554 0.534 0.513standard air density willequate to 4.85 inches wg300 0.723 0.697 0.672 0.648 0.625 0.602 0.580 0.559 0.538 0.518 0.498 0.480static pressure at our350 0.678 0.654 0.631 0.608 0.586 0.565 0.544 0.524 0.505 0.486 0.468 0.450operating density. Since400 0.639 0.616 0.594 0.573 0.552 0.532 0.513 0.494 0.475 0.458 0.440 0.424standard air density is greaterAdapted from AMCA Standard 99-09, section 0200, Charts and Tables, with written permission from Air Movement andthan operating air density inControl Association International, Inc.this case, we would expectthe corrected static pressureto be greater than the operating static pressure.The accompanying table gives air density correction factors for non-standard temperatures and elevations.The example below shows the relationship of fan performance at sea level and at 2000 ft. elevation and 150 F.Example:The following example shows how to properly select the fan described above:1. Since the air volume delivered by the fan is not affected by density, airflow remains 16,500 cfm.2. Determine correction factor from chart for an elevation of 2000 feet and air temperature of 150 F. The correction factor is 0.808.3. Divide the specified operating static pressure by the correction factor to determine the standard air density equivalent static pressure.Corrected static pressure 4.85 inches wg 0.808 6.0 inches wg static pressure.4. Refer to the fan performance table for a 30 USF 400. At 13,000 cfm and 6.0 inches wg static pressure:Fan RPM 1400, BHP 17.025. 1400 Fan RPM is required to produce the desired performance.17.02 Bhp18718Air, 1400 RPMStandard6.0 in. wg1613.75 Bhp614121086ir, 1Corrected A1243S404.85 in. wg52215400 olume (cfm x 1000)05101520253Volume (m /hr x 1000)4 303540Brake HorsepowerBHP at 0 F 17.02 x 1.071 18.24, therefore, a 20 hp motoris required.30 USF-400-BI8Static Pressure (in. wg)If a fan is selected to operate at high temperatures, themotor must be of sufficient horsepower to handle theincreased load at any lower operating temperature where theair is more dense. Assume the air entering the 30 USF 400fan at start-up is 0 F. For 0 F and 2000 feet elevation, the airdensity correction factor is 1.071Standard Air 70 F, Sea LevelCorrect Air 150 F, Altitude of 2000 ft.Static Pressure (Pa x 100)6. Since the horsepower selected refers to standard airdensity, this must be corrected to reflect actual BHP atthe lighter operating air.Operating BHP Standard BHP x 0.808, or 17.02 x 0.808 13.75 BHP.
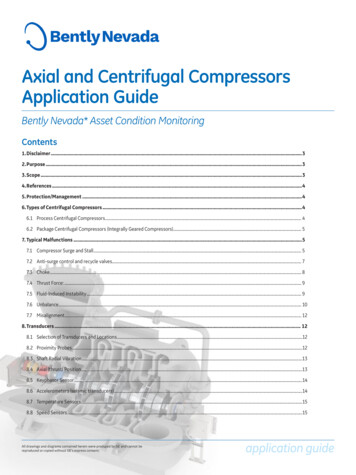
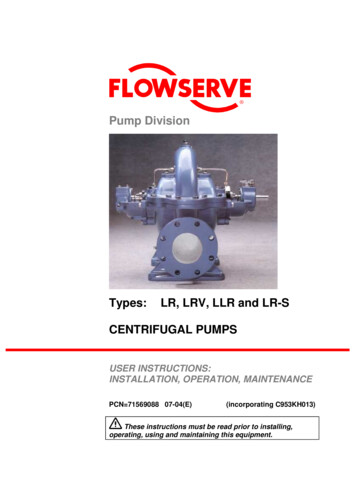
Engineering DataEffect of Installation on PerformanceInlet SpinRotTurningVanesaRotatiotioRatings presented in the performance tables and curves of thiscatalog were derived from tests made in accordance with AMCAStandard 210 — “Laboratory Methods of Testing Fans for Ratings.”The AMCA test procedure utilizes an open inlet and a straightoutlet duct to assure maximum static regain.nnAny installation with inlet or discharge configurations that deviatefrom this standard may result in reduced fan performance.Restricted or unstable flow at the fan inlet can cause pre-rotationof incoming air or uneven loading of the fan wheel yielding largesystem losses and increased sound levels. Free discharge orturbulent flow in the discharge ductwork will also result in systemeffect losses.GOODPOORInlet spin is a frequent cause of reduced fan performance. Thechange in fan performance is a function of the intensity of spinand not easily defined. The best solution is proper duct design andairflow patterns.Static pressure losses due to inlet and discharge conditions canbe expressed in terms of system effect factors. The static pressurefor selection of the fans equals the system static pressure plus thesystem effect factor.Discharge Duct TurnsSome common inlet and discharge conditions which affect fanperformance are:RotNon-Ducted Inlet on of a fan with an open inlet too close to a wall orbulkhead will cause reduced fan performance. It is desirable tohave one fan wheel diameter between the fan inlet and the wall.System effect Curve #3 depicts the pressure loss for one-halfwheel diameter clearance.ationLength of Straight DuctGOODFree DischargeDuct turns located near the fan discharge should always be in thedirection of the fan rotation.Fan performance is reduced when duct turns are made immediatelyoff the fan discharge. To achieve cataloged fan performance thereshould be at least three equivalent duct diameters of straightductwork between the fan discharge and any duct turns. Curve #4shows the system effect factor for two diameters of straightductwork and Curve #2 for one diameter.Free or abrupt discharge into a plenum results in a reduction in fanperformance. The effect of static regain in discharge is not realized.System effect Curve #2 depicts the pressure loss for free or abruptdischarge.System Effect Factor CurvesAdditional information on system effect factors can be foundin AMCA Publication 201 — “Fans and Systems” and ASHRAEHandbooks.Inlet Duct Turns1.21.0Static Pressure LossOne eCu0.42rveCu3ve 4Cur0.2Installation of a duct turn or elbow too close to the fan inletreduces fan performance because the air is loaded unevenly intothe fan wheel. To achieve full fan performance there should be atleast one fan wheel diameter between the turn or elbow and the faninlet. Curve #1 shows the system effect factor when less than onediameter is provided. Note: Use of an inlet box in lieu of a turn orelbow significantly reduces system effect.0.005101520253035Outlet Velocity (FPM x 100)5 4045
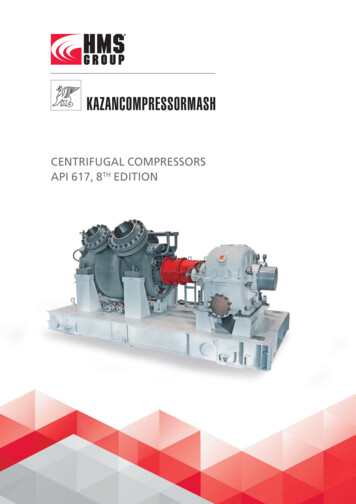
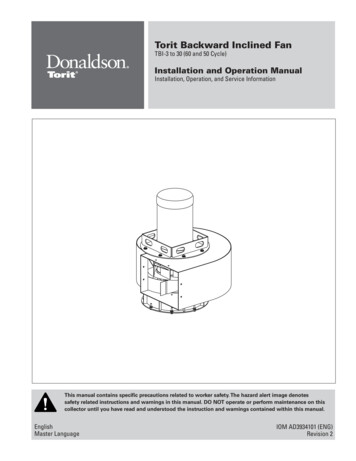
Sound Performance TestingAMCA Licensed RatingsSound tests were conducted in Greenheck Fan Corporation’s AMCA Accredited sound laboratory in accordance with AMCA Standard300. Inlet and outlet sound ratings comply with AMCA Publication 311, qualifying these models to bear the AMCA Seal for Sound andAir Performance. The sound power levels published here can be compared directly with those of other similarly rated fans, or used as abaseline to determine sound levels in occupied spaces.The sound data in this brochure is the result of extensive testing, which included both inlet and outlet sound tests on single-widthcentrifugal fans. Typically, fan manufacturers publish only inlet sound for single-width fans. The assumption they make is that outlet soundis identical to inlet sound. Sound data based on this assumption is simply not accurate enough for today’s sound sensitive installations.This assumption also ignores duct end corrections for outlet sound.Test MethodsAMCA Standard 300 clearly defines methods used to test fans in a reverberant sound test room. The reverberant room is specificallydesigned to allow sound waves to be dispersed evenly throughout the room. The walls have a hard surface that reflects sound and arepositioned to prevent resonances which could result in quiet areas within the room.Sound power cannot be directly measured. The test method is based on a Reference Sound Source (RSS) substitution for determining fansound power. The RSS is a laboratory calibrated device which has a known sound power output level. The test fan is installed as shownbelow. The RSS is energized and the sound pressure levels in the reverberant room are recorded. The fan is then operated without the RSSand the fan sound pressure levels are recorded for various points of operation. Since the sound power levels of the RSS are known, thesubstitution method is used to determine the sound power levels of the fan. This method is illustrated in the following example.Calculating Fan Sound Power12345678Center Frequency (Hz)Octave Band631252505001000200040008000Calibrated RSS Sound Power (Lwr)8281818181817978Measured RSS Sound Pressure (Lpq)7074757675746961Difference (Lwr-Lpq )12765671017Measured Fan Sound Pressure (Lpm)6872696968625746Substitution (Lwr-Lpq, from above) 12 7 6 5 6 7 10 17Fan Sound Power (Lw)8079757474696763Note: Sound level shown in dBTest SetupsThe illustrations show where the sound levels were measured with respect to the fan. Inlet sound was tested as in Figure 2 of AMCAStandard 300 and outlet sound was tested as in Figure 3. Inlet and outlet sound were determined in the same inlet and outlet configurationsas the air tests. (Installation Type B - Free Inlet, Ducted Outlet).SINGLE WIDTHSINGLE ophonePathFigure 2:AMCA Standard 300 - Fan Inlet Sound TestingInstallation Type B: Free Inlet, Ducted OutletFigure 3:AMCA Standard 300 - Fan Outlet Sound TestingInstallation Type B: Free Inlet, Ducted Outlet(Ratings include the effects of duct end correction)6 ReverberantRoom
Sound Performance TestingTolerance and ApplicationThe certification process in AMCA Standard 311 calls for a precertification test to verify original test results. Check tests are also requiredevery three (3) years for each model licensed. Test data must agree with the published sound power within the following tolerance levels:12345678Center Frequency (Hz)Octave Band631252505001000200040008000Tolerance 6 3 3 3 3 3 3 3These tolerance levels are a good indication of the variance that could occur from one fan or test setup to another. Once installed however,there are many other factors that can affect the sound power generated by a fan.The lower frequencies (below 125 Hz) are greatly affected by vibration. Fan wheel balance, motor balance, drive alignment, etc., all affectthe vibration level of the fan and can increase sound power in the 1st and 2nd octaves. When ducts are not properly isolated from the fan,these vibrations can be transmitted into the ducts, which can generate additional low frequency sound.Sound power generated by a fan can also be influenced by system effects. System effects are pressure losses caused by inlet or outletrestrictions, or other conditions causing non-uniform airflow at the inlet or discharge of a fan (see AMCA Publication 201). Examples includeinlet or outlet elbows too close to a fan, restricted inlets and fan accessories. While system effects can prevent fans from reaching theirdesigned air performance, they can also result in increased sound power levels. Typically, system effects cause pressure fluctuationswhich influence the lower frequencies. Poor inlet conditions can also greatly increase sound levels at the blade pass frequency (BPF). Theblade pass frequency refers to how often a blade or wheel fin passes a stationary location of the housing and can be calculated using thefollowing equation:Per AMCA: Blade Pass FrequencyBPF (Hz) ()Fan RPM x Number of Blades 260NOTE: All USF 400-BI and USF 400-AF wheels have nine blades.Sound is becoming increasingly critical for most fan installations. Greenheck employs extensive research and testing to provide sound datathat is as thorough and accurate as possible. However, sound pressure levels in occupied spaces are affected by the acoustical qualitiesof the space, distance from source to receiver, etc. Therefore, published sound power data can be used only as a baseline for determiningthe resulting sound pressure levels an occupant hears. While Greenheck provides products which meet published sound power levels,no manufacturer can be responsible for poor installations or system designs beyond their control. For further information on installationpractices, see AMCA Publication 201, “Fans and Systems”.7
SampleFanSelectionFan SelectionProcedureThe purpose of this page is to demonstrate the manual centrifugal fan selection process. This page also contains helpfultips to check your fan selection, as well as a step-by-step set of instructions on how to use this manual to properly select acentrifugal fan.An important point to remember when manually selecting a centrifugal fan is that more than one fan is available to meetthe desired performance (CFM and Ps). Selection criteria such as unit size, efficiency, speed, outlet velocity, horsepower, orconstruction material may also dictate which fan is chosen.36 USF-400 - BI12A The Outlet Area is usedfor the Outlet Velocity(OV) calculation.(RPM/420)3Maximum KW at a given RPMMaximum RPM137115101016 7 254352000RPM x 9.56 ft/min.RPM x 0.049 m/sDOImperial data - Metric OF
USF-BI 400 AMCA Sound and Air All sizes (7 - 49) Greenheck Fan Corporation certifies that the model USF-BI and USF-AF shown herein are licensed to bear the AMCA seal. The ratings shown are based on tests and procedures performed in accordance with AMCA Publication 211 and comply with the requirement