Transcription
Living longerInfographics
These infographics, or evidence cards,summarise key stats and context around ourageing population using engaging andaccessible illustrations.They are closely aligned with data included in our flagshipreport, The State of Ageing, which provides a snapshot ofhow people in the UK are ageing today, in relation to theirhomes, work, health and communities. You can downloadslides containing the charts and images from The State ofAgeing 2022 here.
These infographics have been designed to be used acrossyour channels and in workshops to run an ‘evidence safari’ –a collaborative and interactive way of exploring research andinsight rapidly.We hope they can help professionals better understand –and explain to others – the evidence base and opportunitiesaround demographic change and – by extension – how toapproach the opportunity of an ageing population in newand collaborative ways. Read our workshop guide to usingthe cards.
All the infographics are downloadable individually as JPEGsso you can select exactly what is relevant to you and usethem on social media and beyond.You might also be interested in our infographics on Employerattitudes and Inequalities experienced by Black, Asian andMinority Ethnic groups.Our infographics also complement 2,000 photos and iconsshowing positive and realistic images of over 50s, available touse for free.
Contents- Ageing society (pg 6)- Work (pg 14)- Homes (pg 29)- Health (pg 43)- Communities (pg 55)- Finance and the economy (pg 64)
Ageingsociety
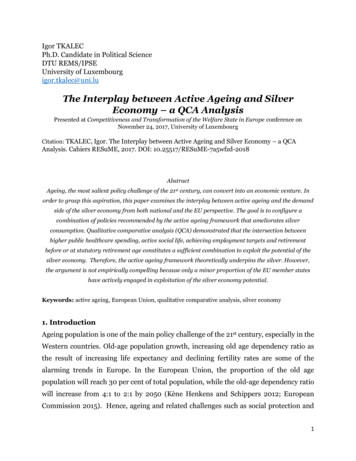
Ageing societyPeople aged 65 and overIn the 2021 Censusthere were 10.4million peopleaged 65 and overin England, a 52%increase since the1981 Census.But the population of people aged 85 and over – currently1.4 million – has almost doubled since the 1981 Census.Source: ONS, Population and household estimates, England and Wales: Census 2021. Availableat: census2021 52%19812021
Ageing societyThe population aged65 and over in theUK is projected toincrease by almosta third in the next20 years. 32%2022Source: ONS (2022), Principal projection - UK population in age groups. Available agegroups2042
Ageing societyThere are huge inequalitiesin life expectancy acrossEngland: a boy born inBlackpool can expect to liveto 74 whereas a boy born inWestminster can expect tolive to almost 85, a differenceof more than 10 years.Source: ONS (2022), Health state life expectancy, all ages, UK. Available arsyearsBlackpoolWestminster
Ageing societyLife expectancy at birth for menOf the 8 local areas inEngland where menhave a life expectancyof 82 years or more, 6are in London.*All 13 local areas in England where women have a lifeexpectancy greater than 85 years are in London and theSouth East.*Others are Wokingham and Rutland76Source: ONS (2022), Health state life expectancy, all ages, UK. Available /datasets/healthstatelifeexpectancyallagesuk84
Ageing societyMore than 2.1 millionmen and 2.2 millionwomen aged 45-74live alone in the UK.The number of men within this age group living alone hasincreased by 68% since 2000.Source: ONS. Families and households 2021. Available at: y/birthsdeathsandmarriages/ households
Ageing societyThe older populationis set to become moreethnically diverse overtime. Currently 5% ofpeople aged 60 and overin England and Wales arefrom BAME backgrounds,increasing to 21% of peopleaged 29 and younger.Source: ONS (2019), Population estimates by ethnic group and religion. Available at: timatesbyethnicgroupenglandandwales5%Over 60 years16%30-59 years21%0-29 years
Ageing society22% of men and33% of womenaged 55-64 inthe UK provideunpaid care.22%Source: GP Patient survey (2021), Available 3%
Work
WorkUntil the pandemic, theemployment rate of peopleaged 50-64 in the UK hadbeen increasing over time –from 60% in 2000 to 73%in March 2020.73%60% s of March 2020 (pre-pandemic) a third of all workers were agedA50 or over.2000Source: ONS (2020), Employment, unemployment and economic activity by age group(seasonally adjusted). Available at: seasonallyadjusteda05sa/current2020
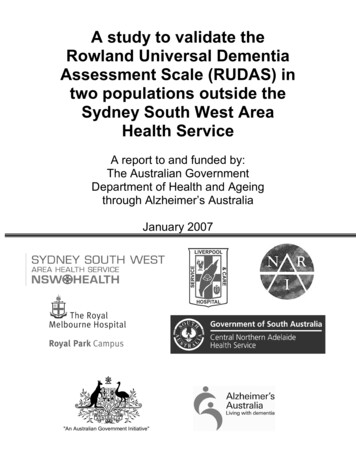
WorkHealth is theleading reason forpeople aged 50-64to be out of work.Number of people who would like to beworking but aren’t, by reasonRetiredNo jobavailableLooking afterfamily and/or homePeople with the fewest assets are much more likely to take earlyretirement because of their own health or the poor health of others. 300,000Source: Centre for Ageing Better analysis of Annual Population Survey, year to March 2020Source: Natcen analysis for Ageing Better of English Longitudinal Study of Ageing: Wave 8,2002-2016Unemployed(actively jobseeking)Sick, injuredor disabled
WorkPeople aged 50and over who areunemployed aretwice as likely as theyoungest adults to belong-term unemployed.**Out of work for more than 12 months.Source: Learning and Work analysis of Department for Work and Pensions data. Available after-covid-report.pdf
WorkThe pandemic hashad a significantimpact on the numberof older workers. The employment rate of people aged 50-64 in the UK is currently 1.5percentage points lower than before the pandemic (70.9% vs 72.4%)* There are more than a quarter of a million more people aged 50-64who are economically inactive** The gap in the employment rate of people aged 50-64 and peopleaged 35-49 has widened by 1.5 percentage points*February-April 2022**Neither in work nor looking for workSource: ONS (2022), Employment, unemployment and economic inactivityby age group (seasonally adjusted). Available at: pseasonallyadjusteda05sa
WorkRetirement was the mostcommon reason givenby people aged 50-70for dropping out ofthe work force duringthe pandemic.221,000 workers retired between Q2 and Q3 2021 in the UK,40,000 more than during the same period two years earlier.Source: ONS (2022), Movements out of work for those aged over 50 years sincethe start of the coronavirus pandemic. Available at: rtofthecoronaviruspandemic/2022-03-14
WorkOf those maderedundant in the UKduring the pandemic,one-third were aged50 or over.Redundant workers aged 50 and over were half as likely as youngerworkers to be re-employed during the pandemic.Source: Institute for Fiscal Studies (2021), Employment and the end of the furlough scheme.Available at: https://ifs.org.uk/publications/15644
WorkEvery day, around600 people giveup work to carefor others.Source: Carers UK (2019). Juggling work and unpaid care. A growing issue. Available at:http://www.carersuk.org/images/ News and campaigns/Juggling work and unpaid carereport final 0119 WEB.pdf
WorkWorkers aged 50 andover are the least likelyto receive ‘off the job’*training, impacting theirability to keep up to datewith new skills and gainfurther employment.*Any training conducted in a classroom or training session, even if on theemployers’ premises, is ‘off the job’ training.‘On the job’ training means learning while actually doing the job.Source: ONS (2022), Job related training received by employees. Available /jobrelatedtrainingreceivedbyemployeesemp15
WorkPoor-quality work is anissue for many peoplein their 50s and 60s,but especially poorerworkers. About half of men and women aged 50-69 in England say thattheir work is excessively demanding. Around a third say that the efforts outweigh the rewards. Around a third say that they lack control over their work. And poor-quality work is most likely to be experienced bythe poorest.Source: Centre for Ageing Better (2021), Boom and Bust? The last baby boomers and theirprospects for later life. Available at: dfSource: Centre for Ageing Better (2022), State of Ageing 2022.Flexible hours?Additional support?Fulfilling work?
WorkMedian weekly earningstypically peak for peoplein their 40s and begin todecline in their 50s and60s – particularly forfull-time workers.40sSource: ONS (2021), Earnings and hours worked, age group. Available at: oupashetable650s60s
WorkThe gender paygap is largest forwomen in their 50s.Source: ONS (2021), Earnings and hours worked, age group. Available at: oupashetable6
WorkThere are three timesmore women thanmen aged 50-64working part-timein the UK.Source: Department for Work and Pensions (2021), Economic labour market status ofindividuals aged 50 and over, trends over time: Available at: ds-overtime-september-2021
WorkAlmost one in five workersaged 50-64 in the UK areself-employed, more thanin any other age group.Source: Department for Work and Pensions (2021). Economic labour market status of individualsaged 50 and over, trends over time: Available at: er-trends-over-timeseptember-2021/
WorkAmong over 50s whoseincomes have reducedas a result of thepandemic, the poorestare most likely to bedrawing on their savingsto make ends meet.Source: The Institute for Fiscal Studies (September 2020) Financial consequences of the coronaviruspandemic for older people. Available at: usr.com/ugd/540eba 1af0fd7e31304eb78424669e4f93e1c3.pdf
Homes
HomesAt least 80% ofUK homes that willexist in 2050 havealready been built.Source: Boardman, B et al (2005) Chapter 5: Building fabric and housing stock, in‘40% House’, Environmental Change Institute, University of Oxford, UK. Available ds/40house/chapter05.pdf
HomesMore than 90%of people aged65 and over live inmainstream housing.‘Mainstream housing’ refers to ordinary housing, as well ashousing considered especially suitable for older people due todwelling type (e.g. bungalows), design features (including ‘lifetimehomes’) or adaptations (e.g. stair lifts).Source: Centre for Ageing Better calculations based on care home data and estimates of thenumber of older people who live in specialist housing.90%
HomesMore than half (53%)of people aged50 and over whomove home don’tdownsize.They either keep the same number of rooms or move into a placewith more rooms.Source: Greater Manchester Combined Authority (2018) Rightsizing: Reframing the housing offerfor older people. Available at: 019-02/rightsizingmanchester-school-architects.pdf
HomesOf the almost 4 millionnon-decent homes inEngland over half are livedin by someone aged 55or over.Homes are classed as non-decent for one of four reasons: The presence of a serious hazard which poses a riskto the health of the occupant(s). Not providing a reasonable degree of thermal comfort - e.g.effective insulation or efficient heating. Being in disrepair. Not having sufficiently modern facilities - e.g. a bathroom morethan 30 years old or a kitchen more than 20 years old.Source: English Housing Survey 2020 to 2021: headline report. Available at: ousing-survey-2020-to-2021-headline-report
HomesOne in five homes inthe private rentedsector are classifiedas non-decent.Source: English Housing Survey 2020 to 2021: headline report. Available h-housing-survey-2020-to-2021-headline-report
HomesNearly half a millionhomes lived in by aperson aged 55 or olderare excessively cold*.Fixing this alone couldsave the NHS over 300m.*Excess cold signifies that, whatever the type of heating or insulation in place,the home is still not warm enough (17 degrees or more) and could pose a threatto health.Source: Building Research Establishment analysis of MHCLG (2019) English Housing Survey.Bespoke analysis for Centre for Ageing Better
HomesA quarter of peopleaged 75 and overwho rent privatelyin England are atrisk from category1 hazards.**Hazards that cause a ‘serious and immediate risk’ to their occupants’health and safety.Source: English Housing Survey 2019 to 2020. Available RS
HomesThe average costof remedial workto fix homes withcategory 1 hazardswould be 3,780per home. The total cost of remedial work would be 9.8 billion. The full cost to society of leaving people living in poor housingis 18.5 billion a year.Source: BRE (2021). The cost of poor housing in England. Available at: https://files.bregroup.com/research/BRE Report the cost of poor housing 2021.pdf 3,780
HomesOnly 9% of homesin England containall four featuresthat would makethem visitable foreveryone.Source: MHCLG (2020) English Housing Survey 2018: accessibility of English homes – factsheet. Available at: act-sheetWC atentrance levelWide doorwaysand circulation spaceFlush thresholdLevel access
HomesHouseholds with more residents than rooms in LondonIn general, peoplefrom Black, Asian andMinority Ethnic groupsare more likely to live inovercrowded housing.Bangladeshi30%Black African16%Pakistani18%White British2%*fewer bedrooms than needed to avoid undesirable sharing.Source: The Institute of Fiscal Studies (May 2020) Are some ethnic groups more vulnerableto COVID-19 than others? Available at: to-COVID-19-than-others-IFSBriefing-Note.pdf
HomesAround a third of peopleaged 50 or older say theirhome needs work to makeit suitable as they get older– particularly people whoare struggling to get by.Cost is cited as the biggest barrier.Source: Centre for Ageing Better NatCen Panel Homes and Communities Study 2020.Further detail at: cen-panel-homes-andcommunities-study-2020
HomesAlthough most olderpeople own their ownhome, the number ofover 55s living in privaterented accommodationhas more than doubledsince 2003 – a trend thatis set to continue.Source: DLUHC (2021), English Housing survey 2020 – 2021: headline report. Available at: ousing-survey-2020-to-2021-headline-report20032021
HomesAmong people aged 50 orolder, the most commonlydesired features of a newhome are safety, a privateoutdoor space and forit to be within walkingdistance of shops, the GPand other amenities.Source: Centre for Ageing Better NatCen Panel Homes and Communities Study 2020.Further detail at: cen-panel-homes-andcommunities-study-2020
Health
HealthProgress on lifeexpectancy hasstalled and weare living a longerportion of our liveswith disability.Source: ONS (2022), Health state life expectancy, all ages, UK. Available at: tasets/healthstatelifeexpectancyallagesukSource: ONS (2016), Disability-Free Life Expectancy (DFLE) and Life Expectancy(LE) at birth by Region, England. Available at: ctancyleatbirthbyregionenglandSource: ONS (2016), Disability-Free Life Expectancy (DFLE) and Life Expectancy (LE): at age65 by region, England. Available at: 018-2073.3%2006-082018-20At birthWith disabilityAged 65Without disability
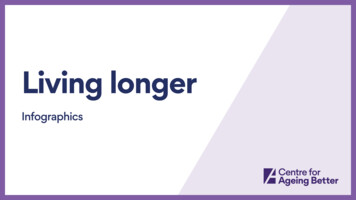
HealthPeople living in thewealthiest areas havealmost twice as manyyears of disability-freelife ahead of them atage 65 as those inthe poorest.Years spent with and without disabilityat age 65 for men in the poorest andwealthiest areas, England, 2018/208.7 years9.1 years12.3 years6.4 yearsPoorestYears with disabilitySource: ONS (2022), Health state life expectancies by national deprivationdeciles, England: 2018 to 2020. Available at: cilesengland2018to2020WealthiestYears free of disability
HealthThere is largegeographicvariation in theproportion of peoplewith three or morelong-term conditions.4%Source: ONS (2022). Number of health conditions by NUTS 2 area, UK, 2004 to 2020.Available at: 27%
HealthMusculoskeletaldisorders cause themost years spentin poor health forpeople aged 50and over.Source: Global Burden of Disease (2019). Available at: https://vizhub.healthdata.org/gbd-compare/
HealthCompared to the wealthiest,the poorest women aged50 and over are: 2x more likely to haveType 2 diabetes. 2x more likely to haverespiratory illness. 4x more likely to havedepression.Source: Centre for Ageing Better analysis of data from: Oldfield, Z., Rogers, N., Phelps, A., Blake, M.,Steptoe, A., Oskala, A., Marmot, M., Clemens, S., Nazroo, J., Banks, J. (2020). English LongitudinalStudy of Ageing: Waves 0-9, 1998-2019. [data collection]. 33rd Edition. UK Data Service. SN: 5050.Available at: http://doi.org/10.5255/UKDA-SN-5050-204x2x2x
HealthCompared to the wealthiest,the poorest men aged50 and over are:5x2x 2x more likely to haveType 2 diabetes. 2x more likely to haverespiratory illness. 5x more likely to havedepression.Source: Centre for Ageing Better analysis of data from: Oldfield, Z., Rogers, N., Phelps, A.,Blake, M., Steptoe, A., Oskala, A., Marmot, M., Clemens, S., Nazroo, J., Banks, J. (2020). EnglishLongitudinal Study of Ageing: Waves 0-9, 1998-2019. [data collection]. 33rd Edition. UK DataService. SN: 5050. Available at: http://doi.org/10.5255/UKDA-SN-5050-202x
HealthPeople aged55-74 in the poorestneighbourhoodsare twice as likelyto be physicallyinactive than peoplein the wealthiest.Source: Centre for Ageing Better analysis of data from: Sport England (2020), Active LivesSurvey, 2018-2019. [data collection]. UK Data Service. SN: 8652. Available at:http://doi.org/10.5255/UKDA-SN-8652-1
Health69%Source: Active Lives Data Tables. Adult Surveys (May 2020-21), Available 21-1529985 %16-24The proportionof people whoare physicallyinactive increaseswith age.
HealthAmong people aged50-69, smoking andpoor diet are thetop behavioural riskfactors for yearslost to disability.Source: Global Burden of Disease (2019). Available at: https://vizhub.healthdata.org/gbd-compare/
Health8 in 10 men and7 in 10 womenaged 65-74 areoverweightor obese.Rates of overweight and obesity are high in every age groupbut for men, peak in 65-74-year-olds and for women, in thoseaged 65 and older.Source: Health Survey for England (2019), Overweight and obesity in adults and childrendata tables. Available at: health-survey-for-england-2019-data-tables81%69%
HealthAmong those aged 50and over, almost half ofthe poorest men andwomen have a weightclassed as obese. Thiscompares to justone-fifth of the richest.50%Poorest20%RichestSource: Banks J, Batty G.D, Nazroo J, Oskala A and Steptoe A. The Dynamics of Ageing:Evidence from the English Longitudinal Study of Ageing 2002-2016 (Wave 8), IFS London.
Communities
CommunitiesThe proportionof people who feelthey belong to theirneighbourhoodincreases with age.65%72%75%65-7475 67%56%But the gap between the youngest and oldest has been narrowing.25-34Source: DCMS (2021), Community Life Survey. Available ity-life-survey-20202135-49 50-64
CommunitiesPeople in their 50sand 60s with longterm illnesses are lesslikely than those withnone to feel a senseof belonging to theirneighbourhood.Source: Centre for Ageing Better (2022), Community connectedness in the COVID-19outbreak. Available at: reak-report.pdf
CommunitiesDuring the pandemicmost people got toknow others locallythey could turn to. Butthis happened laterfor people who werestruggling financially.July 2020: Percentage of people aged 50 to 69 who agreed thatthey knew more people they could count on to help out thanpre-pandemic.November 2020: Percentage who agreed more strongly (than inJuly) that they knew people they could count on to help out.Source: Centre for Ageing Better NatCen Panel Homes and Communities Study 2020.Further detail at: cen-panel-homesandcommunities-study-202042%to get byto get by
CommunitiesDuring the pandemicwell-connectedpeople reportedhigher quality of lifethan less-connectedpeople.“Local helpers” were people in our sample who were unlikely to havereceived help during the pandemic but were likely to have offered helpto family and friends and to have helped out in their local communities.Source: NatCen Panel, November 202020.127.0(aged 50 and over)
CommunitiesIsolated people hadworse emotionalhealth outcomesthan others duringthe pandemic, andthis gap increasedwith age.“Local helpers” were people in our sample who were unlikely to havereceived help during the pandemic but were likely to have offered helpto family and friends and to have helped out in their local communities.Source: NatCen Panel, November 2020
CommunitiesAwareness of localvoluntary groupsthat offer helpand support is lowand varies acrossdifferent groups.Source: Centre for Ageing Better NatCen Panel Homes and Communities Study 2020.Further detail at: cen-panel-homesandcommunities-study-2020
CommunitiesRegular informal orformal volunteeringis most commonbetween the agesof 65 and 74.Source: DCMS (2021), Community Life Survey. Available at: -life-survey-202021
CommunitiesThe proportion of olderpeople who use theinternet regularly hasgrown rapidly, but thereare still over 3.1 millionpeople aged 55 andover who have neverused the internet.Source: ONS (2021), Internet users 2020. Available at: andinternetindustry/datasets/internetusers/current
Finance andthe economy
Finance and the economyOnly around halfof over 50s canexpect to maintaina personallyacceptable level ofincome in retirement.Source: Centre for Ageing Better (2021), Have we saved enough?Available at: 021-06/Have-we-saved-enough.pdf
Finance and the economyA 1% increase in thenumber of peopleaged 50-64 in workwould increaseGDP by around 5.7 billion per year.Source: HM Treasury (2018), ‘Managing fiscal risks: government response to the 2017 Fiscalrisks report’. Available at: t/uploads/ system/uploads/attachment data/file/725913/Managing Fiscal Risks web.pdf1%
Finance and the economyBy 2040, olderconsumers are expectedto spend 550 billion ayear, 63p of every poundspent in our economy.This is 221 billion more than projected spending by younger households.Source: ILC-UK (2019), ‘Maximising the Longevity Dividend’.Available at: https://ilcuk. org.uk/maximising-the-longevity-dividend/ 329bn 550bn
They are closely aligned with data included in our flagship report, The State of Ageing, which provides a snapshot of how people in the UK are ageing today, in relation to their . Around a third say that the efforts outweigh the rewards. Around a third say that they lack control over their work. And poor-quality work is most .