Transcription
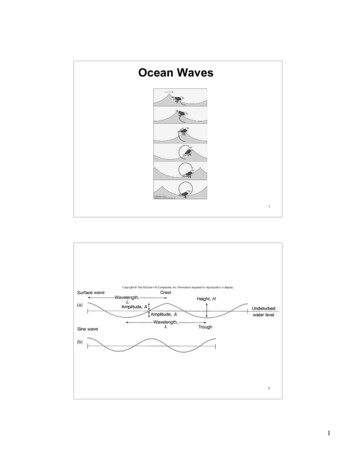
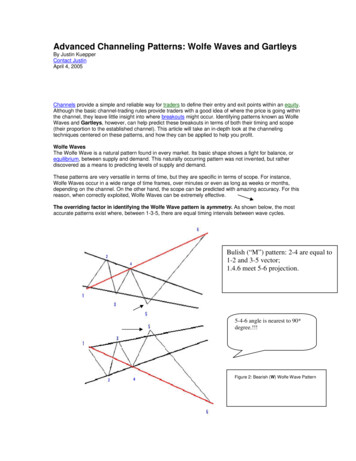
Advanced Channeling Patterns: Wolfe Waves and GartleysBy Justin KuepperContact JustinApril 4, 2005Channels provide a simple and reliable way for traders to define their entry and exit points within an equity.Although the basic channel-trading rules provide traders with a good idea of where the price is going withinthe channel, they leave little insight into where breakouts might occur. Identifying patterns known as WolfeWaves and Gartleys, however, can help predict these breakouts in terms of both their timing and scope(their proportion to the established channel). This article will take an in-depth look at the channelingtechniques centered on these patterns, and how they can be applied to help you profit.Wolfe WavesThe Wolfe Wave is a natural pattern found in every market. Its basic shape shows a fight for balance, orequilibrium, between supply and demand. This naturally occurring pattern was not invented, but ratherdiscovered as a means to predicting levels of supply and demand.These patterns are very versatile in terms of time, but they are specific in terms of scope. For instance,Wolfe Waves occur in a wide range of time frames, over minutes or even as long as weeks or months,depending on the channel. On the other hand, the scope can be predicted with amazing accuracy. For thisreason, when correctly exploited, Wolfe Waves can be extremely effective.The overriding factor in identifying the Wolfe Wave pattern is symmetry. As shown below, the mostaccurate patterns exist where, between 1-3-5, there are equal timing intervals between wave cycles.Bulish (“M”) pattern: 2-4 are equal to1-2 and 3-5 vector;1.4.6 meet 5-6 projection.5-4-6 angle is nearest to 90*degree.!!!Figure 2: Bearish (W) Wolfe Wave Pattern
Figure 2: Bearish (W) Wolfe Wave PatternHere are some key points to remember for identifying Wolfe Waves: Waves 3-4 must stay within the channel created by waves 1-2.Wave 5 (“se sale”) -slightly- del channel created by waves 1-2 !!!Waves “1-2” equal waves “3-4” (showing symmetry).Wave 4 revisits the channel of points established by waves 1-2.There should be regular timing intervals between waves.Waves 3 and 5 are usually 127% or 162% (Fibonacci) extensions of the previous channel point.The pattern can be found in: Rising channels in an uptrend.Falling channels in a downtrend.Level channels during consolidation periods.Notice that the point at wave 5 shown on the diagrams above is a move slightly above or below thechannel created by waves 1-2 and 3-4. This move is usually a false price breakout or channelbreakdown, and is the best place to enter a stock long or short. The "false" action at wave 5 occurs most ofthe time in the pattern, but isn't an absolutely necessary criterion. The point at wave 6 is the target levelfollowing from point 5 and is the most profitable part of the Wolfe Wave channel pattern. The targetprice (point 6) is found by connecting points 1 and 4 (see the red lines in Figures 1 and 2).Figure 3 is an example of the pattern at work. Remember, wave 5 is an opportunity to take action with ashort or long position while the point at wave 6 is the target price.Figure 3: Chart provided by http://www.chart.nuIt is also important to note that Wolfe Waves, along with most pattern trading strategies, are highlysubjective. (For further reading on this kind of subjectivity, see Launching Elliott Wave into the 20thCentury.) The key to profiting is accurately identifying and exploiting these trends in real time, which can bemore difficult than it sounds. As a result, it is wise to paper trade this technique - as it is any new techniqueyou are learning - before going live. And, remember to use stop losses to limit your *************************The Gartley ( XXX-A-B-C-“D” waves) * Wave A shoots “D” !!! cutting B-C base in the middle.!
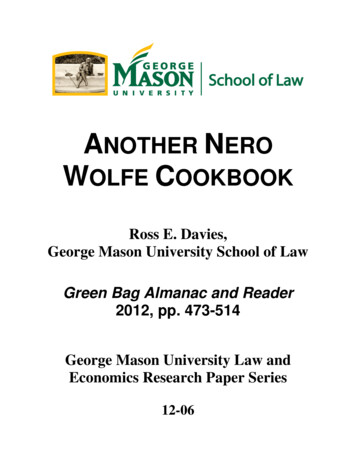
In M-Wave, ABC triangle is equal to BCD triangle.!!!! Look! ; and XD is an uptrend-wave.The Gartley trading pattern was created by H.M. Gartley, who first illustrated it in his book "Profits in theStock Market" (1935). The setup consists of a single large impulse wave followed by two small pullbackimpulse waves. The diagrams below show examples of the ideal setup, both bullish and bearish. In thebullish example XA represents the first large impulse with a price reversal at A. In accordance withFibonacci ratios, retracement AB should be 61.8% of the price segment A minus X. This percentage isshown by the segment XB.In other words: “cómo predecir la onda “D” ( aquí con un recorrido bullísh-M) desde A, atravesando B-C, ;sabiendo que desde “D” se dispararáFigure 4: Bullish PatternFigure 5: Bearish PatternCharts provided by http://www.chartsetups.comAquí muestra una onda bearish- en W; desde A se proyecta el punto “D” ) A-C se muestra paralelo a B-DTriangle A-B-C is equal to B-C-D triangle.-*** A-D vector show the way to “D”, and then bearish drop downwave .At point B, the price again makes a smaller impulse opposite to that of A. Ideally, the retracement BCshould be between 61.8% and 78.6% of the AB price range, regardless of the the length of the lines. Thispercentage is shown by segment AC. At C, the price again makes a reversal impulse opposite to that of B.In this pattern, again as stated by Fibonacci ratios, the retracement CD should be between 127% and161.8% of the range BC, and this proportion is shown along the line BD.
Price D is the optimal point for buying or selling. At entry D the target retracement to a higher price isinitially 61.8% of the range of segment CD. The movement from point D to its next point is extremelyprofitable. Moves from point D are very quick and powerful, and they follow this model accurately 60% ormore of the time.Here are the key points to remember for Gartleys: Ideally, AB equals CD in time length. ( // lines in bearish W-waves)***Point D is a 62-72% pullback from XA.XD should ideally be 78.6% of the segment range XA.Ideally CD equals AB.Take action at point D.!!!The condition in which these patterns can be found depends on whether they are bullish or bearish: Bullish Gartleys occur in uptrends.Bearish Gartleys occur in downtrends.Figure 6 demonstrates the bullish Gartley at work. And Figure 7 shows the bearish Gartley:Figure 6: Chart provided by http://www.chart.nu
Figure 7: Chart provided by http://www.chart.nuConclusionBoth of these channeling techniques provide traders with a reliable way to locate breakout points anddetermine their scope. When using these patterns in conjunction with basic channeling rules, traders haveaccess to a reliable and extremely versatile trading system to use in any market conditions.ResourcesWolfe Wave (http://www.wolfewave.com) - The original discoverer of the Wolfe Wave channel pattern.Voodoo Trader (http://www.chart.nu) - Channels and chart signal identification for many stocks.ChartSetups LLC (http://www.chartsetups.com) - A stock signals provider utilizing advanced channelingpatterns.By Justin KuepperContact JustinLaunching Elliott Wave into the 21st CenturyBy Matt Blackman with Mike GreenIntroductionThere is a standard joke shared by technical analysts that if you were to put twelve Elliott Wavepractitioners in a room, they would fail to reach an agreement on wave count and the direction inwhich a stock is headed. There is no doubt that the Elliott Wave theory has posed some interpretivechallenges, but is such skepticism fair?Robert Prechter, the undisputed leading expert of Elliott Wave, has made some excellent forecastsusing the theory, particularly in the '70s and '80s--specifically, he forecasted the horrific crash of1987. But Prechter's record at the end of the 20th century has not been stellar. In fact, his book Atthe Crest of the Tidal Wave, which publicly called for the end of the great bull market in 1995, wasnearly five years and many Dow points premature; he was advising clients to exit the market eventhough the ascent was nowhere near its end.If the leading Elliott Wave expert finds ElliottWave theory and application so challenging at
times, what hope is there for the rest of us? The high degree of subjectivity involved in using thetheory is one reason why it can be so problematic and why it is rare to find agreement amongpractitioners. This leads to uncertainty, which in trading or investing leads to inaction. This mayexplain why so many traders opt to trade without Elliott Wave or give up in frustration after using itfor a while. But is such an attitude akin to throwing the baby out with the bath water?In this feature, we hunt down and use Elliott Wave-based programs and products that greatlystreamline the process of taking the theory and applying it to trade. Think of these as applicationsthat help bring Elliott Wave into the 21st century.Our goal is to familiarize readers with the new millennium version of Elliott Wave theory. For thosewho may have rejected the theory out of frustration, this tutorial will demonstrate how newdevelopments in technology have transformed this application developed over sixty years ago.Wolfe Wave: 1-4 trend 6In technical analysis, it is a naturally occurring trading pattern present in all financialmarkets. The pattern is composed of five waves showing supply and demand and a fighttowards an equilibrium price. These patterns can develop over short- and long-term timeframes such as minutes or weeks and are used to predict where a price is heading andwhen it will get there.If identified correctly, Wolfe waves can be used to accurately predict the scope(equilibrium price) of the underlying security. To identify Wolfe waves, they must have thefollowing characteristics:Waves 3-4 must stay within the channel created by 1-2Wave 1-2 equals waves 3-4 (shows symmetry)Wave 4 is within the channel created by waves 1-2There is regular time between all wavesWave 5 exceeds trendline created by waves 1 and 3 and is the entry pointThe estimated price is a price along the trendline created by waves 1 and 4 (point 6).
Gartley PatternIn technical analysis, it is a complex price pattern based on Fibonaccinumbers/ratios. It is used to determine buy and sell signals bymeasuring price retracements of a stock's up and down movement instock price.Source: www.chartsetups.comThe above Gartley example shows an uptrend XA with a price reversalat A. Using Fibonacci ratios, the retracement AB should be 61.8% ofthe price range A minus X, as shown by line XB. At B, the pricereverses again. Ideally, retracement BC should be between 61.8%and 78.6% of the AB price range, not the length of the lines, and isshown along the line AC. At C, the price again reverses withretracement CD between 127% and 161.8% of the range BC and isshown along the line BD. Price D is the point to buy/sell(bullish/bearish Gartley pattern) as the price is about toincrease/decrease.Advanced Fibonacci ApplicationsBy Justin KuepperContact JustinOctober 19, 2005Printer friendly version
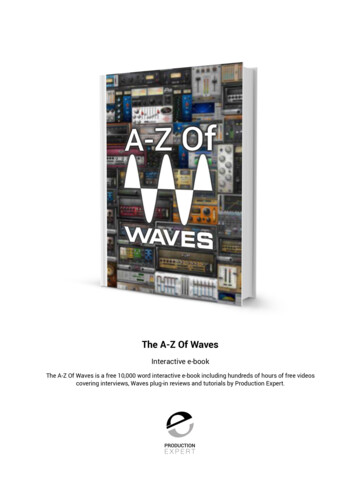
There is more to the world of Fibonacci thanretracements, arcs, fans and timezones! Everyyear new methods are developed for traders to take advantage of the uncanny tendencies of the markettowards derivatives of the golden ratio. Here we will discuss some of the more popular alternative uses ofFibonacci, including extensions, clusters and Gartleys, and we'll take a look at how to use them inconjunction with other patterns and indicators.Fibonacci ExtensionsFibonacci extensions are simply ratio-derived extensions beyond the standard 100% Fibonacci retracementlevel. They are extremely popular as forecasting tools, and they are often used in conjunction with otherchart patterns.The chart in Figure 1 shows what a Fibonacci extension forecast looks like.Figure 1 - The above is an example of how the Fibonacci extension levels of 161.8% and 261.8% act as futureareas of support and resistance.Here we can see that the original points (0-100%) were used to forecast extensions at 161.8% and 261.8%,which served as support and resistance levels in the future.Many traders use this in conjunction with wave-based studies - such as the Elliott Wave or Wolfe Wave - toforecast the height of each wave and more clearly define the different waves. (To learn more about ElliottWaves, see Elliott Wave Theory. For further reading on Wolfe Waves, see Advanced Channeling Patterns:Wolfe Waves And Gartleys.) Fibonacci extensions are also commonly used with other chart patterns suchas the ascending triangle. Once the pattern is found, a forecast can be created by adding 61.8% of thedistance between the upper resistance and the base of the triangle to the entry price. As you can see inFigure 2 below, these levels are generally deemed to be strategic places for traders to consider takingprofits.
Figure 2 - Many traders use the 161.8% Fibonacci extension level as a price target for when a security breaksout of an identified chart pattern.Fibonacci ClustersThe Fibonacci cluster is a culmination of Fibonacci retracements from various significant highs and lowsduring a given time period. Each of these Fibonacci levels is then plotted on the "Y" axis (price). Eachoverlapping price level makes a darker imprint on the cluster, enabling you to see where the mostsignificant Fibonacci support and resistance levels lie.Figure 3 - An example of Fibonacci clusters is shown on the right side of the chart. Dark stripes are considered tobe more influential levels of support and resistance than light ones. Notice the strong resistance just above the 20 level.Most traders use clusters as a way to gauge support and resistance levels. One popular technique is tocombine a "volume by price" graph on the left side, with a cluster on the right side. This allows you to see
key support and resistance levels.This technique can be used in conjunction with other Fibonacci techniques or chart patterns to confirmsupport and resistance levels.The Gartley PatternThe Gartley pattern is a lesser-known pattern combining the "M" and "W" tops and bottoms with variousFibonacci levels. The result is a reliable indicator of future price movements. Figure 4 shows what theGartley formation looks like.Figure 4 - An example of what bullish and bearish Gartley Patterns look like.Gartley patterns are formed using several rules regarding the distances between points: X to D - Must be 78.6% of the segment range XA.X to B - Must be near 61.8% of the XA segment.B to D - Must be between 127% and 161.8% of the range BC.A to C - Must be 38.2% of segment XA or 88.6% of segment AB.How can you measure these distances? Well, one way is to use Fibonacci retracements and extensionsto estimate the points. You can also download a free Excel-based spreadsheet from ChartSetups.com tocalculate the numbers. Many traders also use custom software, which often includes tools developedspecifically to identify and trade the Gartley pattern.
Launching Elliott Wave into the 21st CenturySolving the Probability Problem with Computer Power"Pride of opinion has been responsible for the downfall ofmore men on Wall Street than any other factor."Charles DowWithout a doubt, the greatest drawback of using Elliott Wave theory (EWT) and the reason mosttraders avoid it is its high degree of subjectivity. Even the most experienced Elliott experts can havetrouble agreeing on wave counts and forecasts on the same issue, index, or commodity. Wherethere is subjectivity, there is uncertainty. Overcoming this uncertainty requires the guidance of solidprobabilities determined by statistical analysis. Let's take a look at a development that, throughcomputer power, has helped take thesubjectivity out of the Elliott Wave theory.Adverse Effects of OpinionsAs all successful traders have learned, solid rules are essential to long-term success. The possible variations in deriving anElliott Wave count while either strictly or strongly adhering to the original rules make it hard to know which count is best.Ultimately, the analyst chooses the count with which he or she feels most comfortable, but that is often based on little morethan an educated guess or past experience. As such, the analysts may be prone to get "married" to the opinion, even whenlogic might dictate otherwise.Opinions never hurt when it comes to the markets until there is money at stake. If the market goes against the trader,unquestioning loyalty to an opinion can be very costly. Fear of being wrong, combined with pride of opinion, is a deadlyhandicap in the trading business; emotional gremlins are more responsible for traders' failings than any other single factor.In his book, Trading in the Zone, trader Mark Douglas helps traders break the emotional habit. All great traders who havesustained success have learned to think in probabilities, realizing that trading is nothing more than a numbers game.Successful traders have made it a habit to make decisions only if they know the risk/reward ratio and if they have backtested and recorded the past success of their system. Emotions don't control these decisions. Probabilities do.Until the late 20th century, however, Elliott traders did not have the luxury of knowing the precise probabilities of success orfailure of a forecast. Because of the complexities of Elliott Wave, there was no way of knowing what to expect with anydegree of mathematical confidence from even a single Elliott Wave pattern, let alone a complicated one spanning a numberof years. No public databases providing that information were available.Putting Elliott to the TestIn 1994, a small team from Perth led by Rich Swannell began designing Elliott Wave computer programs for traders.Swannell was a programmer first and trader second. Very few in the world of trading are good at both.During the early years, the team consulted with Elliott veterans, conducted intense research, and developed what Swannellclaims was the world's first comprehensive software program designed to analyze price data using the rules and guidelinesof Elliott's theory. The problem with the software was that it was based on observations and not an exhaustive statisticalanalysis of wave reliability. And, while results from the software were respectable, without probabilities the trader was stilltrading blind. How could a way be found to overcome this weakness?The team came up with a novel solution. Swannell developed a screensaver in 2001 that would work in the background onthe computers of more than three thousand volunteers. While not being used by their owners, these machines would bescanning a universe of stocks, commodities, and indexes to search for and analyze Elliott Wave patterns. The goal was todetermine once and for all which patterns worked, which did not, and even whether the Elliott Wave theory itself hadsufficient merit to trade it with confidence. It was all based on mathematical probabilities.After eighteen months and hundreds of thousands of hours of computer time, the team had enough data to start analyzing it.For those interested in more details, Swannell wrote a book about the experience that includes a good analysis of Elliottpatterns. Here is a summary of what they found:
1.Not only did the Elliott Wave theory prove statistically sound, the screensaver research was able to generateprobabilities of a forecast being correct. In other words, the trader could now know the chances of a wave patternand the resulting forecast with a low margin of error (statistical significance).2.The most common Elliott Wave patterns were often significantly different in both shape and frequency than theprevious conceptions of them. Some patterns that were previously believed to be reliable did not work oftenenough to be used with any degree of confidence.3.The team confirmed Murray Ruggiero's finding (discussed in the previous section of this tutorial) that a correctwave count is not the most important factor in trading. Even with the help of a good program, all Elliott forecastsare, at best, an educated guess: a trader can never be certain because there is always a larger pattern that cannotbe included in the analysis unless he or she goes back to the beginning of time. Swannell's team found that, sincemany alternate counts result in similar forecasts, this problem of possible inaccuracy is not as critical as manypreviously thought. As long as a count is arrived at logically, adheres to the rules, and is confirmed over varioustime periods, it doesn't matter what the larger degree (next largest wave pattern) is. In Swannell's findings, themost probable scenarios gave exactly or at least very similar forecasted results. This finding is crucial to a trader'ssuccess, and means that, as Ruggiero says, the count is of less importance than the penalty for being wrong,which is the loss on the trade.4.By performing forecasts in various time frames, the team separated the issues that worked from those that didn't.Forecasts for those that exhibited no consensus over various time periods were deemed unreliable (see ourexample below for a more detailed explanation). The probability for failure in most cases was greater than theprobability for success, so why take the chance?Of the thousands of equities, indexes, and commodities tested, Swannell's team found that in about 65% of the cases, ElliottWave theory proved too unreliable to be used to trade with any degree of confidence. In other words, using the theory totrade the instruments included in this 65% would prove a losing proposition. It means that traders should limit their focus tothe 35% that proved to be viable trading candidates.But why did only about one-third of the candidates work using Elliott? It has to do with the basis of the Elliott principle, whichquantifies market crowd behavior. Elliott Wave theory works best in equities that (1) have lots of volume (liquidity) and (2)move according to key forces of fear and greed on the part of many participants. When a security is not prone to this crowdbehavior and is controlled instead by a few strong hands, Elliott patterns begin to break down. Issues traded by a few aremore subject to manipulation and control, therefore are more difficult to forecast.Elliott warned us that his theory worked best on indexes and very liquid securities, so Swannell's finding was not all thatsurprising. But now the notion was proven and quantified, and a list of trading candidates was identified. In the process, alarge amount of subjectivity and uncertainty was removed. All this information was now stored and available in a largedatabase for immediate computer reference.Coding and Applying the Lessons LearnedThrough ongoing research and data from the screensaver program, Swannell's team further discovered that certaintechniques, when consistently applied, generated impressive forecasting results. A new proprietary indicator based in part onthe Elliott Wave oscillator (also discussed in the previous section of this tutorial) also greatly assisted the trader inrecognizing and confirming key reversal points.The new discoveries were in part based on a prime tenet of technical analysis that if a pattern or method of analysis works inone time frame, it should also work in others. Moreover, the more time frames in which patterns confirm each other, thehigher the probability that a forecast will be correct. For example, if a pattern within daily data agrees with one found inweekly data, the trader can have greater confidence in the pattern.Swannell's team also found that a pattern confirmed in the same time period (that is, one day) over multiple date ranges wasmuch more reliable. For example, say we, using a starting point of the October 1987 low, we find an impulse wave consistingof three up-waves and two down- (corrective) waves in an uptrend. If this impulse wave agrees with patterns we find using alow from 1998, a low from 2002, and one from 2003, the reliability of a forecast made using these four time periods issubstantially higher than one made in only one or two time frames. This confirmation of patterns has become the basicpremise of forecasting using the program called the Refined Elliott Trader.Taking the process one step further, the software Swannell's team developed rated each pattern, and those exhibiting arating of 80 or more were reliable enough to use in a forecast. Those with scores above 100 were most reliable.Let's look at an example analyzing the S&P 500 Index (SPX) using end-of-day data.The following charts show how the program is used to produce market forecasts. In this example, head trader Mark Lindsaytakes us through the analysis process of locating confirmation Elliott Waves over four different time periods. We are looking
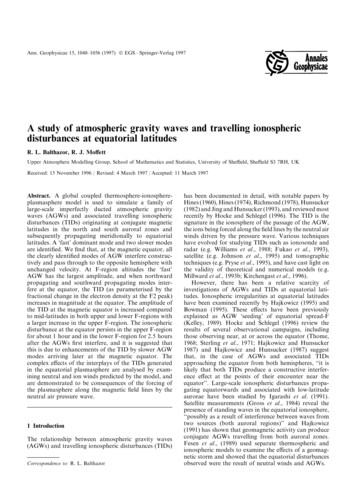
for parts of the same wave patterns. The more closely they confirm each other, the more confidence we can have in theforecast. .The Refined Elliott Trader looks for statistically significant matches and rates each pattern it identifies. Note on the left-handside of each chart the list of numbers showing the rating of each pattern. We are looking for ratings (at the top of the list) of80 or better. A rating of 100 is excellent and means that the pattern on the screen shows a strong correlation with similarpatterns found in the database.Figure 1 – Long-term chart of the SPX from 1990 to 2004 showing large impulse wave and forecasted price using RET. Data byeSignal.com. Chart provided by Refined Elliott Trader.In figure 1 we start with a chart going back fifteen years from 2004. It shows the longest-term chart with an impulse wavestarting in late 1990. Wave 1 peaks in mid-2000, and wave 2 bottoms in October 2002. Wave 2 is a corrective ABC pattern.According to this chart in 2003-2004 and going into 2005, we were in a wave 3. The dark red rectangular pattern, which hasa target area between 2000 and 3500 (indicated by dark-red vertical line) is the longer-term forecast.
Figure 2 – Second shorter-term chart of SPX focusing in on the same impulse pattern shown in figure 1. Data by eSignal.com. Chartprovided by Refined Elliott Trader.Next we isolate the wave 2 from March 2000 to October 2002 (figure 2) to see the pattern in more detail. Remember, we arelooking for pattern confirmation in each step of the process. As we take a closer look at each pattern, we see each wave ingreater detail.In figure 2, we take a closer look at the period from late 2000 to late 2003 and isolate impulse wave 3. Impulse waves occurin waves of five while corrective waves like the one we see if figure 1 between 2000 and 2002 occur in waves of three. Alsonote that forecasts generated in each chart confirm one another. This is important if the trader is to have a high degree ofconfidence in the ultimate forecast.In figure 3, we focus in closer, looking at the period from February 2003 and December 2004 showing impulse wave 3 ingreater detail. It shows the first part of wave 3 followed by a ‘double 3' (sideways corrective wave) with the start of a smallerwave 3 (at the buy arrow).
Figure 3 – Third shorter-term chart of SPX gives a closer look at the impulse pattern showing a similar forecast to the above charts.Data by eSignal.com. Chart provided by Refined Elliott Trader.The final screen (figure 4) shows the latest wave 3 from August 2004 to December 2004. The smaller parts of this waveconsist of even smaller impulse waves 1, 2, 3, 4, and what looks to be the start of an impulsive wave 5 with an immediateprice target from December 3 between 1220 and 1290.This program also produces expected time ranges for each target (not shown in these figures).
Figure 4 – Smallest time frame chart of the SPX showing end of impulse wave, forecasted price and the proprietary Refined ElliottOscillator (lower window) used to help traders pick potential entry and exit points. Data by eSignal.com. Chart provided by RefinedElliott Trader.It is important that the waves found by the program in each of the four charts confirm one other. If the overall pattern in thefirst chart is not found in the following three charts in a lesser degree, something is wrong and it's time to go back to thedrawing board. If after performing a detailed search, the patterns don't agree, it's better to discard the prospect of trading thesecurity than risk a bad trade.Challenges and SolutionsThe program developed by the Australian team may have solved a number of the challenges that existed, but it is not forthose looking for an effortless trading system.As a word of warning, the Refined Elliott Trader demands a thorough understanding and recognition of Elliott Wave patterns.A minimum of 50 hours is required to learn the 60 modules in the first level Elliottician course and then pass the four waverecognition speed tests. Those with a phobia for learning or with little interest in probing the nuances of Elliott Wave theoryare advised to look elsewhere.But in the final analysis, all Elliott traders should take heart in the findings of this research even if they have no interest inusing a computer program. It proves mathematically that the theory developed more than seventy years ago by R.N. Elliott isbased on sound principles of market behavior. Actions taken by investors in the past do have chart pattern ramifications inthe present--regardless of the reasons for these actions. And the scope and duration of these reactions can be used to tradeor invest longer term with greater confidence.Next: Conclusion and ResourcesTable of Contents1) Introduction2) Challenges Faced by an Expert3) Isolating the Best of the Theory4) Shifting Elliott into Trading Gear5) Solving the Probability Problem6) Conclusion and ResourcesPrinter friendly version in PDF formatNeed help with PDF files?
Figure 2: Bearish (W) Wolfe Wave Pattern Here are some key points to remember for identifying Wolfe Waves: Waves 3-4 must stay within the channel created by waves 1-2. Wave 5 ("se sale") -slightly- del channel created by waves 1-2 !!! Waves "1-2" equal waves "3-4" (showing symmetry). Wave 4 revisits the channel of points established by waves 1-2.