Transcription
White PaperDecember 2017AMS 2140Machinery Health AnalyzerHigh Frequency Vibration AnalysisThe emphasis in this paper is the capture and analysis of stress waves introduced into rotatingmachinery by events such as impacting, fatiguing, and friction. The stress wave events introduced intorotating machinery are mostly flexural waves (also referred to as bending or S waves). These wavespropagate away from the initiation site introducing a short term ripple on the surface of the machine.An absolute motion sensor (such as an accelerometer or ultrasonic sensor) with sufficient bandwidthand sensitivity will detect the short term wave activity providing important information for assistance infault detection and severity assessment. Brief discussions on the generation of stress waves and theirpropagation as waves away from the initiation site are presented. The theoretical predictions are brieflyverified by some simple experimental results. From the theoretical and experimental results, the expectedfrequency range over which the dominant energy appears for the various stress wave causing eventsare identified. Case studies employing both ultrasonic sensor and an accelerometer (using the PeakVuemethodology) are presented.www.emerson.com/ams
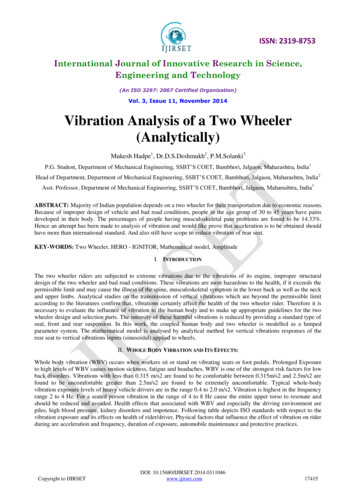
AMS 2140Machinery Health AnalyzerWhite PaperDecember 2017IntroductionVibration Analysis is the analysis of the motion introduced by the disturbance of a body (machine) about its equilibriumposition. The disturbance can be a) the motion of the body on a macroscopic scale or b) the disturbance of a small sectionof material within the body on a microscopic scale. The macroscopic motion can be introduced by forces such as unbalance,misalignment, et al. The microscopic motion can be introduced by disturbance of material within the body due to events suchas impacting, fatiguing, and friction. Microscopic vibrations are generally short term (order of fractional milliseconds) transientevents occurring at random or at periodic rates. The frequencies excited by the microscopic events are high frequency(typically in the kHz to several kHz range) relative to those excited by macroscopic vibration (kHz or less). In this paper,the focus is direct to the analysis of the microscopic high frequency vibrations.When impacting, fatiguing or friction events occur; energy is deposited in the machine in a very small region introducing motionaway from equilibrium in a short interval of time. This energy is dissipated by stress waves which travel away from the initiationsite at the speed of sound within the metal. As the stress waves propagate away from the initiation site, they introduce a smallshort term ripple on the surface of the machine (metal). An absolute motion sensor with sufficient bandwidth and sensitivity(such as an accelerometer) will capture these events.In the following sections of this paper, the discussion will focus on the introduction of microscopic vibration (stress waveactivity) in an elastic medium from various sources, the propagation of the stress waves form the initiation site to the detectionsite, the detection of the stress waves, and analysis methodologies. Several case studies are presented to demonstratevarious points emphasized in the formal discussions.Stress Wave Activity in Rotating MachineryStress Waves can be generated in any elastic medium. The primary interest focused on in this study is rotating machinery.Stress waves accompany the sudden displacement of small amounts of material in a very short time period.1, 2 In rotatingmachinery, this occurs when impacting, fatigue cracking, scuffing, abrasive wear, etc. occurs. The most frequent occurrencesof stress wave generation in rotating machinery are observed in fault initiation and progression in both rolling elementbearings and in gear teeth. The generation of stress waves from various events commonly experienced in rotating machineryis discussed in the next subsection. This will be followed by a discussion on the propagation of the stress waves from theinitiation site to the detection site. The detection of the stress waves are discussed in section 2.4.Generation of Stress WavesA quantitative framework for the generation and detection of stress waves can be developed using the Hertz theory for metalto-metal impacting3 and wave theory4 for propagation of stress waves in metal. The dominant stress waves generated by ametallic sphere impacting on a relatively large plate are bending waves* of half-period equal to the duration of the impact.Olma5 carried out a parametric study using the Hertz theory of impacting to establish an expected frequency band which maybe excited due to impacting from metallic balls of varying size and speed on large metallic plates. Graphical representationsof his results are presented in Figure 1. The impacting object was assumed to be spherical; therefore, the diameter for aspherical steel ball is presented in Figure 1 in lieu of the mass. The key parameter establishing the frequency range whereenergy would be expected to be excited from an impacting object is the contact time. Small diameter balls will have lesscontact time than will larger balls (see Figure 1). Shorter duration contact times (smaller diameter balls) will lead to a higherfrequency band being excited than will longer contact times (larger diameter balls).*Bending waves are also referred to as flexural waves and S waves.www.emerson.com/ams2
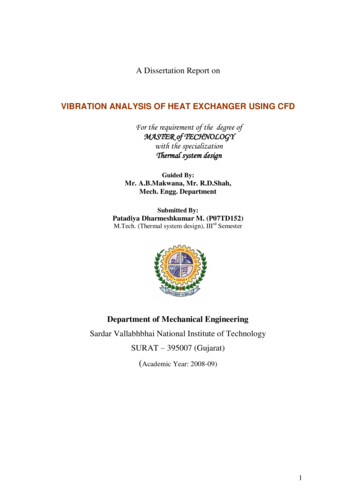
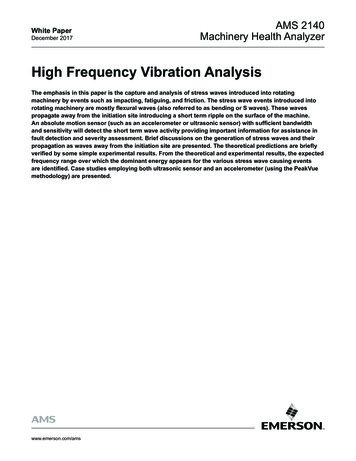
AMS 2140Machinery Health AnalyzerWhite PaperDecember 2017To experimentally explore the basic concept of frequency bandwidth being inversely correlated with ball size, a high frequencyaccelerometer was placed on a reasonably large metal plate in the proximity where impacting was carried out. The spectrumwas captured with an 80 kHz bandwidth using the “Peak Hold” averaging mode. The results for balls of diameter of 0.5 in. and1.5 in are presented in Figure 2. The captured signal, presented in Figure 2, is very similar to what would be expected from theHertz wave impact theory (illustrated in Figure 1).The contact time for the 1.5″ D ball is estimated to be 100 microseconds ( s) as per Figure1B. For 100 s contact time, thebandwidth to 10 dB attenuation would be around 10 kHz (Figure 1A). This bandwidth is consistent with that observed for the1.5″ D ball shown in Figure 2.† The contact time for the 0.5″ D ball would be in the 30–40 μs range (see Figure 1A). For thiscontact time, the bandwidth to the 10 dB attenuating level is estimated to be in the 30 kHz range(Figure 1B). This is veryconsistent with the impacting spectral data for the 0.5″ D ball presented in Figure 2.In addition to impacting as a source for stress wave activity in rotating machinery, friction (metal rubbing metal) andfatigue cracking must also be considered. The frequency band excited in the stress wave packets will still generally followthe Hertz theory if the equivalent contact time can be approximated (the time where material movement is present on amicroscopic scale).For the case of friction, two examples are presented in the form of spectral data. The first is for a reasonably small diameterbearing having rollers of about 3/8″ D running at about 3600 RPM where lubricant was sparse. The second is from a split ringpedestal bearing with rollers in the 1.0 to 1.5 inch diameter range turning at 700 RPM, which definitely had friction occurringas confirmed by large black spherical particles found in the oil lubricating the bearing.The spectral data from the smaller bearing are presented in Figure 3. Here, most energy is in the 20 kHz to 30 kHz rangeprimarily due to friction (lower limit has increased from 10 kHz to 20 kHz relative to ½″ D ball impacting data presented inFigure 2). The reduction in the spectral data in the 30 kHz range is most probably due to the sensor mounting, and not dueto absence of energy. Since the lower frequency has shifted upwards relative to the ½″ D ball by a factor of 2, the higherfrequency most probably also increased by a factor of 2 (60 kHz versus observed 30 kHz). This would place the equivalentcontact time during stress wave generation in the 20–25 μsec range.The spectral and time waveform data captured for the larger bearing turning around 700 RPM are presented in Figure 4. Thetime waveform is for a period of 40 msec where one large event (Pk-Pk g level of 216 g’s) was captured. The energy from this“friction” event is concentrated in the 5 to 18 kHz range, which is about a factor of 3 times greater than that observed from theimpacting of the1.5″ D ball (see Figure 2).The spectral data presented in Figures 2, 3, and 4 from impacting and friction events were displayed on a linear scale andhence showed a reasonably small frequency band where energy is present. Referring to Figure 1, theoretically the energy isbroadband, but with increasing attenuation with increasing frequency with a picket fence effect (nodal points). The spectraldata presented in Figure 4 with a linear amplitude scale is displayed in Figure 5 on a log scale. Here the broadband naturewith increasing attenuation with increasing frequency and the picket fence effect are apparent. From the comparisons of theenergy distribution versus frequency within stress wave generating events, it is concluded they are similar with the exceptionthat the equivalent contact time for friction is less than that caused by impacting by a factor of 2-4 times. This translates to thefrequency band where the dominant energies reside will be higher (factor of 2–4) for friction generated events than those fromimpacting events.The third major event for stress wave generation in rotating machinery is fatigue cracking. No specific data is readily availableto quantify the equivalent contact time; however, past experiences have suggested the duration (and hence, contact duration)of these events is less than that from friction-generated events. They would likely still be in the several μsec ranges (not thenanosecond range); hence the dominant energy would be in same range as friction activity.† The increased activity around 15 kHz in the spectral response for the 1.5” Diam. ball in Figure 2 is from structural resonance. This response was there and stationary for severaldifferent impacting balls of various diameters.www.emerson.com/ams3
AMS 2140Machinery Health AnalyzerWhite PaperDecember 2017Figure 1. Hertz Theory Prediction for Metal Balls for Varying Size and Speed Impacting on Large Metal Plates.5Figure 2. Spectral Data Captured for a 0.5″ Dia. and a 1.5″ Dia. Metal Ball Impacting on a LargeMetal Plate.www.emerson.com/ams4
AMS 2140Machinery Health AnalyzerWhite PaperDecember 2017Figure 3. Spectral Data Captured on Small Machine with 3/8″ Diameter Ball Running Dry at about3600 RPM (Note Difference in Impact & Friction Response Regions).Figure 4. Spectral and Time Waveform data from a Split Ring Pedestal Bearing with Rollers in the 1.0″to 1.5″ Diameter Range at 700 RPM with Friction.www.emerson.com/ams5
AMS 2140Machinery Health AnalyzerWhite PaperDecember 2017Figure 5. Spectral Data for Figure 4 with Log Amplitude Scale.Propagation of Stress Waves to Detection SiteBending waves are the most dominant stress waves generated in events experienced on rotating machinery.3, 5, 6The velocity at which bending waves propagate away from the initiation site is proportional to the square root offrequency. Thus there will be dispersion within the stress wave packet when viewed (detected) at locations removedfrom the initiation site. The amplitude of the event will decrease and the duration of the event will increase as the observationpoint is further removed from the initiation site.In addition to the diffusion of the stress wave packet, the attenuation of the stress waves are also frequencydependent4, 7 with the higher frequency components attenuating more rapidly than the lower frequency componentsas the observation (measurement) point is removed from the point of origin. This is especially true when stress wavepackets must cross physical interfaces such as from shaft (or inner race of a bearing) to the observation point on the outerstructure of the machine.The significant attenuation of concern is that associated with crossing physical boundaries. To demonstrate this effect and togain an approximate confirmation of the attenuation and its frequency dependence, a multi-frequency ultrasonic sensor** wasa) mounted on the inboard shaft of a stationary 15 HP motor; and b) then on the motor housing. The response was measuredwhile separately impacting the shaft with a 1.5′′ D ball and with a 0.5′′ D ball. The response using the three narrow bands of4 kHz, 30 kHz, and 150 kHz in dB were recorded and are presented in Table 1.**The AMS Model A700080 sensor modified to include 150 kHz band was used.www.emerson.com/ams6
AMS 2140Machinery Health AnalyzerWhite PaperDecember 2017TABLE IRESPONSE OF NARROW FREQUENCY BAND SENSOR TO IMPACTING BALLS ON SHAFT (dB)Ball Size4 kHz30 kHz150 6323201.5″8057432850Looking at the response at 30 kHz, an attenuation factor of about 14 dB (factor of 5) in the signal in passing from the shaftto the motor housing (see Table I). This is consistent with observations made in the past and with approximate theoreticalpredictions. The signal at 150 kHz did not transmit from the motor shaft to the motor housing for the 0.5″ D ball impacting. Thusthe attenuation exceeds 30 dB (factor of 30) at this frequency. For the 4 kHz range, the apparent attenuation from the shaft ofapproximately 25 to 35 dB ( 77-42 dB for the 0.5″ D; and 80-57 dB for the 1.5″ D) to the outer housing exceeds expectationsbased on both theory and on experience (one would only expect 6-10 dB attenuation). The most probable explanation for thisresult is that the stress waves maybe exciting the natural frequency (mode) of this shaft, thereby introducing excessive motionin the proximity of the sensor mount on the shaft.Based on the above discussion on the stress wave propagation from the initiation site to the probable observation point on theouter surface, the higher frequency components will be attenuated more rapidly than will the lower. Even though frequenciesexceeding 100 kHz are generated for impacting of small balls ( 0.5″ D), friction events, and fatigue cracking, the probabilityof that energy transmitting to a location where a sensor could be mounted is small at such a high frequency.Detection of Stress WavesDue to the dispersion and attenuation of the stress wave packet, it is desirable to locate the sensor as near to the initiation siteas possible. This generally will be near or on the bearing housing (preferably in the load zone). Stress waves will propagate inall directions. Hence the selection of axial, vertical, or radial is less of an issue than is mounting the sensor in or near the loadzone (relative to normal vibration monitoring). The sensor can be an accelerometer or an ultrasonic sensor. The advantage ofan accelerometer (a broadband sensor) is that the primary energy from stress waves initiated from impacting, fatiguing, andfriction can be captured. The ultrasonic sensor typically is a narrow bandwidth sensor. The frequency at which the ultrasonicsensor is tuned may be greater than the dominant frequency range for a particular event type, but the sensor could still capturethe event due to the “picket fence” effect (see Figure 1).Analysis of Stress WavesThe sensors employed for the detection of stress waves generally are an accelerometer or an ultrasonic sensor. Theaccelerometer is responsive to a broad frequency range (covering macroscopic and microscopic vibration). The ultrasonicsensor is responsive in a narrow frequency band around a fixed center frequency. The objectives in Vibration Analysis relativeto stress wave activity are:1. Detect the presence of stress waves;2. Identify the periodicity (or lack thereof) of the stress wave events;3. Identify the source;4. Assist in severity assessment of the fault.In the next subsection, the use of an ultrasonic sensor for vibration analysis of stress waves is discussed. This will be followedusing an accelerometer as the sensor for vibration analysis of stress waves.www.emerson.com/ams7
AMS 2140Machinery Health AnalyzerWhite PaperDecember 2017Stress Wave Analysis with an Ultrasonic SensorAn ultrasonic sensor has a narrow frequency band centered on a fixed frequency. The fixed frequency is set by the supplierof the sensor. Referring to the data in Figures 3–5, the center frequency would optimally be set in the 1–40 kHz range tooptimize the sensor response to impacting, friction and fatiguing type events.A common ultrasonic sensor used for stress wave vibration analysis has a center frequency of approximately 25 kHz.This sensor would be responsive to the primary lobes of activity for both impacting and friction from the small balls(see Figures 2–4) and the secondary lobes for the larger ball. Thus the sensor would theoretically meet the first objectiveof detecting the presence of stress waves. If a data block of sufficient duration is captured (typically containing 15 ormore revolutions of the machine being monitored), an autocorrelation analysis would suffice to establish no periodicity(2nd objective). A spectral analysis could identify the rate of any periodic activity (identifying the source). The level of thesignal (g-level) could not be relied upon to establish severity of the fault in a consistent manner.Stress Wave Analysis with an AccelerometerAccelerometers typically used for vibration analysis when stud mounted on a clean flat surface have a bandwidth from thelow Hertz to sensor resonance (typically in 25-35 kHz range). Thus the sensor covers the macroscopic and a significantpercentage of the microscopic vibration frequency range. For macroscopic vibration analysis, the signal is band limited bya low pass (anti-aliasing) filter which generally is in the fractional to a few kHz range. For microscopic vibration analysis,the signals from the accelerometer due to microscopic events are separated from macroscopic vibration by routing the signalfrom the accelerometer through a high pass filter. The upper frequency for the microscopic analysis is dependent on themounted sensor natural frequency.For a commonly-used accelerometer used for route based data acquisition, the mounted resonances are typified by themeasured frequency response curves presented in Figure 6†† for cases of 1) sensor stud mounted (around 30 kHz), 2) sensorattached to flat rare earth magnet and placed on clean smooth flat surface (around 15 kHz) and 3) sensor attached to dual railmagnet and placed on clean curved surface (around 9 kHz). Experience has demonstrated that use of a flat magnet mountingprovides adequate capability for detecting friction and fatiguing on industrial machinery if this magnet is mounted on a clean,flat surface (allowing it to measure up to approximately 15 kHz).Data Reduction MethodologyThe dominant vibration analysis occurs in the spectral (frequency) domain. This requires the capture of a time waveform(digital) which generally is transformed into the frequency domain via an FFT analysis. In addition to the spectral analysis,the transforming of the time waveform into the autocorrelation function provides great assistance in diagnostics.Autocorrelation allows an analyst to determine what are the dominant periodic events within either a normal or stresswave analysis waveform (in doing so, it can often clean up a waveform allowing an analyst to see what sources are themain contributors to such waveforms).The first task is the construction of the time waveform of sufficient duration (should contain 15 revolutions of the machinebeing monitored). To acquire a direct capture of the waveform associated with microscopic vibration, a high sampling ratewould be required (such as 50,000 samples/sec or higher) for a significant time (15 revolutions), which is not practical.Hence an alternative method of obtaining an appropriate time waveform is required.Two methods of obtaining the time waveform for stress wave vibration analysis are briefly discussed here. The first isa commonly used Amplitude Demodulation technique. The second is a peak value (PeakVue ) methodology employedby Emerson.†† The frequency response curves were provided by IMI Sensors a PCB Piezotronics Division located in Depew, NY.www.emerson.com/ams8
AMS 2140Machinery Health AnalyzerWhite PaperDecember 2017Figure 6. 50kHz Frequency Response for Accelerometer a) Stud Mounted,b) Flat Magnet Mounted, and c) 2-Rail Magnet on Curved Surface Mounted.The procedure for the demodulation methodology is to route the signal from the accelerometer through 1) a high pass filter,2) full wave rectification, 3) low pass filter to separate the modulating signal from the “carrier,” and 4) convert the resultantsignal into a digital signal with bandwidth exceeding the highest probable fault frequency with a duration sufficient to capture15 revolutions.The PeakVue methodology is similar to the demodulation methodology with the exception that the signal never goesthrough a low pass filter. That step is replaced by an absolute peak value extraction. The essence of the procedure is to1) pass the signal through a high pass filter, always sample the signal at a sampling rate consistent with the 40 kHz bandwidth(2.56 40,000 102,400 samples/sec), construct the peak value time waveform by absolute decimation by the factor of40,000/(analysis Fmax) sequentially until the waveform block is complete.To demonstrate the effect of the low pass filter (could be the anti-aliasing filter set by the analysis bandwidth), considerthe time waveform presented in Figure 7. The waveform was constructed by capturing a waveform from a machine withsignificant friction activity with an Fmax set at 40,000 Hz and 1600 lines (4096 data points). The captured waveform wasthen repeated seven times to make up the test waveform presented in Figure 7. Using this test waveform, the waveformsfor both demodulation and PeakVue were constructed for an analysis bandwidth of 1000 Hz, 200 Hz, and 50 Hz. Theresults are presented in Figure 8. The attenuation which the low pass filter (here it is the anti-aliasing filter) has is obvious.The demodulation process lost at least 75% of the signal relative to the equivalent PeakVue data. On the other hand,the attenuation introduced in the PeakVue methodology is non-existent.www.emerson.com/ams9
AMS 2140Machinery Health AnalyzerWhite PaperDecember 2017Figure 7. Waveform Used to Demonstrate the PeakVue Methodology Versus theClassic Demodulation Methodology Presented.Case StudiesThree case studies are selected to emphasize key points brought out in the body of this paper. The first case study employsa multi-frequency ultrasonic sensor for the detection and location of a bearing fault on a conveyor belt used to transportmaterial at a mining facility. The second case study is the comparison of demodulation and PeakVue data from a gearboxdriving a rock crusher. Demodulation and PeakVue data were acquired in a route based condition monitoring program. Thethird case study was selected to emphasize the importance of maintaining discipline in sensor mounting in Route Basedvibration condition monitoring.Ultrasonic Sensor for Bearing Fault DetectionA multiple frequency ultrasonic sensor with three center frequencies of 4 kHz, 30 kHz and 40 kHz was used to monitor twoconveyor belt systems where each has a length of 0.5 mile and width of 4 feet. An outline drawing representative of theconveyor belts is presented in Figure 9. The inboard and outboard bearings were monitored on each of the 6 rolls on eachconveyor belt (total of 24 bearings). Of the 24 monitored bearings, 8 were identified as having probable bearing faults. The8 bearings were replaced and 7 of the 8 were visibly verified to be defective (no means for estimating severity of faults fromthe data since no trend data was available).www.emerson.com/ams10
AMS 2140Machinery Health AnalyzerWhite PaperDecember 2017Figure 8. Demodulation and PeakVue waveforms from waveform presented in Figure 7 for Fmax 1000, 200 and 50 Hz.www.emerson.com/ams11
AMS 2140Machinery Health AnalyzerWhite PaperDecember 2017Figure 9. Conveyor Belt with Key Rolls Identified.Representative spectral data from the ultrasonic sensor from the IB (inboard) Head Snubber of the B Conveyor System for the4 kHz and 30 kHz channels are presented in Figure 10. The periodic activity is at the BPFO fault frequency. The spectral datafrom the OB (outboard) bearing of the same Head Snubber roll are presented in Figure 11. The outer race fault signature is stillpresent in the 4 kHz OB data but not in the OB 30 kHz data. The absence of the fault signature in the 30 kHz data on the OBleads to the conclusion that the fault is in the IB bearing.Demodulation and PeakVue DataData are presented in this subsection extracted from a route base condition monitoring program of a Kiln gearbox. In thetransition from the demodulation to the PeakVue methodology, both sets of data were acquired and stored. The spectraldata from demodulation and PeakVue methodologies are presented in Figure 12. Both sets of data show periodic activityat 4.02 Hz (running speed). The time waveforms corresponding to these two spectral data are presented in Figure 13. In thePeakVue data, the peak g-level is 1.24 g’s. In the demodulation waveform data, the peak g-level is 0.27 g’s. For a shaft turningat 241 RPM, the recommended Alert level in PeakVue is 1.9 g’s. Thus the possible fault would have minimal impact on themonitoring program since it is below the Alert level. Since the g-level in Demodulation is dependent on analysis bandwidth,fault type, etc., the Demodulation g-level cannot reliably assist in severity assessment. Thus further analysis (of demodulationdata) would be required to estimate severity.www.emerson.com/ams12
AMS 2140Machinery Health AnalyzerWhite PaperDecember 2017Figure 10. 30 kHz and 4 kHz Ultrasonic Sensor Response on Inboard Bearing of HeadSnubber Roll (Running Speed 80.54 RPM 1.34 Hz).Figure 11. PeakVue and Demodulation Spectra Data from Kiln Gearbox Collectedin Route Mode on Same Date.www.emerson.com/ams13
AMS 2140Machinery Health AnalyzerWhite PaperDecember 2017Figure 12. Time Waveform of PeakVue and Demodulation Data Correspondingto Spectral Data in Figure 11. PV Waveform is Below Alert Level of 1.9 g’s for242 RPM Shaft.Sensor MountingPeakVue data acquired from the inboard bearing of a motor driving a pump are presented in Figure 14. The pattern in thePeakVue spectral data is that expected from a bearing having an outer race fault. The peak g-level is only 6.15 g’s whichplaces the fault in the early Alert level (5 g’s). Thus the recommended action would be to flag the potential problem and trendit over time.It was noted the sensor (2-pole magnet) was placed on a heavily painted surface. Thus, the paint was subsequently scrapedoff. The data was then reacquired with the results presented in Figure 15. The spectral data is similar but the peak g-levelis 17 g’s. This is well past the recommended Fault level of 10 g’s. The recommended action here would be to increase themonitoring frequency and initiate plans for bearing replacement.www.emerson.com/ams14
AMS 2140Machinery Health AnalyzerWhite PaperDecember 2017ConclusionsMany faults experienced in industrial machinery are accompanied by the emission of stress wave activity which are shortterm (fractional to a few milliseconds) relatively high frequency events. Presence of stress wave activity suggests a fault ispresent. Capturing of the events and identifying the periodic rate (or lack thereof) of occurrence identifies the probable sourceof the fault. Capturing and maintaining the true peak g-level provides a parameter (peak g-level) which is very beneficial in theimportant task of assessment of severity level of the fault.Figure 13. PeakVue Data from Inboard Motor Bearing Showing BPFO Fault in the Early AlertStage (6.2 g’s Peak).Figure 14. PeakVue Data from Same Point Presented in Figure 13, 10 Minutes LaterFollowing Removing Paint Where Sensor was Located. g-level Increased from 6.2 g’s(Early Alert) to 17 g’s (Serious Fault).www.emerson.com/ams15
AMS 2140Machinery Health AnalyzerWhite PaperDecember 2017Even though there are significant variations in the frequency band, dependent on event type, speed, etc, where the dominantenergy within stress wave events occur, a narrowband sensor (such as an ultrasonic sensor with center frequency in the 20-40kHz range will capture many of the stress wave activities experienced in industrial machinery over a reasonable speed range.The absolute level captured with a narrowband ultrasonic sensor will not generally be of great value for severity assessment.To capture a significant fraction of the stress wave events within industrial machinery, a broadband sensor with a bandwidthup to 15 kHz should be employed. With this bandwidth, events from impacting, friction and fatigue cracking can reliably becaptured. This bandwidth is obtainable employing the typical 100 mV/g sensor attached to a smooth flat surface using a flatrare earth magnet. If the more commonly used accelerometer with a 2-pole magnet attached to a clean (paint free) smoothrounded surface is employed, impacting events will reliably be captured, but friction and fatiguing events may be missed.References1. Dr. Adrian A. Pollock, “Acoustic Emission Inspection,” Metals Handbook, Ninth Edition, Vol. 17, ASM International (1989): pages 278-294.2. William H. Hoppman II, “Effect of impact on Structures.” Shock and Vibration Handbook, ed. by Cyril M. Harris, 4th Edition, McGraw-Hill.3. Cremer, Heckl and Ungar, Structure-Borne Sound, Springer-Verlag, New York, 1983.Charles W. Mayo, et al., “Loose Parts Monitoring System Improvements,” EPRI NP-5743, March 1988.4. B. J. Olma
High Frequency Vibration Analysis The emphasis in this paper is the capture and analysis of stress waves introduced into rotating machinery by events such as impacting, fatiguing, and friction. The stress wave events introduced into rotating machinery are mostly flexural waves (also referred to as bending or S waves). These waves