Transcription
d7/14/99 4:34 PMPage 1ChapterOneThe Nature of Econometrics andEconomic DataChapter 1 discusses the scope of econometrics and raises general issues that resultfrom the application of econometric methods. Section 1.3 examines the kinds ofdata sets that are used in business, economics, and other social sciences. Section1.4 provides an intuitive discussion of the difficulties associated with the inference ofcausality in the social sciences.1.1 WHAT IS ECONOMETRICS?Imagine that you are hired by your state government to evaluate the effectiveness of apublicly funded job training program. Suppose this program teaches workers variousways to use computers in the manufacturing process. The twenty-week program offerscourses during nonworking hours. Any hourly manufacturing worker may participate,and enrollment in all or part of the program is voluntary. You are to determine what, ifany, effect the training program has on each worker’s subsequent hourly wage.Now suppose you work for an investment bank. You are to study the returns on different investment strategies involving short-term U.S. treasury bills to decide whetherthey comply with implied economic theories.The task of answering such questions may seem daunting at first. At this point,you may only have a vague idea of the kind of data you would need to collect. By theend of this introductory econometrics course, you should know how to use econometric methods to formally evaluate a job training program or to test a simple economic theory.Econometrics is based upon the development of statistical methods for estimatingeconomic relationships, testing economic theories, and evaluating and implementinggovernment and business policy. The most common application of econometrics is theforecasting of such important macroeconomic variables as interest rates, inflation rates,and gross domestic product. While forecasts of economic indicators are highly visibleand are often widely published, econometric methods can be used in economic areasthat have nothing to do with macroeconomic forecasting. For example, we will studythe effects of political campaign expenditures on voting outcomes. We will consider theeffect of school spending on student performance in the field of education. In addition,we will learn how to use econometric methods for forecasting economic time series.1
14/99 4:34 PMPage 2Chapter 1The Nature of Econometrics and Economic DataEconometrics has evolved as a separate discipline from mathematical statisticsbecause the former focuses on the problems inherent in collecting and analyzing nonexperimental economic data. Nonexperimental data are not accumulated through controlled experiments on individuals, firms, or segments of the economy. (Nonexperimentaldata are sometimes called observational data to emphasize the fact that the researcheris a passive collector of the data.) Experimental data are often collected in laboratoryenvironments in the natural sciences, but they are much more difficult to obtain in thesocial sciences. While some social experiments can be devised, it is often impossible,prohibitively expensive, or morally repugnant to conduct the kinds of controlled experiments that would be needed to address economic issues. We give some specific examples of the differences between experimental and nonexperimental data in Section 1.4.Naturally, econometricians have borrowed from mathematical statisticians whenever possible. The method of multiple regression analysis is the mainstay in both fields,but its focus and interpretation can differ markedly. In addition, economists havedevised new techniques to deal with the complexities of economic data and to test thepredictions of economic theories.1.2 STEPS IN EMPIRICAL ECONOMIC ANALYSISEconometric methods are relevant in virtually every branch of applied economics. Theycome into play either when we have an economic theory to test or when we have a relationship in mind that has some importance for business decisions or policy analysis. Anempirical analysis uses data to test a theory or to estimate a relationship.How does one go about structuring an empirical economic analysis? It may seemobvious, but it is worth emphasizing that the first step in any empirical analysis is thecareful formulation of the question of interest. The question might deal with testing acertain aspect of an economic theory, or it might pertain to testing the effects of a government policy. In principle, econometric methods can be used to answer a wide rangeof questions.In some cases, especially those that involve the testing of economic theories, a formal economic model is constructed. An economic model consists of mathematicalequations that describe various relationships. Economists are well-known for theirbuilding of models to describe a vast array of behaviors. For example, in intermediatemicroeconomics, individual consumption decisions, subject to a budget constraint, aredescribed by mathematical models. The basic premise underlying these models is utility maximization. The assumption that individuals make choices to maximize their wellbeing, subject to resource constraints, gives us a very powerful framework for creatingtractable economic models and making clear predictions. In the context of consumptiondecisions, utility maximization leads to a set of demand equations. In a demand equation, the quantity demanded of each commodity depends on the price of the goods, theprice of substitute and complementary goods, the consumer’s income, and the individual’s characteristics that affect taste. These equations can form the basis of an econometric analysis of consumer demand.Economists have used basic economic tools, such as the utility maximization framework, to explain behaviors that at first glance may appear to be noneconomic in nature.A classic example is Becker’s (1968) economic model of criminal behavior.2
d7/14/99 4:34 PMPage 3Chapter 1The Nature of Econometrics and Economic DataE X A M P L E1 . 1(Economic Model of Crime)In a seminal article, Nobel prize winner Gary Becker postulated a utility maximization framework to describe an individual’s participation in crime. Certain crimes have clear economicrewards, but most criminal behaviors have costs. The opportunity costs of crime prevent thecriminal from participating in other activities such as legal employment. In addition, thereare costs associated with the possibility of being caught and then, if convicted, the costsassociated with incarceration. From Becker’s perspective, the decision to undertake illegalactivity is one of resource allocation, with the benefits and costs of competing activitiestaken into account.Under general assumptions, we can derive an equation describing the amount of timespent in criminal activity as a function of various factors. We might represent such a function asy f (x1,x2,x3,x4,x5,x6,x7),(1.1)wherey hours spent in criminal activitiesx1 “wage” for an hour spent in criminal activityx2 hourly wage in legal employmentx3 income other than from crime or employmentx4 probability of getting caughtx5 probability of being convicted if caughtx6 expected sentence if convictedx7 ageOther factors generally affect a person’s decision to participate in crime, but the list aboveis representative of what might result from a formal economic analysis. As is common ineconomic theory, we have not been specific about the function f( ) in (1.1). This functiondepends on an underlying utility function, which is rarely known. Nevertheless, we can useeconomic theory—or introspection—to predict the effect that each variable would have oncriminal activity. This is the basis for an econometric analysis of individual criminal activity.Formal economic modeling is sometimes the starting point for empirical analysis,but it is more common to use economic theory less formally, or even to rely entirely onintuition. You may agree that the determinants of criminal behavior appearing in equation (1.1) are reasonable based on common sense; we might arrive at such an equationdirectly, without starting from utility maximization. This view has some merit,although there are cases where formal derivations provide insights that intuition canoverlook.3
14/99 4:34 PMPage 4Chapter 1The Nature of Econometrics and Economic DataHere is an example of an equation that was derived through somewhat informalreasoning.E X A M P L E1 . 2( J o b Tr a i n i n g a n d W o r k e r P r o d u c t i v i t y )Consider the problem posed at the beginning of Section 1.1. A labor economist would liketo examine the effects of job training on worker productivity. In this case, there is little needfor formal economic theory. Basic economic understanding is sufficient for realizing thatfactors such as education, experience, and training affect worker productivity. Also, economists are well aware that workers are paid commensurate with their productivity. This simple reasoning leads to a model such aswage f(educ,exper,training)(1.2)where wage is hourly wage, educ is years of formal education, exper is years of workforceexperience, and training is weeks spent in job training. Again, other factors generally affectthe wage rate, but (1.2) captures the essence of the problem.After we specify an economic model, we need to turn it into what we call an econometric model. Since we will deal with econometric models throughout this text, it isimportant to know how an econometric model relates to an economic model. Take equation (1.1) as an example. The form of the function f ( ) must be specified before we canundertake an econometric analysis. A second issue concerning (1.1) is how to deal withvariables that cannot reasonably be observed. For example, consider the wage that aperson can earn in criminal activity. In principle, such a quantity is well-defined, but itwould be difficult if not impossible to observe this wage for a given individual. Evenvariables such as the probability of being arrested cannot realistically be obtained for agiven individual, but at least we can observe relevant arrest statistics and derive a variable that approximates the probability of arrest. Many other factors affect criminalbehavior that we cannot even list, let alone observe, but we must somehow account forthem.The ambiguities inherent in the economic model of crime are resolved by specifying a particular econometric model:crime 0 1wagem 2othinc 3 freqarr 4 freqconv 5avgsen 6age u,(1.3)where crime is some measure of the frequency of criminal activity, wagem is the wagethat can be earned in legal employment, othinc is the income from other sources (assets,inheritance, etc.), freqarr is the frequency of arrests for prior infractions (to approximate the probability of arrest), freqconv is the frequency of conviction, and avgsen isthe average sentence length after conviction. The choice of these variables is determined by the economic theory as well as data considerations. The term u contains unob4
d7/14/99 4:34 PMPage 5Chapter 1The Nature of Econometrics and Economic Dataserved factors, such as the wage for criminal activity, moral character, family background, and errors in measuring things like criminal activity and the probability ofarrest. We could add family background variables to the model, such as number of siblings, parents’ education, and so on, but we can never eliminate u entirely. In fact, dealing with this error term or disturbance term is perhaps the most important componentof any econometric analysis.The constants 0, 1, , 6 are the parameters of the econometric model, and theydescribe the directions and strengths of the relationship between crime and the factorsused to determine crime in the model.A complete econometric model for Example 1.2 might bewage 0 1educ 2exper 3training u,(1.4)where the term u contains factors such as “innate ability,” quality of education, familybackground, and the myriad other factors that can influence a person’s wage. If weare specifically concerned about the effects of job training, then 3 is the parameter ofinterest.For the most part, econometric analysis begins by specifying an econometric model,without consideration of the details of the model’s creation. We generally follow thisapproach, largely because careful derivation of something like the economic model ofcrime is time consuming and can take us into some specialized and often difficult areasof economic theory. Economic reasoning will play a role in our examples, and we willmerge any underlying economic theory into the econometric model specification. In theeconomic model of crime example, we would start with an econometric model such as(1.3) and use economic reasoning and common sense as guides for choosing the variables. While this approach loses some of the richness of economic analysis, it is commonly and effectively applied by careful researchers.Once an econometric model such as (1.3) or (1.4) has been specified, varioushypotheses of interest can be stated in terms of the unknown parameters. For example,in equation (1.3) we might hypothesize that wagem, the wage that can be earned in legalemployment, has no effect on criminal behavior. In the context of this particular econometric model, the hypothesis is equivalent to 1 0.An empirical analysis, by definition, requires data. After data on the relevant variables have been collected, econometric methods are used to estimate the parameters inthe econometric model and to formally test hypotheses of interest. In some cases, theeconometric model is used to make predictions in either the testing of a theory or thestudy of a policy’s impact.Because data collection is so important in empirical work, Section 1.3 will describethe kinds of data that we are likely to encounter.1.3 THE STRUCTURE OF ECONOMIC DATAEconomic data sets come in a variety of types. While some econometric methods canbe applied with little or no modification to many different kinds of data sets, the special features of some data sets must be accounted for or should be exploited. We nextdescribe the most important data structures encountered in applied work.5
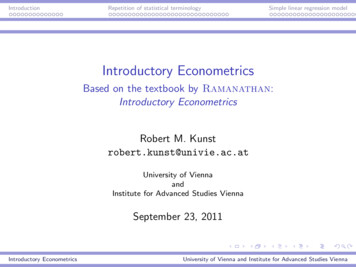
14/99 4:34 PMPage 6Chapter 1The Nature of Econometrics and Economic DataCross-Sectional DataA cross-sectional data set consists of a sample of individuals, households, firms, cities,states, countries, or a variety of other units, taken at a given point in time. Sometimesthe data on all units do not correspond to precisely the same time period. For example,several families may be surveyed during different weeks within a year. In a pure crosssection analysis we would ignore any minor timing differences in collecting the data. Ifa set of families was surveyed during different weeks of the same year, we would stillview this as a cross-sectional data set.An important feature of cross-sectional data is that we can often assume that theyhave been obtained by random sampling from the underlying population. For example, if we obtain information on wages, education, experience, and other characteristicsby randomly drawing 500 people from the working population, then we have a randomsample from the population of all working people. Random sampling is the samplingscheme covered in introductory statistics courses, and it simplifies the analysis of crosssectional data. A review of random sampling is contained in Appendix C.Sometimes random sampling is not appropriate as an assumption for analyzingcross-sectional data. For example, suppose we are interested in studying factors thatinfluence the accumulation of family wealth. We could survey a random sample of families, but some families might refuse to report their wealth. If, for example, wealthierfamilies are less likely to disclose their wealth, then the resulting sample on wealth isnot a random sample from the population of all families. This is an illustration of a sample selection problem, an advanced topic that we will discuss in Chapter 17.Another violation of random sampling occurs when we sample from units that arelarge relative to the population, particularly geographical units. The potential problemin such cases is that the population is not large enough to reasonably assume the observations are independent draws. For example, if we want to explain new business activity across states as a function of wage rates, energy prices, corporate and property taxrates, services provided, quality of the workforce, and other state characteristics, it isunlikely that business activities in states near one another are independent. It turns outthat the econometric methods that we discuss do work in such situations, but they sometimes need to be refined. For the most part, we will ignore the intricacies that arise inanalyzing such situations and treat these problems in a random sampling framework,even when it is not technically correct to do so.Cross-sectional data are widely used in economics and other social sciences. In economics, the analysis of cross-sectional data is closely aligned with the applied microeconomics fields, such as labor economics, state and local public finance, industrialorganization, urban economics, demography, and health economics. Data on individuals, households, firms, and cities at a given point in time are important for testing microeconomic hypotheses and evaluating economic policies.The cross-sectional data used for econometric analysis can be represented andstored in computers. Table 1.1 contains, in abbreviated form, a cross-sectional data seton 526 working individuals for the year 1976. (This is a subset of the data in the fileWAGE1.RAW.) The variables include wage (in dollars per hour), educ (years of education), exper (years of potential labor force experience), female (an indicator for gender),and married (marital status). These last two variables are binary (zero-one) in nature6
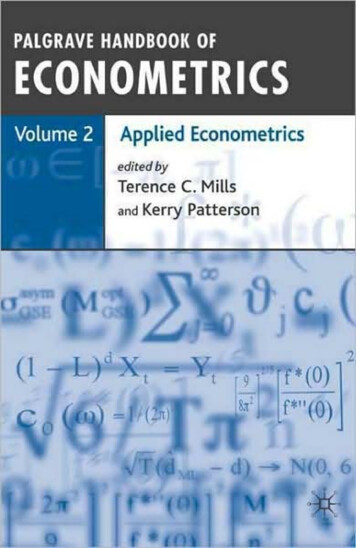
d7/14/99 4:34 PMPage 7Chapter 1The Nature of Econometrics and Economic DataTable 1.1A Cross-Sectional Data Set on Wages and Other Individual 01121023.2412221133.001120046.008440155.3012701 52511.56165015263.5014510and serve to indicate qualitative features of the individual. (The person is female or not;the person is married or not.) We will have much to say about binary variables inChapter 7 and beyond.The variable obsno in Table 1.1 is the observation number assigned to each personin the sample. Unlike the other variables, it is not a characteristic of the individual. Alleconometrics and statistics software packages assign an observation number to eachdata unit. Intuition should tell you that, for data such as that in Table 1.1, it does notmatter which person is labeled as observation one, which person is called ObservationTwo, and so on. The fact that the ordering of the data does not matter for econometricanalysis is a key feature of cross-sectional data sets obtained from random sampling.Different variables sometimes correspond to different time periods in crosssectional data sets. For example, in order to determine the effects of government policies on long-term economic growth, economists have studied the relationship betweengrowth in real per capita gross domestic product (GDP) over a certain period (say 1960to 1985) and variables determined in part by government policy in 1960 (governmentconsumption as a percentage of GDP and adult secondary education rates). Such a dataset might be represented as in Table 1.2, which constitutes part of the data set used inthe study of cross-country growth rates by De Long and Summers (1991).7
14/99 4:34 PMPage 8Chapter 1The Nature of Econometrics and Economic DataTable 1.2A Data Set on Economic Growth Rates and Country 4Bolivia1.241812 61Zimbabwe2.30176The variable gpcrgdp represents average growth in real per capita GDP over the period1960 to 1985. The fact that govcons60 (government consumption as a percentage ofGDP) and second60 (percent of adult population with a secondary education) correspond to the year 1960, while gpcrgdp is the average growth over the period from 1960to 1985, does not lead to any special problems in treating this information as a crosssectional data set. The order of the observations is listed alphabetically by country, butthere is nothing about this ordering that affects any subsequent analysis.Time Series DataA time series data set consists of observations on a variable or several variables overtime. Examples of time series data include stock prices, money supply, consumer priceindex, gross domestic product, annual homicide rates, and automobile sales figures.Because past events can influence future events and lags in behavior are prevalent in thesocial sciences, time is an important dimension in a time series data set. Unlike thearrangement of cross-sectional data, the chronological ordering of observations in atime series conveys potentially important information.A key feature of time series data that makes it more difficult to analyze than crosssectional data is the fact that economic observations can rarely, if ever, be assumed tobe independent across time. Most economic and other time series are related, oftenstrongly related, to their recent histories. For example, knowing something about thegross domestic product from last quarter tells us quite a bit about the likely range of theGDP during this quarter, since GDP tends to remain fairly stable from one quarter to8
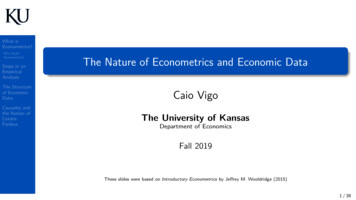
d7/14/99 4:34 PMPage 9Chapter 1The Nature of Econometrics and Economic Datathe next. While most econometric procedures can be used with both cross-sectional andtime series data, more needs to be done in specifying econometric models for timeseries data before standard econometric methods can be justified. In addition, modifications and embellishments to standard econometric techniques have been developed toaccount for and exploit the dependent nature of economic time series and to addressother issues, such as the fact that some economic variables tend to display clear trendsover time.Another feature of time series data that can require special attention is the data frequency at which the data are collected. In economics, the most common frequenciesare daily, weekly, monthly, quarterly, and annually. Stock prices are recorded at dailyintervals (excluding Saturday and Sunday). The money supply in the U.S. economy isreported weekly. Many macroeconomic series are tabulated monthly, including inflation and employment rates. Other macro series are recorded less frequently, such asevery three months (every quarter). Gross domestic product is an important example ofa quarterly series. Other time series, such as infant mortality rates for states in theUnited States, are available only on an annual basis.Many weekly, monthly, and quarterly economic time series display a strongseasonal pattern, which can be an important factor in a time series analysis. For example, monthly data on housing starts differs across the months simply due to changingweather conditions. We will learn how to deal with seasonal time series in Chapter 10.Table 1.3 contains a time series data set obtained from an article by CastilloFreeman and Freeman (1992) on minimum wage effects in Puerto Rico. The earliestyear in the data set is the first observation, and the most recent year available is the lastTable 1.3Minimum Wage, Unemployment, and Related Data for Puerto 878.7219510.2120.716.0925.0319520.2322.614.81015.9 3719863.3558.118.94281.63819873.3558.216.84496.79
14/99 4:34 PMPage 10Chapter 1The Nature of Econometrics and Economic Dataobservation. When econometric methods are used to analyze time series data, the datashould be stored in chronological order.The variable avgmin refers to the average minimum wage for the year, avgcov isthe average coverage rate (the percentage of workers covered by the minimum wagelaw), unemp is the unemployment rate, and gnp is the gross national product. We willuse these data later in a time series analysis of the effect of the minimum wage onemployment.Pooled Cross SectionsSome data sets have both cross-sectional and time series features. For example, supposethat two cross-sectional household surveys are taken in the United States, one in 1985and one in 1990. In 1985, a random sample of households is surveyed for variables suchas income, savings, family size, and so on. In 1990, a new random sample of householdsis taken using the same survey questions. In order to increase our sample size, we canform a pooled cross section by combining the two years. Because random samples aretaken in each year, it would be a fluke if the same household appeared in the sampleduring both years. (The size of the sample is usually very small compared with the number of households in the United States.) This important factor distinguishes a pooledcross section from a panel data set.Pooling cross sections from different years is often an effective way of analyzingthe effects of a new government policy. The idea is to collect data from the years beforeand after a key policy change. As an example, consider the following data set on housing prices taken in 1993 and 1995, when there was a reduction in property taxes in1994. Suppose we have data on 250 houses for 1993 and on 270 houses for 1995. Oneway to store such a data set is given in Table 1.4.Observations 1 through 250 correspond to the houses sold in 1993, and observations251 through 520 correspond to the 270 houses sold in 1995. While the order in whichwe store the data turns out not to be crucial, keeping track of the year for each observation is usually very important. This is why we enter year as a separate variable.A pooled cross section is analyzed much like a standard cross section, except thatwe often need to account for secular differences in the variables across the time. In fact,in addition to increasing the sample size, the point of a pooled cross-sectional analysisis often to see how a key relationship has changed over time.Panel or Longitudinal DataA panel data (or longitudinal data) set consists of a time series for each crosssectional member in the data set. As an example, suppose we have wage, education, andemployment history for a set of individuals followed over a ten-year period. Or wemight collect information, such as investment and financial data, about the same set offirms over a five-year time period. Panel data can also be collected on geographicalunits. For example, we can collect data for the same set of counties in the United Stateson immigration flows, tax rates, wage rates, government expenditures, etc., for the years1980, 1985, and 1990.The key feature of panel data that distinguishes it from a pooled cross section is thefact that the same cross-sectional units (individuals, firms, or counties in the above10
d7/14/99 4:34 PMPage 11Chapter 1The Nature of Econometrics and Economic DataTable 1.4Pooled Cross Sections: Two Years of Housing 042.5 9518240020220042.025319959750015154032.0 52019955720016110021.5examples) are followed over a given time period. The data in Table 1.4 are not considered a panel data set because the houses sold are likely to be different in 1993 and 1995;if there are any duplicates, the number is likely to be so small as to be unimportant. Incontrast, Table 1.5 contains a two-year panel data set on crime and related statistics for150 cities in the United States.There are several interesting features in Table 1.5. First, each city has been given anumber from 1 through 150. Which city we decide to call city 1, city 2, and so on, isirrelevant. As with a pure cross section, the ordering in the cross section of a panel dataset does not matter. We could use the city name in place of a number, but it is often useful to have both.11
14/99 4:34 PMPage 12Chapter 1The Nature of Econometrics and Economic DataTable 1.5A Two-Year Panel Data Set on City Crime 5.4754219901651005.575 1501986255430004.35203001501990325462005.2493A second useful point is that the two years of data for city 1 fill the first two rowsor observations. Observations 3 and 4 correspond to city 2, and so on. Since each of the150 cities has two rows of data, any econometrics package will view this as 300 observations. This data set can be treated as two pooled cross sections, where the same citieshappen to show up in the same year. But, as we will see in Chapters 13 and 14, we canalso use the panel structure to respond to questions that cannot be answered by simplyviewing this as a pooled cross section.In organizing the observations in Table 1.5, we place the two years of data for eachcity adjacent to one another, with the first year coming before the second in all cases.For just about every practical purpose, this is the preferred way for ordering panel datasets. Contrast this organization with the way the pooled cross sections are stored inTable 1.4. In short, the reason for ordering panel data as in Table 1.5 is that we will needto perform data transformations for each city across the two years.Because panel data require replication of the same units over time, panel data sets,especially those on individuals, households, and firms, are more difficult to obtain thanpooled cross sections. Not surprisingly, observing the same units over time leads to sev12
d7/14/99 4:34 PMPage 13Chapter 1The Nature of Econometrics and Economic Dataeral advantages over c
hapter 1 discusses the scope of econometrics and raises general issues that result from the application of econometric methods. Section 1.3 examines the kinds of data sets that are used in business, economics, and other social sciences. Section 1.4 provides an intuitive discussion of the difficulties associated with the inference of