Transcription
Introductionto EconometricsA01 STOC1991 04 SE FM ppi-xlii.indd 122/08/18 3:13 PM
The Pearson Series in moglu/Laibson/ListEconomics*Bade/ParkinFoundations of Economics*Berck/HelfandThe Economics of the EnvironmentBierman/FernandezGame Theory with EconomicApplicationsBlair/RushThe Economics of Managerial Decisions*BlanchardMacroeconomics*BoyerPrinciples of Transportation EconomicsBransonMacroeconomic Theory and PolicyBrucePublic Finance and the AmericanEconomyCarlton/PerloffModern Industrial OrganizationCase/Fair/OsterPrinciples of Economics*ChapmanEnvironmental Economics: Theory,Application, and PolicyDaniels/VanHooseInternational Monetary & FinancialEconomicsDownsAn Economic Theory of DemocracyFarnhamEconomics for ManagersFroyenMacroeconomics: Theories and PoliciesFusfeldThe Age of the EconomistGerberInternational Economics*GordonMacroeconomics*GreeneEconometric AnalysisGregory/StuartRussian and Soviet EconomicPerformance and StructureHartwick/OlewilerThe Economics of Natural Resource UseHeilbroner/MilbergThe Making of the Economic SocietyHeyne/Boettke/PrychitkoThe Economic Way of ThinkingHubbard/O’BrienEconomics*InEconMoney, Banking, and the nomics*Hughes/CainAmerican Economic HistoryHusted/MelvinInternational EconomicsJehle/RenyAdvanced Microeconomic TheoryKeat/Young/ErfleManagerial EconomicsKleinMathematical Methods for EconomicsKrugman/Obstfeld/MelitzInternational Economics: Theory & Policy*LaidlerThe Demand for MoneyLynnEconomic Development: Theory andPractice for a Divided WorldMillerEconomics Today*Miller/BenjaminThe Economics of Macro IssuesMiller/Benjamin/NorthThe Economics of Public IssuesMishkinThe Economics of Money, Banking, andFinancial Markets*MurrayEconometrics: A Modern IntroductionO’Sullivan/Sheffrin/PerezEconomics: Principles, Applications roeconomics: Theory and Applicationswith Calculus*Perloff/BranderManagerial Economics and hackelford/Stamos/SchneiderEconomics: A Tool for CriticallyUnderstanding SocietyRobertsThe Choice: A Fable of Free Trade andProtectionSchererIndustry Structure, Strategy, and PublicPolicySchillerThe Economics of Poverty andDiscriminationShermanMarket RegulationStock/WatsonIntroduction to EconometricsStudenmundUsing Econometrics: A Practical GuideTodaro/SmithEconomic /Maex/O’NeillEconversations: Today’s Students DiscussToday’s IssuesWilliamsonMacroeconomicsThe Economics of Money, Banking, andFinancial Markets, Business School Edition*Macroeconomics: Policy and Practice**denotes MyLab Economics titles. Visit www.pearson.com/mylab/economics to learn more.A01 STOC1991 04 SE FM ppi-xlii.indd 222/08/18 3:13 PM
Introductionto EconometricsF O U R T HE D I T I O NJames H. StockHarvard UniversityMark W. WatsonPrinceton UniversityNew York, NYA01 STOC1991 04 SE FM ppi-xlii.indd 322/08/18 3:13 PM
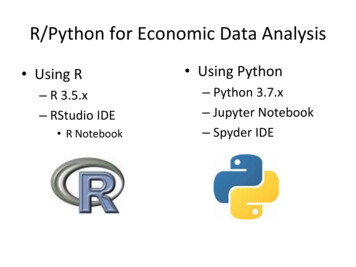
Vice President, Business, Economics, and UK Courseware:Donna BattistaDirector of Portfolio Management: Adrienne D’AmbrosioSpecialist Portfolio Manager: David AlexanderEditorial Assistant: Nicole NedwidekVice President, Product Marketing: Roxanne McCarleyProduct Marketing Assistant: Marianela SilvestriManager of Field Marketing, Business Publishing:Adam GoldsteinExecutive Field Marketing Manager: Carlie MarvelVice President, Production and Digital Studio,Arts and Business: Etain O’DeaDirector, Production and Digital Studio, Businessand Economics: Ashley SantoraManaging Producer, Business: Alison KalilContent Producer: Christine DonovanOperations Specialist: Carol MelvilleDesign Lead: Kathryn FootManager, Learning Tools: Brian SuretteSenior Learning Tools Strategist: Emily BibergerManaging Producer, Digital Studio and GLP: James BatemanManaging Producer, Digital Studio: Diane LombardoDigital Studio Producer: Melissa HonigDigital Studio Producer: Alana ColesDigital Content Team Lead: Noel LotzDigital Content Project Lead: Noel LotzProject Manager: Rose Kernan, Cenveo Publisher ServicesInterior Design: Cenveo Publisher ServicesCover Design: Studio MontageCover Art: Courtsey of authorsPrinter/Binder: LSC Communications, Inc./KendallvilleCover Printer: Phoenix Color/Terre HauteAbout the cover: The cover shows a time series plot of 72 indicators of real economic activity in the United States beginningin 1959. The plot shows the growth of these variables since 1959 and their (roughly) synchronized downturns associatedwith recessions. These series are a subset of the 131-variable dataset used in Chapter 17 to construct dynamic factor modelforecasts of future growth in real GDP.Copyright 2019, 2015, 2011 by Pearson Education, Inc. or its affiliates. All Rights Reserved. Manufactured in theUnited States of America. This publication is protected by copyright, and permission should be obtained from thepublisher prior to any prohibited reproduction, storage in a retrieval system, or transmission in any form or by anymeans, electronic, mechanical, photocopying, recording, or otherwise. For information regarding permissions, requestforms, and the appropriate contacts within the Pearson Education Global Rights and Permissions department, please s of third-party content appear on the appropriate page within the text.PEARSON, ALWAYS LEARNING, and MYLAB are exclusive trademarks owned by Pearson Education, Inc. or itsaffiliates in the U.S. and/or other countries.Unless otherwise indicated herein, any third-party trademarks, logos, or icons that may appear in this work are theproperty of their respective owners, and any references to third-party trademarks, logos, icons, or other trade dress arefor demonstrative or descriptive purposes only. Such references are not intended to imply any sponsorship, endorsement,authorization, or promotion of Pearson’s products by the owners of such marks, or any relationship between the owner andPearson Education, Inc., or its affiliates, authors, licensees, or distributors.Library of Congress Cataloging-in-Publication DataNames: Stock, James H., author. Watson, Mark W., author.Title: Introduction to econometrics / James H. Stock, Harvard University,Mark W. Watson, Princeton University.Description: Fourth edition. New York, NY : Pearson, [2019] Series:The Pearson series in economics Includes bibliographical references and index.Identifiers: LCCN 2018035117 ISBN 9780134461991Subjects: LCSH: Econometrics.Classification: LCC HB139 .S765 2019 DDC 330.01/5195—dc23LC record available at https://lccn.loc.gov/2018035117ISBN-10: 0-13-446199-1ISBN-13: 978-0-13-446199-1A01 STOC1991 04 SE FM ppi-xlii.indd 422/08/18 3:13 PM
Brief ContentsPART ONEIntroduction and ReviewChapter 1Chapter 2Chapter 3Economic Questions and DataReview of Probability 13Review of Statistics 61PART TWOFundamentals of Regression AnalysisChapter 4Chapter 5Chapter 6Chapter 7Chapter 8Chapter 9Linear Regression with One Regressor 101Regression with a Single Regressor: Hypothesis Testsand Confidence Intervals 136Linear Regression with Multiple Regressors 169Hypothesis Tests and Confidence Intervals in Multiple RegressionNonlinear Regression Functions 235Assessing Studies Based on Multiple Regression 288PART THREEFurther Topics in Regression AnalysisChapter 10Chapter 11Chapter 12Chapter 13Chapter 14Regression with Panel Data 319Regression with a Binary Dependent Variable 350Instrumental Variables Regression 385Experiments and Quasi-Experiments 432Prediction with Many Regressors and Big Data 472PART FOURRegression Analysis of Economic Time Series DataChapter 15Chapter 16Chapter 17Introduction to Time Series Regression and ForecastingEstimation of Dynamic Causal Effects 567Additional Topics in Time Series Regression 607PART FIVERegression Analysis of Economic Time Series DataChapter 18Chapter 19The Theory of Linear Regression with One RegressorThe Theory of Multiple Regression 6711205512645vA01 STOC1991 04 SE FM ppi-xlii.indd 522/08/18 3:13 PM
A01 STOC1991 04 SE FM ppi-xlii.indd 622/08/18 3:13 PM
ContentsPrefacexxviiPART ONEIntroduction and ReviewCHAPTER 1Economic Questions and Data1.11Economic Questions We Examine1Question #1: Does Reducing Class Size Improve Elementary School Education?Question #2: Is There Racial Discrimination in the Market for Home Loans? 2Question #3: How Much Do Cigarette Taxes Reduce Smoking? 3Question #4: By How Much Will U.S. GDP Grow Next Year? 4Quantitative Questions, Quantitative Answers 41.2Causal Effects and Idealized ExperimentsEstimation of Causal Effects 5Prediction, Forecasting, and Causality1.3Data: Sources and Types2.1Review of Probability566Experimental versus Observational DataCross-Sectional Data 7Time Series Data 8Panel Data 9CHAPTER 21713Random Variables and Probability Distributions14Probabilities, the Sample Space, and Random Variables 14Probability Distribution of a Discrete Random Variable 14Probability Distribution of a Continuous Random Variable 162.2Expected Values, Mean, and Variance18The Expected Value of a Random Variable 18The Standard Deviation and Variance 19Mean and Variance of a Linear Function of a Random VariableOther Measures of the Shape of a Distribution 21Standardized Random Variables 232.3Two Random Variables2023Joint and Marginal Distributions 23Conditional Distributions 24Independence 28Covariance and Correlation 28The Mean and Variance of Sums of Random Variables29viiA01 STOC1991 04 SE FM ppi-xlii.indd 722/08/18 3:13 PM
viiiContents2.4The Normal, Chi-Squared, Student t, and F Distributions33The Normal Distribution 33The Chi-Squared Distribution 38The Student t Distribution 38The F Distribution 382.5Random Sampling and the Distribution of the Sample AverageRandom Sampling 39The Sampling Distribution of the Sample Average2.640Large-Sample Approximations to Sampling DistributionsThe Law of Large Numbers and ConsistencyThe Central Limit Theorem 44394343Derivation of Results in Key Concept 2.3 58APPENDIX 2.2 The Conditional Mean as the Minimum MeanSquared Error Predictor 59APPENDIX 2.1CHAPTER 33.1Review of Statistics 61Estimation of the Population MeanEstimators and Their Properties 62Properties of Y 64The Importance of Random Sampling3.26265Hypothesis Tests Concerning the Population Mean66Null and Alternative Hypotheses 67The p-Value 67Calculating the p-Value When sY Is Known 68The Sample Variance, Sample Standard Deviation, and Standard ErrorCalculating the p-Value When sY Is Unknown 71The t-Statistic 71Hypothesis Testing with a Prespecified Significance Level 72One-Sided Alternatives 743.3Confidence Intervals for the Population Mean753.4Comparing Means from Different Populations77Hypothesis Tests for the Difference Between Two Means 77Confidence Intervals for the Difference Between Two Population Means3.56978Differences-of-Means Estimation of Causal Effects UsingExperimental Data 79The Causal Effect as a Difference of Conditional Expectations 79Estimation of the Causal Effect Using Differences of Means 793.6Using the t-Statistic When the Sample Size Is Small81The t-Statistic and the Student t Distribution 83Use of the Student t Distribution in Practice 84A01 STOC1991 04 SE FM ppi-xlii.indd 822/08/18 3:13 PM
ixContents3.7Scatterplots, the Sample Covariance, and the Sample CorrelationScatterplots 85Sample Covariance and Correlation8585The U.S. Current Population Survey 99Two Proofs That Y Is the Least Squares Estimator of μYAPPENDIX 3.3 A Proof That the Sample Variance Is Consistent 100APPENDIX 3.1APPENDIX 3.2PART TWOFundamentals of Regression AnalysisCHAPTER 4Linear Regression with One Regressor991014.1The Linear Regression Model1024.2Estimating the Coefficients of the Linear Regression Model105The Ordinary Least Squares Estimator 106OLS Estimates of the Relationship Between Test Scores and theStudent–Teacher Ratio 107Why Use the OLS Estimator? 1094.3Measures of Fit and Prediction Accuracy1112The R 111The Standard Error of the Regression 112Prediction Using OLS 113Application to the Test Score Data 1134.4The Least Squares Assumptions for Causal Inference114Assumption 1: The Conditional Distribution of ui Given Xi Has a Mean of Zero 115Assumption 2: (Xi, Yi), i 1, . . . , n, Are Independently and Identically Distributed 116Assumption 3: Large Outliers Are Unlikely 117Use of the Least Squares Assumptions 1184.5The Sampling Distribution of the OLS Estimators4.6Conclusion119122The California Test Score Data Set 130APPENDIX 4.2 Derivation of the OLS Estimators 130APPENDIX 4.3 Sampling Distribution of the OLS Estimator 131APPENDIX 4.4 The Least Squares Assumptions for Prediction 134APPENDIX 4.1CHAPTER 55.1Regression with a Single Regressor:Hypothesis Tests and Confidence Intervals136Testing Hypotheses About One of the Regression Coefficients136Two-Sided Hypotheses Concerning ß1 137One-Sided Hypotheses Concerning ß1 140Testing Hypotheses About the Intercept ß0 1425.2A01 STOC1991 04 SE FM ppi-xlii.indd 9Confidence Intervals for a Regression Coefficient14222/08/18 3:13 PM
xContents5.3Regression When X Is a Binary VariableInterpretation of the Regression Coefficients5.4144144Heteroskedasticity and Homoskedasticity146What Are Heteroskedasticity and Homoskedasticity? 146Mathematical Implications of Homoskedasticity 148What Does This Mean in Practice? 1505.5The Theoretical Foundations of Ordinary Least Squares152Linear Conditionally Unbiased Estimators and the Gauss–Markov TheoremRegression Estimators Other Than OLS 1535.6152Using the t-Statistic in Regression When the Sample Size Is Small154The t-Statistic and the Student t Distribution 154Use of the Student t Distribution in Practice 1555.7Conclusion155Formulas for OLS Standard Errors 164APPENDIX 5.2 The Gauss–Markov Conditions and a Proof of theGauss–Markov Theorem 165APPENDIX 5.1CHAPTER 66.1Linear Regression with Multiple RegressorsOmitted Variable Bias169169Definition of Omitted Variable Bias 170A Formula for Omitted Variable Bias 172Addressing Omitted Variable Bias by Dividing the Data into Groups6.2The Multiple Regression Model175The Population Regression Line 175The Population Multiple Regression Model6.3176The OLS Estimator in Multiple Regression177The OLS Estimator 178Application to Test Scores and the Student–Teacher Ratio6.4Measures of Fit in Multiple RegressionThe Standard Error of the Regression (SER)The R2 181The Adjusted R2 181Application to Test Scores 1826.5173179180180The Least Squares Assumptions for Causal Inference in MultipleRegression 183Assumption 1: The Conditional Distribution of ui Given X1i, X2i, . . . , Xki Has aMean of 0 183Assumption 2: (X1i, X2i, . . . , Xki, Yi), i 1, . . . , n, Are i.i.d. 183Assumption 3: Large Outliers Are Unlikely 183Assumption 4: No Perfect Multicollinearity 184A01 STOC1991 04 SE FM ppi-xlii.indd 1022/08/18 3:13 PM
Contents6.6The Distribution of the OLS Estimators in Multiple Regression6.7MulticollinearityImperfect Multicollinearity186188Control Variables and Conditional Mean IndependenceControl Variables and Conditional Mean Independence6.9Conclusion185186Examples of Perfect Multicollinearity6.8xi189190192Derivation of Equation (6.1) 200Distribution of the OLS Estimators When There AreTwo Regressors and Homoskedastic Errors 201APPENDIX 6.3 The Frisch–Waugh Theorem 201APPENDIX 6.4 The Least Squares Assumptions for Prediction withMultiple Regressors 202APPENDIX 6.5 Distribution of OLS Estimators in Multiple Regressionwith Control Variables 203APPENDIX 6.1APPENDIX 6.2CHAPTER 77.1Hypothesis Tests and Confidence Intervalsin Multiple Regression 205Hypothesis Tests and Confidence Intervals for a SingleCoefficient 205Standard Errors for the OLS Estimators205Hypothesis Tests for a Single Coefficient206Confidence Intervals for a Single Coefficient207Application to Test Scores and the Student–Teacher Ratio7.2Tests of Joint Hypotheses209Testing Hypotheses on Two or More CoefficientsThe F-Statistic207210211Application to Test Scores and the Student–Teacher RatioThe Homoskedasticity-Only F-Statistic2132147.3Testing Single Restrictions Involving Multiple Coefficients7.4Confidence Sets for Multiple Coefficients7.5Model Specification for Multiple RegressionModel Specification and Choosing Control Variables22Interpreting the R and the Adjusted R in Practice7.6Analysis of the Test Score Data Set7.7ConclusionAPPENDIX 7.1216217218219220220226The Bonferroni Test of a Joint Hypothesis232xiA01 STOC1991 04 SE FM ppi-xlii.indd 1122/08/18 3:13 PM
xiiContentsCHAPTER 88.1Nonlinear Regression Functions235A General Strategy for Modeling Nonlinear Regression FunctionsTest Scores and District Income 237The Effect on Y of a Change in X in Nonlinear Specifications 240A General Approach to Modeling Nonlinearities Using Multiple Regression8.2Nonlinear Functions of a Single Independent VariableInteractions Between Independent VariablesInteractions Between Two Binary Variables 256Interactions Between a Continuous and a Binary VariableInteractions Between Two Continuous Variables 2638.48.5254255258Nonlinear Effects on Test Scores of the Student–Teacher RatioDiscussion of Regression ResultsSummary of Findings 272Conclusion243244Polynomials 244Logarithms 246Polynomial and Logarithmic Models of Test Scores and District Income8.3237268268273Regression Functions That Are Nonlinear in the Parameters 283APPENDIX 8.2 Slopes and Elasticities for Nonlinear Regression Functions 286APPENDIX 8.1CHAPTER 99.1Assessing Studies Based on Multiple RegressionInternal and External Validity288288Threats to Internal Validity 289Threats to External Validity 2909.2Threats to Internal Validity of Multiple Regression AnalysisOmitted Variable Bias 292Misspecification of the Functional Form of the Regression FunctionMeasurement Error and Errors-in-Variables Bias 294Missing Data and Sample Selection 297Simultaneous Causality 299Sources of Inconsistency of OLS Standard Errors 3012949.3Internal and External Validity When the Regression Is Usedfor Prediction 3029.4Example: Test Scores and Class SizeExternal Validity 304Internal Validity 310Discussion and Implications9.5ConclusionAPPENDIX 9.1A01 STOC1991 04 SE FM ppi-xlii.indd 12291303311312The Massachusetts Elementary School Testing Data31822/08/18 3:13 PM
xiiiContentsPART THREEFurther Topics in Regression AnalysisCHAPTER 10Regression with Panel Data10.1Panel Data319320Example: Traffic Deaths and Alcohol Taxes32010.2Panel Data with Two Time Periods: “Before and After” Comparisons10.3Fixed Effects Regression325The Fixed Effects Regression ModelEstimation and Inference 327Application to Traffic Deaths 32810.4325Regression with Time Fixed EffectsTime Effects Only 329Both Entity and Time Fixed Effects10.5323329330The Fixed Effects Regression Assumptions and Standard Errors for FixedEffects Regression 332The Fixed Effects Regression Assumptions 332Standard Errors for Fixed Effects Regression 33410.6Drunk Driving Laws and Traffic Deaths10.7Conclusion335339The State Traffic Fatality Data Set 345APPENDIX 10.2 Standard Errors for Fixed Effects RegressionAPPENDIX 10.1CHAPTER 1111.1Regression with a Binary Dependent Variable346350Binary Dependent Variables and the Linear Probability Model351Binary Dependent Variables 351The Linear Probability Model 35311.2Probit and Logit Regression355Probit Regression 355Logit Regression 359Comparing the Linear Probability, Probit, and Logit Models11.3361Estimation and Inference in the Logit and Probit Models362Nonlinear Least Squares Estimation 362Maximum Likelihood Estimation 363Measures of Fit 36411.4Application to the Boston HMDA Data11.5Conclusion365371The Boston HMDA Data Set 379Maximum Likelihood Estimation 379APPENDIX 11.3 Other Limited Dependent Variable ModelsAPPENDIX 11.1APPENDIX 11.2A01 STOC1991 04 SE FM ppi-xlii.indd 1338222/08/18 3:13 PM
xivContentsCHAPTER 1212.1Instrumental Variables RegressionThe IV Estimator with a Single Regressor and a Single InstrumentThe IV Model and Assumptions 386The Two Stage Least Squares Estimator 387Why Does IV Regression Work? 387The Sampling Distribution of the TSLS EstimatorApplication to the Demand for Cigarettes 39312.2385The General IV Regression Model386392395TSLS in the General IV Model 397Instrument Relevance and Exogeneity in the General IV Model 398The IV Regression Assumptions and Sampling Distribution of the TSLS EstimatorInference Using the TSLS Estimator 400Application to the Demand for Cigarettes 40112.3Checking Instrument Validity399402Assumption 1: Instrument Relevance 402Assumption 2: Instrument Exogeneity 40412.4Application to the Demand for Cigarettes40812.5Where Do Valid Instruments Come From?412Three Examples12.6Conclusion413417The Cigarette Consumption Panel Data Set 424APPENDIX 12.2 Derivation of the Formula for the TSLS Estimatorin Equation (12.4) 424APPENDIX 12.3 Large-Sample Distribution of the TSLS Estimator 425APPENDIX 12.4 Large-Sample Distribution of the TSLS EstimatorWhen the Instrument Is Not Valid 426APPENDIX 12.5 Instrumental Variables Analysis with Weak InstrumentsAPPENDIX 12.6 TSLS with Control Variables 429APPENDIX 12.1CHAPTER 1313.1Experiments and Quasi-Experiments427432Potential Outcomes, Causal Effects, and Idealized Experiments433Potential Outcomes and the Average Causal Effect 433Econometric Methods for Analyzing Experimental Data 43413.2Threats to Validity of Experiments436Threats to Internal Validity 436Threats to External Validity 43913.3Experimental Estimates of the Effect of Class Size Reductions440Experimental Design 440Analysis of the STAR Data 441Comparison of the Observational and Experimental Estimates of Class Size EffectsA01 STOC1991 04 SE FM ppi-xlii.indd 1444622/08/18 3:13 PM
Contents13.4Quasi-Experimentsxv448Examples 448The Differences-in-Differences Estimator 450Instrumental Variables Estimators 452Regression Discontinuity Estimators 45313.5Potential Problems with Quasi-Experiments454Threats to Internal Validity 454Threats to External Validity 45613.6Experimental and Quasi-Experimental Estimates in HeterogeneousPopulations 456OLS with Heterogeneous Causal Effects 457IV Regression with Heterogeneous Causal Effects13.7Conclusion458461The Project STAR Data Set 468APPENDIX 13.2 IV Estimation When the Causal Effect Varies AcrossIndividuals 469APPENDIX 13.3 The Potential Outcomes Framework for AnalyzingData from Experiments 470APPENDIX 13.1CHAPTER 14Prediction with Many Regressors and Big Data14.1What Is “Big Data”?14.2The Many-Predictor Problem and OLS472473The Mean Squared Prediction Error474476The First Least Squares Assumption for Prediction477The Predictive Regression Model with Standardized RegressorsThe MSPE of OLS and the Principle of ShrinkageEstimation of the MSPE14.3Ridge Regression479480482Shrinkage via Penalization and Ridge Regression482Estimation of the Ridge Shrinkage Parameter by Cross ValidationApplication to School Test Scores14.4The Lasso486Application to School Test ScoresPrincipal Components489490Principals Components with Two VariablesPrincipal Components with k VariablesApplication to School Test Scores14.6A01 STOC1991 04 SE FM ppi-xlii.indd 15483484485Shrinkage Using the Lasso14.5477490492494Predicting School Test Scores with Many Predictors49522/08/18 3:13 PM
xviContents14.7Conclusion500The California School Test Score Data Set 509APPENDIX 14.2 Derivation of Equation (14.4) for k 1 509APPENDIX 14.3 The Ridge Regression Estimator When k 1 509APPENDIX 14.4 The Lasso Estimator When k 1 510APPENDIX 14.5 Computing Out-of-Sample Predictions in the StandardizedRegression Model 510APPENDIX 14.1PART FOURRegression Analysis of Economic Time Series DataCHAPTER 15Introduction to Time Series Regression and Forecasting15.1Introduction to Time Series Data and Serial CorrelationReal GDP in the United States 513Lags, First Differences, Logarithms, and Growth RatesAutocorrelation 516Other Examples of Economic Time Series 51815.2512513513Stationarity and the Mean Squared Forecast Error519Stationarity 519Forecasts and Forecast Errors 520The Mean Squared Forecast Error 52115.3Autoregressions523The First-Order Autoregressive Model 523The pth-Order Autoregressive Model 52515.4Time Series Regression with Additional Predictors and theAutoregressive Distributed Lag Model 526Forecasting GDP Growth Using the Term Spread 527The Autoregressive Distributed Lag Model 528The Least Squares Assumptions for Forecasting with Multiple Predictors15.5Estimation of the MSFE and Forecast IntervalsEstimation of the MSFE 531Forecast Uncertainty and Forecast Intervals15.6531534Estimating the Lag Length Using Information Criteria536Determining the Order of an Autoregression 536Lag Length Selection in Time Series Regression with Multiple Predictors15.7Nonstationarity I: Trends529539540What Is a Trend? 540Problems Caused by Stochastic Trends 542Detecting Stochastic Trends: Testing for a Unit AR Root 544Avoiding the Problems Caused by Stochastic Trends 546A01 STOC1991 04 SE FM ppi-xlii.indd 1622/08/18 3:13 PM
xviiContents15.8Nonstationarity II: Breaks547What Is a Break? 547Testing for Breaks 547Detecting Breaks Using Pseudo Out-of-Sample ForecastsAvoiding the Problems Caused by Breaks 55315.9Conclusion554APPENDIX 15.1Time Series Data Used in Chapter 15 562Stationarity in the AR(1) Model 563Lag Operator Notation 564ARMA Models 565Consistency of the BIC Lag Length EstimatorAPPENDIX 15.2APPENDIX 15.3APPENDIX 15.4APPENDIX 15.5Estimation of Dynamic Causal Effects56716.1An Initial Taste of the Orange Juice Data56816.2Dynamic Causal EffectsCHAPTER 16570Estimation of Dynamic Causal Effects with Exogenous RegressorsThe Distributed Lag Model Assumptions 575Autocorrelated ut, Standard Errors, and Inference 576Dynamic Multipliers and Cumulative Dynamic Multipliers16.4Heteroskedasticity- and Autocorrelation-Consistent Standard Errors578578Estimation of Dynamic Causal Effects with Strictly ExogenousRegressors 582The Distributed Lag Model with AR(1) ErrorsOLS Estimation of the ADL Model 585GLS Estimation 58658316.6Orange Juice Prices and Cold Weather16.7Is Exogeneity Plausible? Some ExamplesU.S. Income and Australian Exports 595Oil Prices and Inflation 595Monetary Policy and Inflation 596The Growth Rate of GDP and the Term Spread16.8575576Distribution of the OLS Estimator with Autocorrelated ErrorsHAC Standard Errors 57916.5565570Causal Effects and Time Series DataTwo Types of Exogeneity 57316.3552Conclusion588595596597The Orange Juice Data Set 604APPENDIX 16.2 The ADL Model and Generalized Least Squares in LagOperator Notation 605APPENDIX 16.1A01 STOC1991 04 SE FM ppi-xlii.indd 1722/08/18 3:13 PM
xviiiContentsCHAPTER 1717.1Additional Topics in Time Series RegressionVector Autoregressions607607The VAR Model 608A VAR Model of the Growth Rate of GDP and the Term Spread17.2Multi-period Forecasts611612Iterated Multi-period Forecasts 612Direct Multi-period Forecasts 614Which Method Should You Use? 61617.3Orders of Integration and the Nonnormality of Unit RootTest Statistics 616Other Models of Trends and Orders of Integration 617Why Do Unit Root Tests Have Nonnormal Distributions?17.4Cointegration619621Cointegration and Error Correction 621How Can You Tell Whether Two Variables Are Cointegrated?Estimation of Cointegrating Coefficients 623Extension to Multiple Cointegrated Variables 62417.5Volatility Clustering and Autoregressive ConditionalHeteroskedasticity 625Volatility Clustering 625Realized Volatility 626Autoregressive Conditional HeteroskedasticityApplication to Stock Price Volatility 62817.6622627Forecasting with Many Predictors Using Dynamic Factor Modelsand Principal Components 629The Dynamic Factor Model 630The DFM: Estimation and Forecasting 631Application to U.S. Macroeconomic Data 63417.7Conclusion640APPENDIX 17.1The Quarterly U.S. Macro Data Set644PART FIVERegression Analysis of Economic Time Series Data CHAPTER 18The Theory of Linear Regression with One Regressor18.1The Extended Least Squares Assumptions and the OLS EstimatorThe Extended Least Squares AssumptionsThe OLS Estimator 64718.2645646646Fundamentals of Asymptotic Distribution Theory648Convergence in Probability and the Law of Large Numbers 648The Central Limit Theorem and Convergence in Distribution 650A01 STOC1991 04 SE FM ppi-xlii.indd 1822/08/18 3:13 PM
ContentsxixSlutsky’s Theorem and the Continuous Mapping Theorem 651Application to the t-Statistic Based on the Sample Mean 65218.3Asymptotic Distribution of the OLS Estimator and t-Statistic653Consistency and Asymptotic Normality of the OLS Estimators 653Consistency of Heteroskedasticity-Robust Standard Errors 653Asymptotic Normality of the Heteroskedasticity-Robust t-Statistic 65418.4Exact Sampling Distributions When the Errors Are NormallyDistributed 655Distribution of bn 1 with Normal Errors 655Distribution of the Homoskedasticity-Only t-Statistic18.5Weighted Least Squares656657WLS with Known Heteroskedasticity 658WLS with Heteroskedasticity of Known Functional Form 659Heteroskedasticity-Robust Standard Errors or WLS? 661The Normal and Related Distributions and Momentsof Continuous Random Variables 667APPENDIX 18.2 Two Inequalities 669APPENDIX 18.1CHAPTER 1919.1The Theory of Multiple Regression671The Linear Multiple Regression Model and OLS Estimator inMatrix Form 672The Multiple Regression Model in Matrix NotationThe Extended Least Squares Assumptions 673The OLS Estimator 67419.2672Asymptotic Distribution of the OLS Estimator and t-Statistic675The Multivariate Central Limit Theorem 676Asymptotic Normality of bn 676Heteroskedasticity-Robust Standard Errors 677Confidence Intervals for Predicted Effects 678Asymptotic Distribution of the t-Statistic 67819.3Tests of Joint Hypotheses679Joint Hypotheses in Matrix Notation 679Asymptotic Distribution of the F-Statistic 679Confidence Sets for Multiple Coefficients 68019.4Distribution of Regression Statistics with Normal Errors680Matrix Representations of OLS Regression Statistics 681Distribution of bn with Independent Normal Errors 682Distribution
Introduction to Econometrics James H. Stock Harvard University Mark W. Watson Princeton University FOURTH EDITION New