Transcription
Answers to SelectedExercisesForPrinciples of Econometrics, Fourth EditionR. CARTER HILLLouisiana State UniversityWILLIAM E. GRIFFITHSUniversity of MelbourneGUAY C. LIMUniversity of MelbourneJOHN WILEY & SONS, INCNew York / Chichester / Weinheim / Brisbane / Singapore / Toronto
CONTENTSAnswers for Selected Exercises in:Probability Primer1Chapter 2The Simple Linear Regression Model3Chapter 3Interval Estimation and Hypothesis Testing12Chapter 4Prediction, Goodness of Fit and Modeling Issues16Chapter 5The Multiple Regression Model22Chapter 6Further Inference in the Multiple Regression Model29Chapter 7Using Indicator Variables36Chapter 8Heteroskedasticity44Chapter 9Regression with Time Series Data: Stationary Variables51Chapter 10Random Regressors and Moment Based Estimation58Chapter 11Simultaneous Equations Models60Chapter 15Panel Data Models64Chapter 16Qualitative and Limited Dependent Variable Models66Appendix AMathematical Tools69Appendix BProbability Concepts72Appendix CReview of Statistical Inference7629 August, 2011
PROBABILITY PRIMERExercise AnswersEXERCISE P.1(a)X is a random variable because attendance is not known prior to the outdoor concert.(b)1100(c)3500(d)6,000,000EXERCISE P.30.0478EXERCISE P.5(a)0.5.(b)0.25EXERCISE P.7(a)f (c )0.150.400.45(b)1.3(c)0.51(d)f (0,0) 0.05 f C (0) f B (0) 0.15 0.15 0.02251
Probability Primer, Exercise Answers, Principles of Econometrics, 4e(e)(f)Af (a)5000600070000.150.500.351.0EXERCISE RCISE P.13(a)0.1056(b)0.0062(c)(a) 0.1587 (b) 0.1265EXERCISE P.15(a)9(b)1.5(c)0(d)109(e) 66(f) 0.6055EXERCISE P.17(a)4a b( x1 x2 x3 x4 )(b)14(c)34(d)f (4) f (5) f (6)(e)f (0, y ) f (1, y ) f (2, y )(f)362
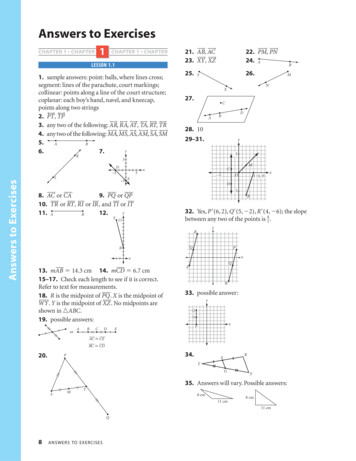
2CHAPTERExercise AnswersEXERCISE 2.3(a)The line drawn for part (a) will depend on each student’s subjective choice about theposition of the line. For this reason, it has been omitted.(b)b2 1.514286b1 10.8246810Figure xr2.3 Observations and fitted line123456xy(c)Fitted valuesy 5.5x 3.5yˆ 5.53
Chapter 2, Exercise Answers Principles of Econometrics, 4e4Exercise 2.3 (Continued)(d)eˆi0.7142860.228571 1.2571430.257143 1.2285711.285714 eˆi 0.(e) xi eˆi 0EXERCISE 2.6(a)The intercept estimate b1 240 is an estimate of the number of sodas sold when thetemperature is 0 degrees Fahrenheit. Clearly, it is impossible to sell 240 sodas and sothis estimate should not be accepted as a sensible one.The slope estimate b2 8 is an estimate of the increase in sodas sold when temperatureincreases by 1 Fahrenheit degree. One would expect the number of sodas sold to increaseas temperature increases.(b)yˆ 240 8 80 400(c)She predicts no sodas will be sold below 30 F.(d)A graph of the estimated regression line:-2000y200400600Figure xr2.6 Regression line0204060x80100
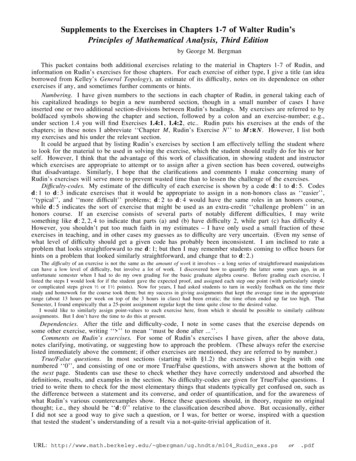
Chapter 2, Exercise Answers Principles of Econometrics, 4e5EXERCISE 2.9(a)Figure xr2.9a Occupancy , 1 march 2003,., 25 march 2005percentage motel occupancypercentage competitors occupancyThe repair period comprises those months between the two vertical lines. The graphicalevidence suggests that the damaged motel had the higher occupancy rate before and afterthe repair period. During the repair period, the damaged motel and the competitors hadsimilar occupancy rates.A plot of MOTEL PCT against COMP PCT yields:Figure xr2.9b Observations on occupancy10090percentage motel occupancy(b)80706050404050607080percentage competitors occupancyThere appears to be a positive relationship the two variables. Such a relationship may existas both the damaged motel and the competitor(s) face the same demand for motel rooms.
Chapter 2, Exercise Answers Principles of Econometrics, 4e6Exercise 2.9 (continued)(c) MOTELPCT 21.40 0.8646 COMP PCT .The competitors’ occupancy rates are positively related to motel occupancy rates, asexpected. The regression indicates that for a one percentage point increase in competitoroccupancy rate, the damaged motel’s occupancy rate is expected to increase by 0.8646percentage points.(d)30Repair period20residuals100-10-20-300481216202428month, 1 march 2003,., 25 march 2005Figure xr2.9(d) Plot of residuals against timeThe residuals during the occupancy period are those between the two vertical lines. Allexcept one are negative, indicating that the model has over-predicted the motel’soccupancy rate during the repair period.(e)We would expect the slope coefficient of a linear regression of MOTEL PCT onRELPRICE to be negative, as the higher the relative price of the damaged motel’s rooms,the lower the demand will be for those rooms, holding other factors constant. MOTELPCT 166.66 122.12 RELPRICE(f)The estimated regression is: MOTELPCT 79.3500 13.2357 REPAIRIn the non-repair period, the damaged motel had an estimated occupancy rate of 79.35%.During the repair period, the estimated occupancy rate was 79.35 13.24 66.11%. Thus,it appears the motel did suffer a loss of occupancy and profits during the repair period.(g)From the earlier regression, we haveMOTEL0 b1 79.35%MOTEL1 b1 b2 79.35 13.24 66.11%
Chapter 2, Exercise Answers Principles of Econometrics, 4e7Exercise 2.9(g) (continued)For competitors, the estimated regression is: COMPPCT 62.4889 0.8825 REPAIRCOMP 0 b1 62.49%COMP1 b1 b2 62.49 0.88 63.37%During the non-repair period, the difference between the average occupancies was:MOTEL0 COMP 0 79.35 62.49 16.86%During the repair period it wasMOTEL1 COMP1 66.11 63.37 2.74%This comparison supports the motel’s claim for lost profits during the repair period. Whenthere were no repairs, their occupancy rate was 16.86% higher than that of theircompetitors; during the repairs it was only 2.74% higher. MOTEL PCT COMP PCT 16.8611 14.1183 REPAIR(h)The intercept estimate in this equation (16.86) is equal to the difference in averageoccupancies during the non-repair period, MOTEL 0 COMP 0 . The sum of the twocoefficient estimates 16.86 ( 14.12) 2.74 is equal to the difference in averageoccupancies during the repair period, MOTEL1 COMP1 .This relationship exists because averaging the difference between two series is the same astaking the difference between the averages of the two series.EXERCISE 2.12(a) and (b) 30069 9181.7 LIVAREASPRICEThe coefficient 9181.7 suggests that selling price increases by approximately 9182 foreach additional 100 square foot in living area. The intercept, if taken literally, suggests ahouse with zero square feet would cost 30,069, a meaningless value.Figure xr2.12b Observations and fitted line800000600000400000200000010203040living area, hundreds of square feetselling price of home, dollarsFitted values50
Chapter 2, Exercise Answers Principles of Econometrics, 4e8Exercise 2.12 (continued)(c)The estimated quadratic equation for all houses in the sample is 57728 212.611 LIVAREA2SPRICEThe marginal effect of an additional 100 square feet for a home with 1500 square feet ofliving space is: d SPRICE slope 2 212.611 LIVAREA 2 212.611 15 6378.33dLIVAREA That is, adding 100 square feet of living space to a house of 1500 square feet is estimatedto increase its expected price by approximately 6378.(d)Figure xr2.12d Linear and quadratic fitted lines800000600000400000200000010203040living area, hundreds of square feetselling price of home, dollarsFitted values50Fitted valuesThe quadratic model appears to fit the data better; it is better at capturing theproportionally higher prices for large houses.SSE of linear model, (b):SSE eˆi2 2.23 1012SSE of quadratic model, (c):SSE eˆi2 2.03 1012The SSE of the quadratic model is smaller, indicating that it is a better fit.(e)Large lots: 113279 193.83LIVAREA2SPRICESmall lots: 62172 186.86 LIVAREA2SPRICEThe intercept can be interpreted as the expected price of the land – the selling price for ahouse with no living area. The coefficient of LIVAREA has to be interpreted in the contextof the marginal effect of an extra 100 square feet of living area, which is 2 2 LIVAREA .Thus, we estimate that the mean price of large lots is 113,279 and the mean price of smalllots is 62,172. The marginal effect of living area on price is 387.66 LIVAREA forhouses on large lots and 373.72 LIVAREA for houses on small lots.
Chapter 2, Exercise Answers Principles of Econometrics, 4e9Exercise 2.12 (continued)(f)The following figure contains the scatter diagram of PRICE and AGE as well as the 137404 627.16 AGE . We estimate that the expectedestimated equation SPRICEselling price is 627 less for each additional year of age. The estimated intercept, if takenliterally, suggests a house with zero age (i.e., a new house) would cost 137,404.Figure xr2.12f sprice vs age regression line80000060000040000020000000204060age of home at time of sale, yearsselling price of home, dollars80100Fitted valuesThe following figure contains the scatter diagram of ln(PRICE) and AGE as well as the SPRICE 11.746 0.00476 AGE . In this estimated model, eachestimated equation ln extra year of age reduces the selling price by 0.48%. To find an interpretation from theintercept, we set AGE 0 , and find an estimate of the price of a new home as exp ln SPRICE exp(11.74597) 126, 244 Figure xr2.12f log(sprice) vs age regression line14131211100204060age of home at time of sale, yearslsprice80100Fitted valuesBased on the plots and visual fit of the estimated regression lines, the log-linear modelshows much less of problem with under-prediction and so it is preferred.(g) 115220 133797 LGELOT . TheThe estimated equation for all houses is SPRICEestimated expected selling price for a house on a large lot (LGELOT 1) is115220 133797 249017. The estimated expected selling price for a house not on alarge lot (LGELOT 0) is 115220.
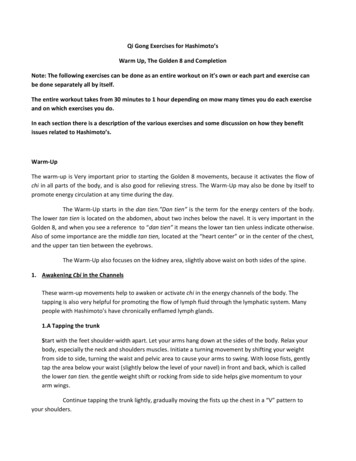
Chapter 2, Exercise Answers Principles of Econometrics, 4e10EXERCISE 2.14(a) and (b)30Incumbent vote405060xr2-14 Vote versus Growth with fitted regression-15-10-50Growth rate before electionIncumbent share of the two-party presidential vote510Fitted valuesThere appears to be a positive association between VOTE and GROWTH.The estimated equation for 1916 to 2008 is 50.848 0.88595GROWTHVOTEThe coefficient 0.88595 suggests that for a 1 percentage point increase in the growth rateof GDP in the 3 quarters before the election there is an estimated increase in the share ofvotes of the incumbent party of 0.88595 percentage points.We estimate, based on the fitted regression intercept, that that the incumbent party’sexpected vote is 50.848% when the growth rate in GDP is zero. This suggests that whenthere is no real GDP growth, the incumbent party will still maintain the majority vote.(c)The estimated equation for 1916 - 2004 is 51.053 0.877982GROWTHVOTEThe actual 2008 value for growth is 0.220. Putting this into the estimated equation, weobtain the predicted vote share for the incumbent party: 2008 51.053 0.877982GROWTHVOTE2008 51.053 0.877982 0.220 51.246This suggests that the incumbent party will maintain the majority vote in 2008. However,the actual vote share for the incumbent party for 2008 was 46.60, which is a long wayshort of the prediction; the incumbent party did not maintain the majority vote.
Chapter 2, Exercise Answers Principles of Econometrics, 4e11Exercise 2.14 (continued)(d)30Incumbent vote405060xr2-14 Vote versus Inflation024Inflation rate before electionIncumbent share of the two-party presidential vote68Fitted valuesThere appears to be a negative association between the two variables.The estimated equation is: 53.408 0.444312 INFLATIONVOTEWe estimate that a 1 percentage point increase in inflation during the incumbent party’sfirst 15 quarters reduces the share of incumbent party’s vote by 0.444 percentage points.The estimated intercept suggests that when inflation is at 0% for that party’s first 15quarters, the expected share of votes won by the incumbent party is 53.4%; the incumbentparty is predicted to maintain the majority vote when inflation, during its first 15 quarters,is at 0%.
CHAPTER3Exercise AnswersEXERCISE 3.3(a)Reject H 0 because t 3.78 tc 2.819.(b)Reject H 0 because t 3.78 tc 2.508.(c)Do not reject H 0 because t 3.78 tc 1.717.Figure xr3.3 One tail rejection region(d)Reject H 0 because t 2.32 tc 2.074.(e)A 99% interval estimate of the slope is given by (0.079, 0.541)12
Chapter 3, Exercise Answers, Principles of Econometrics, 4e13EXERCISE 3.6(a)We reject the null hypothesis because the test statistic value t 4.265 tc 2.500. The pvalue is 0.000145Figure xr3.6(a) Rejection region and p-value(b)Wedonotrejectthe null hypothesist 2.093 tc 2.500 . The p-value is 0.0238becausethetestFigure xr3.6(b) Rejection region and p-value(c)Since t 2.221 tc 1.714 , we reject H 0 at a 5% significance level.(d)A 95% interval estimate for 2 is given by ( 25.57, 0.91) .(e)Since t 3.542 tc 2.500 , we reject H 0 at a 5% significance level.(f)A 95% interval estimate for 2 is given by ( 22.36, 5.87) .statisticvalue
Chapter 3, Exercise Answers, Principles of Econometrics, 4e14EXERCISE 3.9(a)We set up the hypotheses H0: 2 0 versus H1: 2 0 . Since t 4.870 1.717, wereject the null hypothesis.(b)A 95% interval estimate for 2 from the regression in part (a) is (0.509, 1.263).(c)We set up the hypotheses H0: 2 0 versus H1: 2 0 . Since t 0.741 1.717 , wedo not reject the null hypothesis.(d)A 95% interval estimate for 2 from the regression in part (c) is ( 1.688, 0.800).(e)We test H 0 : 1 50 against the alternative H1 : 1 50 . Since t 1.515 1.717 , we donot reject the null hypothesis.(f)The 95% interval estimate is 49.40, 55.64 .EXERCISE 10203040EXPER30Figure xr3.13(a) Scatter plot of ln(WAGE) against EXPER30(b)The estimated log-polynomial model is ln WAGE 2.9826 0.0007088 EXPER30 2 .We test H 0 : 2 0 against the alternative H 1 : 2 0 . Because t 8.067 1.646 , wereject H 0 : 2 0 .
Chapter 3, Exercise Answers, Principles of Econometrics, 4eExercise 3.13 (continued)(c)me10 me30 me50 d WAGE d EXPER 0.4215EXPER 10 d WAGE d EXPER 0.0EXPER 30 d WAGE d EXPER 0.4215EXPER 50(d)80706050WAGEfitted WAGE403020100-30-20-10010203040EXPER30Figure xr3.13(d) Plot of fitted and actual values of WAGE15
CHAPTER4Exercise AnswersEXERCISE 4.1(a)R 2 0.71051(b)R 2 0.8455(c) ˆ 2 6.4104EXERCISE 4.2(a)yˆ 5.83 17.38 x (1.23) (2.34)where x x20(b)yˆ 0.1166 0.01738 x(0.0246) (0.00234)where yˆ yˆ50(c)yˆ 0.2915 0.869 x (0.0615) (0.117)where yˆ yˆxand x 2020EXERCISE 4.9(a)Equation 1:yˆ 0 0.69538 0.015025 48 1.417yˆ 0 t(0.975,45) se( f ) 1.4166 2.0141 0.25293 (0.907,1.926)Equation 2:yˆ 0 0.56231 0.16961 ln(48) 1.219yˆ 0 t(0.975,45) se( f ) 1.2189 2.0141 0.28787 (0.639,1.799)Equation 3:yˆ 0 0.79945 0.000337543 (48) 2 1.577yˆ 0 t(0.975,45) se( f ) 1.577145 2.0141 0.234544 (1.105, 2.050)The actual yield in Chapman was 1.844.16
Chapter 4, Exercise Answers, Principles of Econometrics, 4e17Exercise 4.9 (continued)(b)(c)(d)Equation 1: dyt 0.0150dtEquation 2: dyt 0.0035dtEquation 3: dyt 0.0324dtEquation 1: dyt t 0.509dt ytEquation 2: dyt t 0.139dt ytEquation 3: dyt t 0.986dt ytThe slopes dy dt and the elasticities dy dt t y give the marginal change in yieldand the percentage change in yield, respectively, that can be expected from technologicalchange in the next year. The results show that the predicted effect of technological changeis very sensitive to the choice of functional form.EXERCISE 4.11(a)The estimated regression model for the years 1916 to 2008 is: 50.8484 0.8859GROWTHVOTE(se) 1.0125 0.1819 VOTE2008 51.043(b)R 2 0.5189 2008 4.443VOTE2008 VOTEThe estimated regression model for the years 1916 to 2004 is: 51.0533 0.8780GROWTHVOTE(se)R 2 0.5243(1.0379) (0.1825) VOTE2008 51.246 2008 4.646f VOTE2008 VOTEThis prediction error is larger in magnitude than the least squares residual. This result isexpected because the estimated regression in part (b) does not contain information aboutVOTE in the year 2008.
Chapter 4, Exercise Answers, Principles of Econometrics, 4e18Exercise 4.11 (continued)(c) VOTE2008 t(0.975,21) se( f ) 51.2464 2.0796 4.9185 (41.018,61.475)The actual 2008 outcome VOTE2008 46.6 falls within this prediction interval.(d)GROWTH 1.086EXERCISE 4.13(a)The regression results are:ln( PRICE ) 10.5938 0.000596 SQFT se t 0.0219 0.000013 484.84 46.30 The coefficient 0.000596 suggests an increase of one square foot is associated with a0.06% increase in the price of the house.dPRICE 67.23dSQFTelasticity 2 SQFT 0.00059596 1611.9682 0.9607(b)The regression results are:ln( PRICE ) 4.1707 1.0066ln( SQFT ) se t 0.1655 0.0225 25.20 44.65 The coefficient 1.0066 says that an increase in living area of 1% is associated with a 1%increase in house price.The coefficient 1.0066 is the elasticity.dPRICE 70.444dSQFT(c)From the linear function, R 2 0.672 .From the log-linear function in part (a), Rg2 0.715 .From the log-log function in part (b), Rg2 0.673 .
Chapter 4, Exercise Answers, Principles of Econometrics, 4e19Exercise 4.13 (continued)(d)12010080Jarque-Bera 78.85p -value 0.00006040200-0.75-0.50-0.250.000.250.500.75Figure xr4.13(d) Histogram of residuals forlog-linear model12010080Jarque-Bera 52.74p -value 0.00006040200-0.75-0.50-0.250.000.250.500.75Figure xr4.13(d) Histogram of residuals forlog-log model200160120Jarque-Bera 2456p -value 0.000080400-1000000100000200000Figure xr4.13(d) Histogram of residuals forsimple linear modelAll Jarque-Bera values are significantly different from 0 at the 1% level of significance.We can conclude that the residuals are not compatible with an assumption of normality,particularly in the simple linear model.
Chapter 4, Exercise Answers, Principles of Econometrics, 4e20Exercise 4.13 SQFT300040005000SQFTResiduals of log-linear modelResiduals of log-log 100000-150000010002000300040005000SQFTResiduals of simple linear modelThe residuals appear to increase in magnitude as SQFT increases. This is most evident inthe residuals of the simple linear functional form. Furthermore, the residuals for the simplelinear model in the area less than 1000 square feet are all positive indicating that perhapsthe functional form does not fit well in this region.(f)Prediction for log-linear model: 203,516PRICEPrediction for log-log model: 188,221PRICE 201,365Prediction for simple linear model: PRICE(g)The standard error of forecast for the log-linear model is se( f ) 0.20363 .The 95% confidence interval is: (133,683; 297,316) .The standard error of forecast for the log-log model is se( f ) 0.20876 .The 95% confidence interval is (122,267; 277,454) .The standard error of forecast for the simple linear model is se( f ) 30348.26 .The 95% confidence interval is 141,801; 260,928 .
Chapter 4, Exercise Answers, Principles of Econometrics, 4e21Exercise 4.13 (continued)(h)The simple linear model is not a good choice because the residuals are heavily skewed tothe right and hence far from being normally distributed. It is difficult to choose betweenthe other two models – the log-linear and log-log models. Their residuals have similarpatterns and they both lead to a plausible elasticity of price with respect to changes insquare feet, namely, a 1% change in square feet leads to a 1% change in price. The loglinear model is favored on the basis of its higher Rg2 value, and its smaller standarddeviation of the error, characteristics that suggest it is the model that best fits the data.
CHAPTER5Exercise AnswersEXERCISE 5.1(a)y 1, x2 0, x3 0xi*2xi*3yi*012 21 20 111 210 1 1110012 2 1 2101(b) yi* xi*2 13, xi*22 16,(c)b2 0.8125b3 0.4(d)eˆ 0.4, 0.9875, 0.025, 0.375, 1.4125, 0.025, 0.6, 0.4125, 0.1875 (e) ˆ 2 0.6396(f)r23 0(g)se( b2 ) 0.1999(h)SSE 3.8375SST 16 yi* xi*3 4, xi*32 10b1 1SSR 12.1625R 2 0.760222
Chapter 5, Exercise Answers, Principles of Econometrics, 4e23EXERCISE 5.2(a)(b)b2 t(0.975,6) se(b2 ) (0.3233, 1.3017)We do not reject H 0 because t 0.9377 and 0.9377 2.447 t(0.975, 6) .EXERCISE 5.4(a)The regression results are: 0.0315 0.0414ln TOTEXP 0.0001 AGE 0.0130 NKWTRANS se (b)(0.0322) (0.0071)(0.0004)R 2 0.0247(0.0055)The value b2 0.0414 suggests that as ln TOTEXP increases by 1 unit the budgetproportion for transport increases by 0.0414. Alternatively, one can say that a 10%increase in total expenditure will increase the budget proportion for transportation by0.004. (See Chapter 4.3.3.) The positive sign of b2 is according to our expectation becauseas households become richer they tend to use more luxurious forms of transport and theproportion of the budget for transport increases.The value b3 0.0001 implies that as the age of the head of the household increases by 1year the budget share for transport decreases by 0.0001. The expected sign for b3 is notclear. For a given level of total expenditure and a given number of children, it is difficultto predict the effect of age on transport share.The value b4 0.0130 implies that an additional child decreases the budget share fortransport by 0.013. The negative sign means that adding children to a household increasesexpenditure on other items (such as food and clothing) more than it does on transportation.Alternatively, having more children may lead a household to turn to cheaper forms oftransport.(c)The p-value for testing H 0 : 3 0 against the alternative H1 : 3 0 where 3 is thecoefficient of AGE is 0.869, suggesting that AGE could be excluded from the equation.Similar tests for the coefficients of the other two variables yield p-values less than 0.05.(d)R 2 0.0247(e)For a one-child household: 0 0.1420WTRANSFor a two-child household: 0 0.1290WTRANS
Chapter 5, Exercise Answers, Principles of Econometrics, 4e24EXERCISE 5.8(a)Equations describing the marginal effects of nitrogen and phosphorus on yield are E YIELD 8.011 3.888 NITRO 0.567 PHOS NITRO E YIELD 4.800 1.556 PHOS 0.567 NITRO PHOS The marginal effect of both fertilizers declines – we have diminishing marginal products –and these marginal effects eventually become negative. Also, the marginal effect of onefertilizer is smaller, the larger is the amount of the other fertilizer that is applied.(b)(i)The marginal effects when NITRO 1 and PHOS 1 are E YIELD 3.556 NITRO (ii) E YIELD 2.677 PHOS The marginal effects when NITRO 2 and PHOS 2 are E YIELD 0.899 NITRO E YIELD 0.554 PHOS When NITRO 1 and PHOS 1 , the marginal products of both fertilizers are positive.Increasing the fertilizer applications to NITRO 2 and PHOS 2 reduces the marginaleffects of both fertilizers, with that for nitrogen becoming negative.(c)To test these hypotheses, the coefficients are defined according to the following equationYIELD 1 2 NITRO 3 PHOS 4 NITRO 2 5 PHOS 2 6 NITRO PHOS e(i) Testing H 0 : 2 2 4 6 0 against the alternative H1 : 2 2 4 6 0 , the t-valueis t 7.367 . Since t tc t(0.975, 21) 2.080 , we reject the null hypothesis andconclude that the marginal effect of nitrogen on yield is not zero when NITRO 1 andPHOS 1.(ii) Testing H 0 : 2 4 4 6 0 against H1 : 2 4 4 6 0 , the t-value is t 1.660 .Since t 2.080 t(0.975, 21) , we do not reject the null hypothesis. A zero marginal yieldwith respect to nitrogen cannot be rejected when NITRO 1 and PHOS 2.(iii) Testing H 0 : 2 6 4 6 0 against H1 : 2 6 4 6 0 , the t-value is t 8.742 .Since t 2.080 t(0.975, 21) , we reject the null hypothesis and conclude that themarginal product of yield to nitrogen is not zero when NITRO 3 and PHOS 1.(d)The maximizing levels are NITRO 1.701 and PHOS 2.465 . The yield maximizinglevels of fertilizer are not necessarily the optimal levels. The optimal levels are thosewhere the marginal cost of the inputs is equal to their marginal value product.
Chapter 5, Exercise Answers, Principles of Econometrics, 4e25EXERCISE 5.15(a)The estimated regression model is: 52.16 0.6434 GROWTH 0.1721 INFLATIONVOTE(se)(1.46) (0.1656)(0.4290)The hypothesis test results on the significance of the coefficients are:H 0 : 2 0H1 : 2 0p-value 0.0003significant at 10% levelH 0 : 3 0H 1 : 3 0p-value 0.3456not significant at 10% levelOne-tail tests were used because more growth is considered favorable, and more inflationis considered not favorable, for re-election of the incumbent party.(b)(i) 49.54 .For INFLATION 4 and GROWTH 3 , VOTE0(ii) 51.47 .For INFLATION 4 and GROWTH 0 , VOTE0 53.40 .(iii) For INFLATION 4 and GROWTH 3 , VOTE0(c)(i)When INFLATION 4 and GROWTH 3 , the hypotheses areH 0 : 1 3 2 4 3 50H1 : 1 3 2 4 3 50The calculated t-value is t 0.399 . Since 0.399 2.457 t(0.99,30) , we do notreject H 0 . There is no evidence to suggest that the incumbent part will get themajority of the vote when INFLATION 4 and GROWTH 3 .(ii)When INFLATION 4 and GROWTH 0 , the hypotheses areH 0 : 1 4 3 50H1 : 1 4 3 50The calculated t-value is t 1.408 . Since 1.408 2.457 t(0.99,30) , we do not rejectH 0 . There is insufficient evidence to suggest that the incumbent part will get themajority of the vote when INFLATION 4 and GROWTH 0 .(iii) When INFLATION 4 and GROWTH 3 , the hypotheses areH 0 : 1 3 2 4 3 50H1 : 1 3 2 4 3 50The calculated t-value is t 2.950 . Since 2.950 2.457 t(0.99,30) , we reject H 0 . Weconclude that the incumbent part will get the majority of the vote whenINFLATION 4 and GROWTH 3 .As a president seeking re-election, you would not want to conclude that you would be reelected without strong evidence to support such a conclusion. Setting up re-election as thealternative hypothesis with a 1% significance level reflects this scenario.
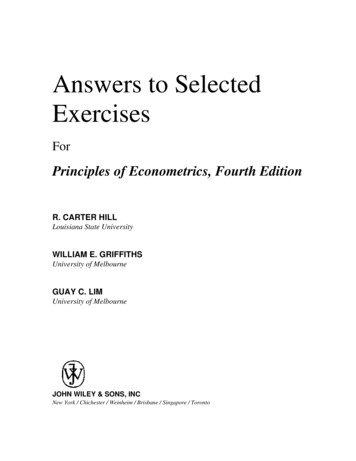
Chapter 5, Exercise Answers, Principles of Econometrics, 4e26EXERCISE 5.23The estimated model is 39.594 47.024 AGE 20.222 AGE 2 2.749 AGE 3SCORE(se)(28.153) (27.810)(8.901)(0.925)The within sample predictions, with age expressed in terms of years (not units of 10 years)are graphed in the following figure. They are also given in a table on page 27.151050SCORESCOREHAT-5-10-1520242832364044AGE UNITSFigure xr5.23 Fitted line and observations(a)We test H 0 : 4 0. The t-value is 2.972, with corresponding p-value 0.0035. Wetherefore reject H 0 and conclude that the quadratic function is not adequate. For suitablevalues of 2 , 3 and 4 , the cubic function can decrease at an increasing rate, then go pasta point of inflection after which it decreases at a decreasing rate, and then it can reach aminimum and increase. These are characteristics worth considering for a golfer. That is,the golfer improves at an increasing rate, then at a decreasing rate, and then declines inability. These characteristics are displayed in Figure xr5.23.(b)(i)Age 30(ii)Between the ages of 20 and 25.(iii) Between the ages of 25 and 30.(iv) Age 36.(v)(c)Age 40.No. At the age of 70, the predicted score (relative to par) for Lion Forrest is 241.71. Tobreak 100 it would need to be less than 28 ( 100 72) .
Chapter 5, Exercise Answers, Principles of Econometrics, 4eExercise 5.23 (continued)Predicted scores at different agesagepredicted 424344 4.4403 4.5621 4.7420 4.9633 5.2097 5.4646 5.7116 5.9341 6.1157 6.2398 6.2900 6.2497 6.1025 5.8319 5.4213 4.8544 4.1145 3.1852 2.0500 0.69230.90422.75614.87997.292110.009227
Chapter 5, Exercise Answers, Principles of Econometrics, 4e28EXERCISE 5.24(a)The coefficient estimates, standard errors, t-values and p-values are in the following table.Dependent Variable: ln(PROD)CoeffStd. .47180.0000ln(FERT)0.20950.03835.47500.0000All estimates have elasticity interpretations. For example, a 1% increase in labor will leadto a 0.4328% increase in rice output. A 1% increase in fertilizer will lead to a 0.2095%increase in rice output. All p-values are less than 0.0001 implying all estimates aresignificantly different from zero at conventional significance levels.(b)Testing H 0 : 2 0.5 against H1 : 2 0.5 , the t-value is t 2.16 .Since 2.59 2.16 2.59 t(0.995,348) , we do not reject H 0 . The data are compatible withthe hypothesis that the elasticity of production with respect to land is 0.5.(c)A 95% interval estimate of the elasticity of production with respect to fertilizer is given byb4 t(0.975,348) se(b4 ) (0.134, 0.285)This relatively narrow interval implies the fertilizer elasticity has been precisely measured.(d)Testing H 0 : 3 0.3 against H1 : 3 0.3 , the t-value is t 1.99 . We reject H 0 because1.99 1.649 t(0.95,348) . There is evidence to conclude that the elasticity of production withrespect to labor is greater than 0.3. Reversing the hypotheses and testing H 0 : 3 0.3against H1 : 3 0.3 , leads to a rejection region of t 1.649 . The calculated t-value ist 1.99 . The null hypothesis is not rejected because 1.99 1.649 .
6CHAPTERExercise AnswersEXERCISE 6.3(a)Let the total variation, unexplained variation a
Chapter 2, Exercise Answers Principles of Econometrics, 4e 4 Exercise 2.3 (Continued) (d) ˆ ei 0.714286 0.228571 1.257143 0.257143 1.228571 1.285714 ˆ 0. ei (e) ˆ 0 xeii EXERCISE 2.6 (a) The intercept estimate b1 240 is an estimate of the number of