Transcription
COREMetadata, citation and similar papers at core.ac.ukProvided by University of Tennessee, Knoxville: TraceUniversity of Tennessee, KnoxvilleTrace: Tennessee Research and CreativeExchangeMasters ThesesGraduate School5-2005Novel Algorithms and Datamining for ClusteringMassive DatasetsAruna K. BuddanaUniversity of Tennessee - KnoxvilleRecommended CitationBuddana, Aruna K., "Novel Algorithms and Datamining for Clustering Massive Datasets. " Master's Thesis, University of Tennessee,2005.https://trace.tennessee.edu/utk gradthes/1807This Thesis is brought to you for free and open access by the Graduate School at Trace: Tennessee Research and Creative Exchange. It has beenaccepted for inclusion in Masters Theses by an authorized administrator of Trace: Tennessee Research and Creative Exchange. For more information,please contact trace@utk.edu.
To the Graduate Council:I am submitting herewith a thesis written by Aruna K. Buddana entitled "Novel Algorithms andDatamining for Clustering Massive Datasets." I have examined the final electronic copy of this thesis forform and content and recommend that it be accepted in partial fulfillment of the requirements for thedegree of Master of Science, with a major in Statistics.Halima Bensmail, Major ProfessorWe have read this thesis and recommend its acceptance:Mary Leitnaker, Robert MeeAccepted for the Council:Dixie L. ThompsonVice Provost and Dean of the Graduate School(Original signatures are on file with official student records.)
To the Graduate Council:I am submitting herewith a thesis written by Aruna K. Buddana entitled ”NovelAlgorithms and Datamining for Clustering Massive Datasets”. I have examined thefinal electronic copy of this thesis for form and content and recommend that it beaccepted in partial fulfillment of the requirements for the degree of Master of Science,with a major in Statistics.Halima BensmailMajor ProfessorWe have read this thesis andrecommend its acceptance:Mary LeitnakerRobert MeeAccepted for the Council:Anne MayhewVice Chancellor andDean of Graduate Studies(Original signatures are on file with official student records.)
Novel Algorithms and Datamining forClustering Massive DatasetsA ThesisPresented for theMaster of Science DegreeThe University of Tennessee, KnoxvilleAruna K BuddanaMay 2005
Dedicated to my family, teachers and friendsii
ACKNOWLEDGEMENTSForemost, I would like to express my deepest gratitude to my advisor, Dr.Halima Bensmail, for her excellent guidance and enormous support during mygraduate study at The University of Tennessee, Knoxville. No words of gratitude aresufficient to mention here, to describe her unrelenting support.Many thanks to Dr. Mary Leitnaker and Dr. Robert Mee for serving on mythesis committee. I am grateful to Dr. George Ostrouchov, Senior Research StaffMember, ORNL , for giving me the opportunity to work as an intern and gain researchexperience.I am deeply indebted to my parents for the support and the motivation theyprovided me to explore higher levels of education. I thank all my buddies especiallyJennifer Golek for their endless support. Nothing would be possible without theirgood wishes. Last, and surely not the least, my heart full thanks to my dearest friend,my fiancée, Suresh, for his motivation and being there for me.iii
ABSTRACTClustering proteomics data is a challenging problem for any traditionalclustering algorithm. Usually, the number of samples is much smaller than the numberof protein peaks. The use of a clustering algorithm which does not take intoconsideration the number of feature of variables (here the number of peaks) is needed.An innovative hierarchical clustering algorithm may be a good approach. This workproposes a new dissimilarity measure for the hierarchical clustering combined with afunctional data analysis. This work presents a specific application of functional dataanalysis (FDA) to a highthrouput proteomics study. The high performance of theproposed algorithm is compared to two popular dissimilarity measures in theclustering of normal and Human T Cell Leukemia Virus Type 1 (HTLV-1)-infectedpatients samples.The difficulty in clustering spatial data is that the data is multi - dimensionaland massive. Sometimes, an automated clustering algorithm may not be sufficient tocluster this type of data. An iterative clustering algorithm along with the capability ofvisual steering may be a good approach. This case study proposes a new iterativealgorithm which is the combination of automated clustering methods like the bayesianclustering, detection of multivariate outliers, and the visual clustering. Simulated datafrom a plasma experiment and real astronomical data are used to test the performanceof the algorithm.iv
TABLE OF CONTENTSCHAPTER 1 INTRODUCTION.11.1PROTEOMICS DATA.11.2SPATIAL DATA.21.3CLUSTERING METHODS.3CHAPTER 2 MATERIALS.52.1SERUM SAMPLES.52.2SELDI MASS SPECTROMETRY.52.3PLASMA EXPERIMENT.7CHAPTER 3 METHODS.93.1HIERARCHICAL CLUSTERING USING FDA.93.2MODEL-BASED CLUSTER ANALYSIS.113.2.1Bayesian cluster analysis: bclust.123.2.1.1Model selection.163.2.2Maximum likelihood cluster analysis: mclust.173.3HANDLING NOISES IN CLUSTER ANALYSIS.183.4ITERATIVE CLUSTERING ALGORITHM.19CHAPTER 4 RESULTS.214.1PROTEOMICS DATA.214.1.1Clustering spectral data using Functional Data Analysis.224.2SPATIAL DATA.274.2.1Example 1: Simulated data.274.2.2Example 2: Real data.30CHAPTER 5 DISCUSSION.33REFERENCES.35VITA.42v
LIST OF TABLESTable 1Table 2Table 3Table 4Different geometric models.12Confusion matrix to show the performance of B using diana.26Confusion matrix to show the performance of B using clara.26Bayes factors for different models.31vi
LIST OF FIGURESFigure 1Figure 2Figure 3Figure 4Figure 5Figure 6Figure 7Figure 8Figure 9Figure 10Figure 11Figure 12Figure 13Figure 14Figure 15Figure 16Figure 17Figure 18Figure 19Three cut-expressions from a normal, HAM and an ATL patient.6Integrated simulation & optimization of fusion systems.8Menu of the iterative algorithm.20Clustering proteomics data with diana.23Pattern recognition using C .24Pattern recognition using HZ .24Pattern recognition using B .24Dendogram of the B dissimilarity approach with diana.25The B dissimilarity approach with clara.25Log of the data.28Sample of the data.28Visual clusters.28Clusters without outliers.28Clusters with outliers.29Final clusters.29Clusters of the data.29Real data.32Sample data.32Final Bayesian clusters.32vii
CHAPTER 1INTRODUCTIONThe entire work can be broadly divided into two categories:1) Hierarchical Clustering High Dimensional Proteomics Data using FunctionalData Analysis2) Clustering Massive Spatial Data using Iterative Clustering Algorithm1.1Proteomics DataA variety of mass spectrometry-based platforms are currently available forproviding information on both protein patterns and protein identity 1, 2 . Specifically,the first widely used such mass spectrometric technique is known as surface enhancedlaser desorption ionization (SELDI) coupled with time of flight (TOF) massspectrometric detection 3 5 . The SELDI approach is based on the use of anenergy-absorbing matrix such as sinapinic acid (SPH), large molecules such aspeptides ionize instead of decomposing when subjected to a nitrogen UV laser. Thus,partially purified serum is crystallized with an SPH matrix and placed on a metalslide. Depending upon the range of masses the investigator wishes to study, there are avariety of possible slide surfaces; for example, the strong anion exchange (SAX) orthe weak cation exchange (WCX) surface. The peptides are ionized by the pulsedlaser beam and then traverse a magnetic field-containing column. Masses areseparated according to their times of flight as the latter are proportional to the squareof the mass-to-charge (m/z) ratio. Since nearly all of the resulting ions have unitcharge, the mass-to-charge ratio is in most cases a mass. The spectrum (intensity levelas a function of mass) is recorded, so the resulting data obtained on each serumsample are a series of intensity levels at each mass value on a common grid of masses(peaks).Proteomic profiling is a new approach to clinical diagnosis, and manycomputational challenges still exist. Not only are the platforms themselves stillimproving, but the methods used to interpret the high dimensional data are developingas well 6, 7 .A variety of clustering approaches has been applied to high dimentionalgenomics and proteomics data 8 11 . Hierarchical clustering methods give rise tonested partitions, meaning the intersection of a set in the partition at one level of thehierarchy with a set of the partition at a higher level of the hierarchy will always beequal to the set from the lower level or the empty set. The hierarchy can thus be1
graphically represented by a tree.Functional Data Analysis (FDA) is a statistical data analysis represented bysmooth curves or continuous functions i t ; i 1, . . , n, where n is the number ofobservations and t might or might not necessarily denote time but might have ageneral meaning. Here t denotes the mass (M/Z). In practice, the information over i t is collected at a finite number of points, T i , thus observing the data vectory i y i1, . . . . , y iT i t . The basic statistical model of FDA is given byi 1, . . . , n; j 1, . . , T iy ij i t ij i t ij i t ij orwhere t ij is the mass value at which the j th measurement is taken for the i thfunction i . The independent disturbance terms i t ij are responsible for roughness inyi.FDA has been developed for analyzing functional (or curve) data. In FDA,data consists of functions not of vectors. Samples are taken at time points t 1 , t 2 , . . . ,and regard i t ij as multivariate observations. In this sense the original functional y ijcan be regarded as the limit of i t ij as the sampling interval tends to zero and thedimension of multivariate observations tends to infinity. Ramsay and Silverman 12, 13 have discussed several methods for analyzing functional data, includingfunctional regression analysis, functional principal component analysis (PCA), andfunctional canonical correlation analysis (CCA). These methodologies look attractive,because one often meets the cases where one wishes to apply regression analysis andprincipal component analysis to such data. In the following we describe how to usethe FDA tools for applying functional data analysis and a new disssimilarity measureto classify the spectra data.We propose to implement a hierarchical clustering algorithm for proteomicsdata using functional data analysis. We use functional transformation to smooth andreduce the dimensionality of the spectra and develop a new algorithm for clusteringhigh dimensional proteomics data.1.2Spatial DataSpatial Databases are the database systems for the organization of spatial datai.e. the point objects extended in a 2-Dimensional or a 3-Dimensional or some otherhigher dimensional vector space. Multi-scale databases are a set of spatial databaseswith certain limitationsData mining, an essential element of much detailed process KnowledgeDiscovery in Databases (KDD), deals with the extraction of hidden structure of hugedata sets either by clustering or by discovering regularities in the data. The subject ofdata mining spatial databases finds its roots from the concept of data mining relationaland transactional databases. Knowledge discovery in large multi-scale databases has2(1)
become essential since data collected from many applications such as satellite images,astrophysical equipment, X-ray crystallography is stored in such massive spatialdatabases. Also, spatial data mining techniques have wide applications ranging fromremote sensing, geographical information systems to crime scene investigations andenvironment & planning. Because of the large volumes of the data in these multi-scaledatabases it is often expensive and unrealistic to look at every detail for anyinformation buried in the dataset.Clustering analysis is a renowned data mining technique, which involvesdividing a large dataset into meaningful subclasses and thus extracting hidden patternsamong the objects. It is a procedure to extract the gist of information present in thedata set. It usually demands some information to be known such as the statisticaldistribution of the data (if the data is gaussian distributed) and number of clusters onecan expect. But real time spatial data may not have any of this information available.Also the shape of the clusters can be very arbitrary such as spherical, linear,ellipsoidal, elongated etc.These clusters can be populated with as many as 100,000 points or as few as10 points in a given time. So uniform generalized cluster analysis is almostunimaginable in massive multi-scale data mining.Before we actually delve into spatial data mining, a brief background of theclustering methods is presented in the next section.1.3Clustering MethodsThe term cluster analysis (first used by Tryon, 1939) includes a number ofdifferent algorithms and routines for grouping similar objects into particularcategories.The clustering algorithms are defined to be the procedures, which produceclusters of data from a given dataset.Clustering algorithms can be broadly classified into hierarchical clusteringtechniques and optimization partitioning algorithms. The hierarchical algorithmsoperate in such a way that the dataset is divided into certain groups sequentiallymaking all the objects similar for a given branch node until higher up the tree. Thesealgorithms can be further split into agglomerative and splitting procedures. Inagglomerative technique, hierarchical clustering starts from the optimum partitionpossible (each observation forms a cluster) and groups them. This procedure dependson the definition of the distance between two clusters. Single linkage, completelinkage, average linkage and Ward distance are frequently used distances. Splittingprocedure starts with the crudest partition possible one cluster contains all of theobservations. It proceeds by splitting the single cluster up into smaller sized clusters.3
Divisive methods are not generally available, and rarely have been applied.The partioning algorithms divide the dataset into homogenous clusters until acertain score is optimized. The most common algorithm is the k-means algorithm inthis category. Like most other clustering algorithms k-means does not necessarily findan optimized configuration. It performs differently on different datasets and it is morebiased on the selection of the initial random clusters.The main difference between the two clustering techniques is that inhierarchical clustering once groups are found and elements are assigned to the groups,this assignment cannot be changed. In partitioning techniques, on the other hand, theassignment of objects into groups may change during the algorithm application.Clustering algorithms face their toughest problem in implementation when thedataset is massive and multi dimensional. The hierarchical clustering methods cannotcompute their distance matrices on the basis of which clustering is done. The k-meansalgorithm becomes limited once the dataset is considerably large.4
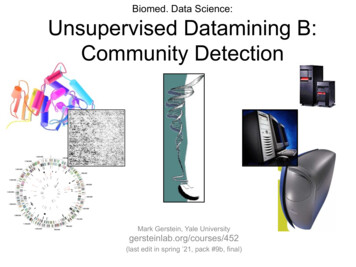
CHAPTER 2MATERIALS2.1Serum SamplesProtein expression profiles generated through SELDI analysis of sera fromHTLV-1 (Human T cell Leukemia virus type 1)-infected individuals were used todetermine the changes in the cell proteome that characterize Adult T cell leukemia(ATL), an aggressive lymphoproliferative disease from HTLV-1-AssociatedMyelopathy/Tropical Spastic Paraparesis (HAM/TSP), a chronic progressiveneurodegenerative disease. Both diseases are associated with the infection of T-cellsby HTLV-1. The HTLV-1 virally encoded oncoprotein Tax has been implicated in theretrovirus mediated cellular transformation and is believed to contribute to theoncogenic process through induction of genomic instability affecting both DNA repairintegrity and cell cycle progression 14, 15 . Serum samples were obtained from theVirginia Prostate Center Tissue and body fluid bank. All samples had been procuredfrom concenting patients according to protocols approved by the Institutional ReviewBoard and stored frozen. None of the samples had been thawed more than twice.Triplicate serum samples (n 68) from healthy or normal (n 1 37), ATL(n 2 20) and HAM (n 3 11) patients were processed. A bioprocessor, which holds12 chips in place, was used to process 96 samples at one time. Each chip containedone ”QC spot” from normal pooled serum, which was applied to each chip along withthe test samples in a random fashion. The QC spots served as quality control for assayand chip variability. The samples were blinded for the technicians who processed thesamples. The reproducibility of the SELDI spectra, i.e., mass and intensity from arrayto array on a single chip (intraassay) and between chips (interassay), was determinedwith the pooled normal serum QC sample [Figure 1].2.2SELDI Mass SpectrometrySerum samples were analyzed by SELDI mass spectrometry as describedearlier 16 . The spectral data generated was used in this study for the development ofthe novel functional data analysis.5
Figure 1: Three cut-expressions from a normal, HAM and an ATL patient6
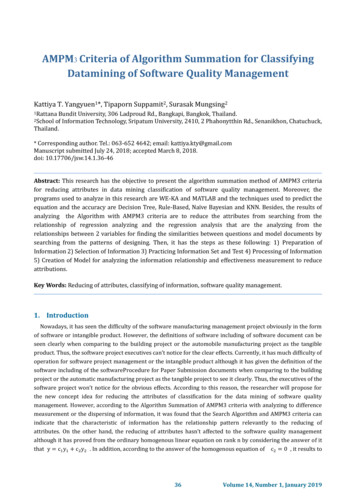
2.3Plasma ExperimentBecause of an ever-expanding global population, the world’s demand forenergy grows more and more. Energy sources that come from burning fossil fuelscontribute to environmental stress and release of greenhouse gasses. Nuclear fusion isan alternative energy source with the potential to provide abundant clean energy.Unlike current nuclear fission power plants that are based on splitting atoms heavyelements, nuclear fusion is a process that combines light elements. Unlike fissionprocesses, nuclear fusion produces no harmful waste. Tokamak facilities [Figure 2]are experimental test chambers used for testing nuclear fusion energy, whereHydrogen nuclei can be fused into Helium, mimicking the process that occurs at thecenter of the Sun. The common type of tokamak fusion labs have doughnut-shapedchambers where the fusion reaction occurs. In order to achieve nuclear fusion, theplasma inside the chamber must be heated to enormous temperatures. Plasma is thefourth state of matter (solid, liquid, gas, plasma). It is also the most common state ofmatter, making up 99% of the visible universe. Best known examples of plasmainclude flames, lightning, neon signs and fluorescent lights, and the aurora borealis.Tokamak chambers apply radio-frequency heating to drive the plasma to hightemperatures in similar way that microwave ovens heat water. They also employpowerful magnetic fields to contain the plasma inside the vessel. The largest currenttokamak is the Europe’s JET facility (www.jet.efda.org). Larger tokamaks areplanned, including ITER (www.iter.org), a multinational venture that will heat plasmato 100 million 0 C and produce 500 Megawatts of power. ITER is projected to be theprogenitor of a commercially viable fusion energy source.Because the construction of a tokamak facility is an expensive enterprise, andthe processes governing the behavior of the tokamak are highly complex andmultivariate, researchers rely on computer models and simulations to guide theirdesigns. For our project, the data was obtained from the All-Orders SpectralAlgorithm (AORSA) computer model for electromagnet wave interaction withmagnetized plasmas that enables physics insights and a quantitative understanding ofa wide range of radio frequency - plasma interactions Jaeger et al. (2002).The spatial data is obtained from the All-Orders Spectral Algorithm(AORSA) computer model for electromagnet wave interaction with magnetizedplasmas that enables physics insights and a quantitative understanding of a wide rangeof radio frequency - plasma interactions Jaeger et al. (2002). Plasma is the fourth stateof matter (solid, liquid, gas, plasma). It is also the most common state of matter,making up 99% of the visible universe. Best known examples of plasma includeflames, lightning, neon signs and fluorescent lights, and the aurora borealis.A typical AORSA computational experiment at the Oak Ridge NationalLaboratory (ORNL) runs for many hours on a large parallel supercomputer andproduces large amounts of data.7
Figure 2: Integrated simulation & optimization of fusion systemsWe selected a subset of the data that describes radio frequency heating oftokamak plasma. A tokamak is a toroidal vessel (imagine a fat doughnut) whereelectromagnetically confined plasma is radio frequency heated to fusion temperatures.Our data set consists of four quasi-linear diffusion coefficients, b, c, e, and f, with2units of vs (velocity squared per second). Coefficient values are obtained byaveraging around tubes of radius for given u (perpendicular velocity) andu (parallel velocity). Imagine doughnut-shaped shells of tube radius and binnedaccording to perpendicular and parallel plasma velocities u u . We cluster thefour diffusion coefficients by pooling data over u u 32 65 129 for a totalof 268, 320 observations. The spatial dimensions u u can be used to map theresulting clusters and interpret the mapped results.This data set was chosen because itrepresents a particularly difficult situation for an automated clustering algorithm whileproviding visually stunning clusters. It is a difficult data set not only because it islarge but also because cluster sizes range across several scales. Here we considerclustering the diffusion coefficient data and leave the mapping in the u u space to a separate project.8
CHAPTER 3METHODS3.1Hierarchical Clustering Using FDAWe propose to implement a hierarchical clustering algorithm for proteomicsdata using functional data analysis, which consists of detecting hidden groupstructures within a functional data set. We apply a new dissimilarity measure to thesmoothed ( transformed) proteomics functions i . Then we develop a new metric thatcalculates the dissimilarity between different curves produced by protein expression.The development of metrics for curve and time series models was first addressed byPiccolo and Corduas 1990 . Heckman and Zamar proposed a dissimilarity measure HZ for clustering curves (2000 . Their dissimilarity measure considers curve i i be theinvariance under monotone transformations. Let i i 1 , 2 , . . . , micollection of the estimated points where the curve i t has a local maximum and letm i be the number of maximal per observation or per sample i . HZ is defined as: HZ i, l mi i r i j 1j r mi i r i j 1j r 2 l r l j r mlr l r l j 12where i i r i j k j u j /2, i i k i j # i, i j , i i u i j # i, i j r m1i i mi r i j j 1This measure is powerful for regression curves which are mainly monotone.On the other hand, Cerioli et al. 2003 , propose a dissimilarity measure C extendingthe one proposed by Ingrassia et al. 2003 . Cerioli’s dissimilarity C is defined by:9
mid i, l j 1 l i j j , l j mi l i l j : j j min, i 1, . . , nd il d li2 C i, l Both dissimilarity measures shows good performance for time series data.Dissimilarity C does not involve all the indices m i of the smoothed curve. It also usesthe shortest distance between curves by involving few data points obtained by FDAsmoothing.A flexible dissimilarity measure is the one that may combine the characteristicof both measures HZ and C . This means that a potential dissimilarity measureshould use the collected estimated points of the original curve obtained from FDA sothat no information is lost and should work on different type of smoothed curveswithout using the monotonicity restriction.In this sense, we propose a functional-based dissimilarity B measure whichuses the rank of the curve proposed by Heckman and Zamar and generalizes Cerioli etal. dissimilarity measure as the following:mid il j 1r l j l r i j r j ,miml l r i h 1j r h ml i i i i i r i j k j u j /2 and k j # i, i j i i 1 i u i j # i, i j and r m imi r i j j 1Obviously, d ii 0 and d il 0, if i and l have the same shape (T i T l .We can adjust the formula above to obtain a dissimilarity measure that satisfiessymmetry, by taking B as our proposed dissimilarity measure: B i, l d il d li2We used three powerful hierarchical methods to derive clusters or patternsusing B and we compare the performance of B to C and HZ . The hierarchicalalgorithms we used are (1) Pam which partitions the data into different clusters“around their medoids”, (2) Clara works as in ‘Pam’. Once the number of clusters isspecified and representative objects have been selected from the sub-dataset, eachobservation of the entire dataset is assigned to the nearest medoid. The sum of thedissimilarities of the observations to their closest medoid is used as a measure of the10
quality of the clustering. The sub-dataset for which the sum is minimal, is retained.Each sub-dataset is forced to contain the medoids obtained from the best sub-datasetuntil then, (3) Diana is probably unique in computing a divisive hierarchy, whereasmost other software for hierarchical clustering is agglomerative. Moreover, ’Diana’provides the divisive coefficient which measures the amount of clustering structurefound. The ’Diana’-algorithm constructs a hierarchy of clustering starting with onelarge cluster containing all n observations. Clusters are divided until each clustercontains only a single observation. At each stage, the cluster with the largest diameteris selected.3.2Model-Based Cluster AnalysisIn cluster analysis, we consider the problem of determining the structure ofthe data with respect to clusters when no information other than the observed values isavailable; from the extensive literature, we mention Hartigan (1975), Gordon (1999),and Kaufman and Rousseeuw (1990). Important references on the statistical aspects ofcluster analysis include MacQueen (1967) , Wolfe(1978), Scott and Symons (1971),and Bock(1985). Various strategies for simultaneous determinating of the number ofclusters and the cluster membership have been proposed (e.g. Engelman and Hartigan(1969)); Bozdogan 1993), for a review see Bock (1996). An alternative is described inthis paper based on the reparameterization of the covariance matrices using a fullyBayesian framework.Mixture models provide a useful statistical frame of reference for clusteranalysis. The Bayesian approach is promising for a variety of mixture models, bothGaussian and non Gaussian (Binder, 1981; Banfield and Raftery, 1993; McLachlanand Peel, 2000, Ch. 4).Banfield and Raftery (1993) –hereafter BR– introduced a new approach tocluster analysis based on a mixture of multivariate normal distributions, where thecovariance matrices k in the classes are modelled in a geometrically interpretableway. Their approach
Algorithms and Datamining for Clustering Massive Datasets". I have examined the final electronic copy of this thesis for form and content and recommend that it be . data mining spatial databases finds its roots from the concept of data mining relational and transactional databases. Knowledge discovery in large multi-scale databases has