Transcription
AMPM3 Criteria of Algorithm Summation for ClassifyingDatamining of Software Quality ManagementKattiya T. Yangyuen1*, Tipaporn Suppamit2, Surasak Mungsing21RattanaBundit University, 306 Ladproud Rd., Bangkapi, Bangkok, Thailand.of Information Technology, Sripatum University, 2410, 2 Phahonytthin Rd., Senanikhon, Chatuchuck,Thailand.2School* Corresponding author. Tel.: 063-652 4642; email: kattiya.kty@gmail.comManuscript submitted July 24, 2018; accepted March 8, 2018.doi: 10.17706/jsw.14.1.36-46Abstract: This research has the objective to present the algorithm summation method of AMPM3 criteriafor reducing attributes in data mining classification of software quality management. Moreover, theprograms used to analyze in this research are WE-KA and MATLAB and the techniques used to predict theequation and the accuracy are Decision Tree, Rule-Based, Naïve Bayesian and KNN. Besides, the results ofanalyzing the Algorithm with AMPM3 criteria are to reduce the attributes from searching from therelationship of regression analyzing and the regression analysis that are the analyzing from therelationships between 2 variables for finding the similarities between questions and model documents bysearching from the patterns of designing. Then, it has the steps as these following: 1) Preparation ofInformation 2) Selection of Information 3) Practicing Information Set and Test 4) Processing of Information5) Creation of Model for analyzing the information relationship and effectiveness measurement to reduceattributions.Key Words: Reducing of attributes, classifying of information, software quality management.1. IntroductionNowadays, it has seen the difficulty of the software manufacturing management project obviously in the formof software or intangible product. However, the definitions of software including of software document can beseen clearly when comparing to the building project or the automobile manufacturing project as the tangibleproduct. Thus, the software project executives can’t notice for the clear effects. Currently, it has much difficulty ofoperation for software project management or the intangible product although it has given the definition of thesoftware including of the softwareProcedure for Paper Submission documents when comparing to the buildingproject or the automatic manufacturing project as the tangible project to see it clearly. Thus, the executives of thesoftware project won’t notice for the obvious effects. According to this reason, the researcher will propose forthe new concept idea for reducing the attributes of classification for the data mining of software qualitymanagement. However, according to the Algorithm Summation of AMPM3 criteria with analyzing to differencemeasurement or the dispersing of information, it was found that the Search Algorithm and AMPM3 criteria canindicate that the characteristic of information has the relationship pattern relevantly to the reducing ofattributes. On the other hand, the reducing of attributes hasn’t affected to the software quality managementalthough it has proved from the ordinary homogenous linear equation on rank n by considering the answer of itthat y c1 y1 c2 y2 . In addition, according to the answer of the homogenous equation of c2 0 , it results to36Volume 14, Number 1, January 2019
the answer from multiplying with the constant values to gain the same answer that y1 , y2 , , ym as the answer ofthe ordinary homogenous linear. Moreover, the value of c1 , c2 , , cm are the constant values of this equationanswer with y c1 y1 c2 y2 cm ym , as same as the answer of the above homogenous linear equation. Thisresearch has the structures as this following: literature review and relevant researches, research patterns,results and conclusion.2. Literature Review and Relevant ResearchesAccording to studying the theories and relevant researches, it can make understand about the principles ofeach theory to apply in this research. Moreover, it comprises with the software quality management , thetechniques of Decision Tree, Rule-base, Naïve BayesianUnits and KNN and the relevant researches with theexplanation details as this following:2.1. Software Quality ManagementThe Software quality management refers to all management activities to be determined as the quality policies,objectives and quality responsibility. Then, it can bring to apply with methods, such as quality planning, qualityassurance, quality controlling and quality development. [1] However, the software quality management is theway to bring the work in the part of software quality management, such as software product processes andapplying resources to apply. [2] Similarly, it can determine the standards and work processes in the proper wayno matter of the small or the large system. Consequently, it is vital to bring the software quality management toapply with the difference for only the work scopes. In addition, for the large system of software qualitymanagement and the activities as this following:a)Quality PlanningThe quality planning setup process for the project. Then, inside this work plan it should determine thedefinitions of these quality software attributes and explain these quality assessment methods to be selected bythe teamwork with the suitable standard for each product and process to take assessment.b)Quality assuranceThe quality assurance is still the way to maintain the product quality for the manufacturing and themaintenance times. Then, it has operated with activities in each step to make the software test activity to be theimportant one for quality assurance. Moreover, the important thing of quality assurance is to determine thestandard for applying in manufacturing process and bringing to apply with software products.c)Quality controlThe quality review of documents and the software processes have been operated by the teamwork withassignments. Then, the teamwork will check whether the project has been operated with the standard includingof checking whether the documents and the software products have been used directed to the standard. Besides,it will check whether each value has deviated from the standard for recording information. Then, the executivescan inform to the responsible people about the mistakes. Therefore, it includes of models, processes, test plans,configuration management processes, process standards, manuals and others. However, the comparison ofdocument quality and the software products are in the good standard. Moreover, it can use the automatedsoftware tool by spending less time than the first method. On the same way, it is the method to be made with thecomparison. Consequently, it should measure the software attributes to bring the gained values which are mostlyin the quantity ones for comparing to the standard to take assessment of the software easier. Then, themeasurement of software attributes is relevantly to the software assessment to control the software quality.d)Management oversightImprovement procedures are in place and utilized. Lessons learned are regularly examined and used toimprove documented process. Projects are given high value within the organization, thus there is high visibility37Volume 14, Number 1, January 2019
to the individuals who are actively involved in projects on a regular basis. All project, changes, and issues areevaluated based upon efficiency and effectiveness metrics and management takes an active role in managementoversight and executive sponsorship of projects within the organization.e)Awareness and supportAn improvement process is in place to continuously improve management awareness and support ofcorporate project and their need. Leeson learned are capture and used to improve the monitoring and controlefforts. Projects are managed with consideration as to how the project performed in the past.f)InvolvementAn improvement process is in place to continuously improve management‘s involvement in the process ofmanaging projects. Leeson learned are capture and used to improve the monitoring and control efforts.Management uses the data obtained from the efficiency and effectiveness metrics for projects to make decisions.2.2. Search AlgorithmIt has searched for the finding of similarities between questions and model documents with the pattern ofdesigning. Moreover, it has selected the regression analyzing and regression analysis from correlation bycalculating of similarities. In addition, each procedure of regression analyzing is replaced by Means ofindependent variable and the information of the document is replaced by Means of dependent variable for index.Similarly, the independent variable is matched with the dependent variable and it has calculated for finding thesimilarities value between questions and index of document.a)Regression Analysis of AlgorithmRegression relationship analysis is the relationship analysis between 2 variables that are X and Y variableswith linear relationship. Moreover, it has the regression equation that is 𝑌 𝛼 𝛽𝑥. Thus, Y is the Meanswithout being each value of Y because the simple regression analysis should have X variable to be determinedthe value first. Similarly, Y value will change with X variables. Then, when bringing all X and Y values to plot onthe axis of X and Y and line up between the dot appearing on the graph line as the straight line, it shows of therelationship between the Means of X and Y variables. In addition, it is the regression line, so it can write theregression equations simply by finding a and b values from these at 𝑎 𝑌̅ 𝑏𝑋̅ and 𝑏 𝑥𝑦 / 𝑥 2b)Regression Analysis from Correlation Co-efficientIt has predicted to find the dependent value from Y variable with the changing of independent value.Furthermore, it can analyze the regression analysis to predict from 2 variables of r-correlation coefficient. Then,it can make the prediction of regression analysis without depending on constant value of a and the regressioncoefficient. However, it has the necessity to know about the standard aviation of 2 variables in order to find thescores of prediction the dependent variable from the equations with these following:𝑌 𝑌̅ 𝑟𝑆𝑌(𝑋 𝑋̅)𝑆𝑋2.3. Selection of the Property on the Basis of RelationshipThe selection of attribution property to be considered on the basis of relationship (Correlation-based featureselection: Cfs) [9] is to find the attribute group for taking assessment for the values of the expectation ability. Inaddition, it is selected to classify the information type for managing with not involved attributes. Thus, it makesthe effectiveness of type classification to be low and it can find the equation as this following:𝑀𝑒𝑟𝑖𝑡𝑠 𝑘𝑟̅̅̅̅𝑐𝑓 𝑘 𝑘(𝑘 1)𝑟̅̅̅̅𝑓𝑓𝑀𝑒𝑟𝑖𝑡𝑠 is Heuristic as the group of Attribute S comprising of k attribute to be selected.38Volume 14, Number 1, January 2019
𝑟𝑐𝑓is the Means of the group of Attribute to be selected with the relevant relationship of information type.𝑟𝑓𝑓̅̅̅̅is the Means of the group of Attribute to be selected from relevant relationship inside the group ofAttribute.a)AMPM3 CriteriaApply model project management maturity model (AMPM3) criteria is the way to present the method ofAlgorithm summation technique to indicate of the relationship between information. Besides, it should measurethe differences or disperse information. Then, if the information is varied much, the values to be calculated willbe higher. On the other hand, if the information is in similar way, the value will be in the low way. On the otherhand, with the calculating of AMPM3 criteria Algorithm it is the calculation to find the value with the beginningnode. Additionally, it has applied as the tree roots between Information GAIN and Cellular automata. Therefore,the researcher can make the assumption that the value of AMPM3 criteria can give the accuracy value with thehighest value of equation. Thus, it can find the relationship to reduce the information of attributes. As the result,the researcher can present the Algorithm of AMPM3 criteria by searching the rules of relationship and it has theequations to apply in AMPM3 criteria as these following:The first equation of Information Gain is as this following:Entropy(𝑦, 𝑆) 𝜎𝑦 𝑐𝑗 𝑆 𝑐𝑗 𝜖 𝑑𝑜𝑚 (𝑦) 𝑆 . 𝑙𝑜𝑔2 𝜎𝑦 𝑐𝑗 𝑆 𝑆 And, the second equation of Cellular automata is as this following:𝑆𝑖 𝑡 1 𝑓𝑖 (𝑠 𝑡 neighborhood )Thus, it can setup the pattern of AMPM3 criteria that is as the equation with this following:AMPM3 criteria (𝑆, 𝑉) 1 [ 𝑐𝑗 𝜖 𝑑𝑜𝑚 (𝑦) 𝜎𝑦 𝑐𝑗 𝑆 2 𝑙𝑜𝑔2 () ] 𝑓𝑖 (𝑠 𝑡 𝑛𝑒𝑖𝑔ℎ𝑏𝑜𝑟ℎ𝑜𝑜𝑑 ) 𝑞(𝑠)𝑦 𝑆 However, Form equation Thus, it can be formatted in a manner of linear equations, and differential equationslevel second this following:Or𝑦 " 𝑝(𝑥)𝑦 ′ 𝑞(𝑥)𝑦 𝑟(𝑥)𝑑2𝑦𝑑𝑦 𝑝(𝑥) 𝑞(𝑥)𝑦 𝑟(𝑥)2𝑑𝑥𝑑𝑥The equation is as follows: If it is the case. 𝑟(𝑥) 0 . It is A homogeneous equation (Homogeneous) and it canwrite an equation this following:𝑑2𝑦𝑑𝑦 𝑝(𝑥) 𝑞(𝑥)𝑦 02𝑑𝑥𝑑𝑥And the consideration can be written as ordinary differential equations level n. The equation will be availablein written form below.𝑎0 (𝑥)𝑦 𝑛 𝑎1 (𝑥)𝑦 𝑛 1 𝑎𝑛 1 (𝑥)𝑦 ′ 𝑎𝑛 (𝑥)𝑦 02.4. Decision Tree is the Step of Decision Tree39Volume 14, Number 1, January 2019
method as one technique to estimate the Discrete-value function. Then, it has comprised with the sets ofregulations, such as if-then by creating the model of decision tree to select the attributes with the relationship ofclass at most. In addition, it can be the top tree (root node). After that, it can find the next attribute continuouslyfor gaining the relationship of attribute to measurement called as Information Gain (IG). Furthermore, thiscalculated value has come from the equation as this following:entropy (𝑐1 ) 𝑝 (𝑐1 ) 𝑙𝑜𝑔 𝑝 (𝑐1 ) , 𝑝(𝑐1 )It is the possibility of 𝑐1 and then we will try to calculate for each attribute comparing with class to find theattribute with most IG value following by root of decision tree.2.5. Rule-Based Is the Decision Tree to Be Created in Large SizeThen, it results in the complexity of interpreting. Additionally, with this cause the extraction of the decisiontree rule is designed to create in the form of “IF-THEN” to make understand easily. Besides, it should create onerule from each branch of tree beginning from the root node to the leave node. Similarly, each attribute in thebranch is in the part of “IF” and leave node is in the part of “THEN”, respectively.2.6. Naïve Bayesian Is the Method to Solve the Problemswith classification for making prediction of results and explain the Naïve Bayesian technique to gain the goodand rapid result with simplicity and rapidness by using the equation as this following:𝑃(𝐻 𝑋) 𝑃(𝑋 𝐻) 𝑃(𝐻)𝑃(𝑋)2.7. KNN, K-Nearest Neighboris the method to find the similarities by using the theory to measure distance. Then, it should consider fromthe least distance of 1-2 suitable numbers. After that, it can bring to solve the problem of Non-ParametricEstimation with classification. As the result, this dispersing information is setup to consider that which point isclosed with any point at most by using the equation as this following:ndist (pk qk )2k 13. MethodologyThis research has presented about the factorial procedure analysis to develop the software qualitymanagement. Then, it has applied the relationship rule of regression analysis for algorithm as the detail ofrequirements and behaviors of the executives in the software project. Besides, it has the procedures inrelationship analysis and making comparison to reduce the attributes as this following:3.1.Pre-processingAccording to the information from questionnaires of the basic source, it can analyze this information toprepare the pre-processing. Then, it can prepare for process the result with correctness and accuracy. Besides,the researcher has focused on the part of factorial information of software quality with the steps as this following:1) The extraction of missing data to gain the most important information only 2) The separation of informationfrom the questionnaires with the same subject or in the similarities as the partition data. 3) It can make datatransform to give the correct answer equally to “1” as the main reason. Similarly, it can cut the non-relevantanswer in the form of “Don’t care”. In addition, other answers can indicate to the denying which isn’t beneficial tofind the relationship of information. Then, it results to the dividing of 2 main ones with 825 records as the mainfunction for applying the software quality management. Significantly, it has 6 attributes with the required groups40Volume 14, Number 1, January 2019
and 15 attributes of the software quality for general behaviors.3.2.Information SelectionInformation Selection is the selection in the pattern of selecting column with quite full information. Moreover,in each column it should have the value for every row as the same one. Besides, the value in each columnshouldn’t be repetitive, but it should edit information to be correct and perfect. Thus, it should adjustinformation to be suitable for making decision and setup the information group to reduce the dispersing ofinformation. Therefore, it can find the Means to collect samples of questionnaires prior to find the Means toestimate the values of population or 𝜇. As the result, it should determine the Confidence Interval on the Mean:Variance known is 𝑙 𝜇 𝑢 When 𝑙 is Lower limit and 𝑢 is upper limit, we are called as “Two-sided Confidenceinterval” by finding the Median of populations inside limit from the solution is 𝑃(𝐿 𝜇 𝑈) 1 𝛼 .thus, Inthis case 𝛼 is Error risk or the value to refer to the risk from prediction the value of 𝜇 with error, the reliabilityvalue and the risk value are 100(1 𝛼)% or called as the percent of reliability. Similarly, it has the value calledas One-sided confidence interval with the solution is 𝜇 . So that, according to the above solution, we are calledas lower-confidence interval with the value of 𝑙 or called as lower limit with this following 𝜇 𝑢 andaccording to the above solution, it is called as upper-confidence interval by the value of 𝑢 is the value of upperlimit. Thus, the value 100(1 𝛼)% is called as the reliability of parameter m. When we refer to the theory ofSampling distribution for mean, it has the median value of m and the dispersing value equally to 𝜎 2 /𝑛 .Therefore, it has the value is 𝑍 𝑥̅ 𝜇 /𝜎/ 𝑛 When disperse value as Normal, the value 𝛼 should be dividedby 2. So that In the case of finding Two-sided confidence interval from the figure, it can be concluded as thisfollowing𝑃 { 𝑍𝜎 2 𝑍 𝑍𝜎 2 } 1 𝛼When replace with the value z, it has the value as this following:𝑥̅ 𝜇𝑃 { 𝑍𝜎 2 𝜎 𝑍𝜎 2 } 1 𝛼 𝑛 According to the setting up of the new solution, it has the value as this following:𝑃 {𝑥̅ 𝑍𝜎 2 𝜇 𝑥̅ 𝑍𝜎 2 } 1 𝛼 𝑛 𝑛3.3.Preparation of Information Set to Practicing and TestingIt is the preparation setup to gain the most perfect information which can bring the preparation information todivide into 2 groups that are the practicing set and testing set with these details:1.Practicing Set : it can divide into 2 of 3 ratios of all information.2.Testing Set: it can divide into 1 of 3 ratios of all information.3.4.Processing of InformationThe processing of information for both practicing sets and tests have applied WE-KA program and MATLABprogram to make comparison of the accuracy and the correctness in making prediction of the software qualitymanagement.3.5. The Creation of Model for the Relationship Analysis of Information and theEffectiveness Measurement of Reducing AttributesAfter it has passed the procedure of preparation, selection and processing of information from questionnairesources, the researcher has created the procedure model for analyzing and measuring effectiveness. Thus, it canreduce the attributes with 3 parts of presentation as this following:It can bring the information from the result of Pre-Process to classify in the information parts in the procedureof factorial analysis to develop the software quality management. After that, it can bring the information into theprocedure to find the relationship rule of regression. Then, it can classify this information as the result dividinginto the minor parts as the main function to apply the software quality management. Additionally, it includes41Volume 14, Number 1, January 2019
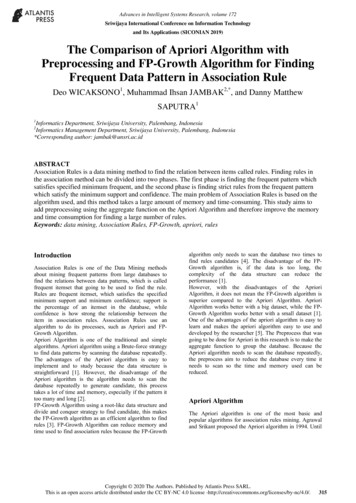
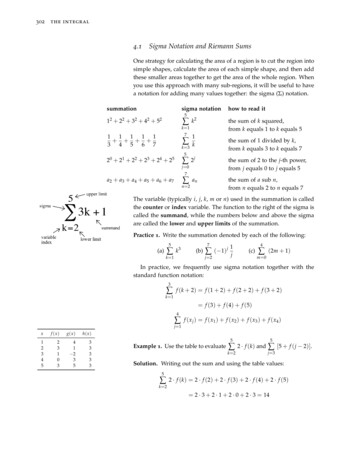
with the required groups and behaviors of applying the software quality management. Furthermore, theresearcher has made the assumption that the result from this procedure can indicate with the reducing of theattribute numbers with better effectiveness.The procedure to reduce attributes can be applied with the method of algorithm summation as AMPM3Criteria. Significantly, it is the technique to indicate of the relationship between information to measure thedifferences or the dispersing of information. Then, if it has more differences of the value, the value to becalculated will be higher. Oppositely, if the information has many similarities, the values will be low. Therefore,the information combined to this procedure is in the same information with the heading of 3.5.2 because thisprocedure is the way to find the result from the characteristic of each attribute or the dimension of informationand it should remember about the differences of each attribute.The measurement procedure and the comparing of effectiveness between the regression Algorithmrelationship rule and AMPM3 Criteria is the way to reduce the dimension of information. Moreover, thisprocedure is as the result of the heading 3.5.1 and the heading of 3.5.2.4. ResultAccording to the result, this research can make prediction of the software quality management by processingwith the assumption. Besides, it has applied WE-KA program and MATLAB program which the result to beanalyzed and compared the result on this research can divide into 2 parts as this following:Software quality ManagementComparison of Technique and Main Factor to Reduce Dimensions of InformationPart A: Software quality ManagementThe assessment for testing the search Algorithm and AMPM3 Criteria. Then, the researcher will present theAlgorithm Summation to take assessment and discuss with the result as this following:According to the testing of relationship for information by testing the search algorithm, it can indicate with thedirection to develop the quality software management. Moreover, it has the information to emphasize on 21attributesPart B: Comparison of Technique with the Main Factor to Reduce Attributes1.000.500.000204060Fig. 1. Information of quality planning.According to the explanation of Fig. 1, the comparison of the data mining for quality planning in applyingamong the techniques of Decision Tree, Rule- Based, Naïve Bayesian and KNN. Besides, it was found that theaccuracy , the validity , the reliability , the overall of effectiveness and ROC values with applying the techniques ofDecision Tree and Rule-Bases were in similar way. However, according to the result of Rule-Based value, it wasfound the high level with the Means of 89 percent and the increasing Means with 92 percent. Besides, accordingto the selection of information totally 2 in 3, it affected to the learning information without equality for each class.Thus, if in each class it has the practicing information numbers more than another class, it reflects to that class tohave the best result of test.42Volume 14, Number 1, January 2019
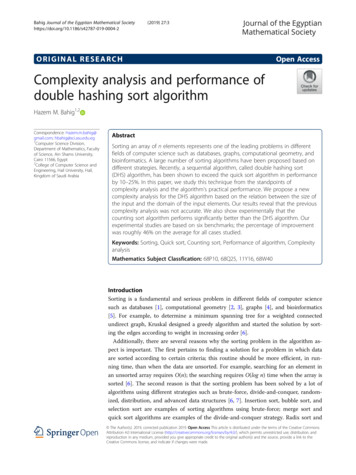
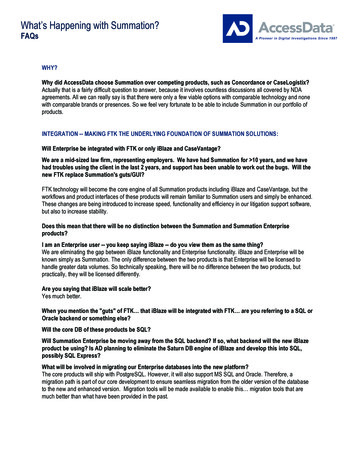
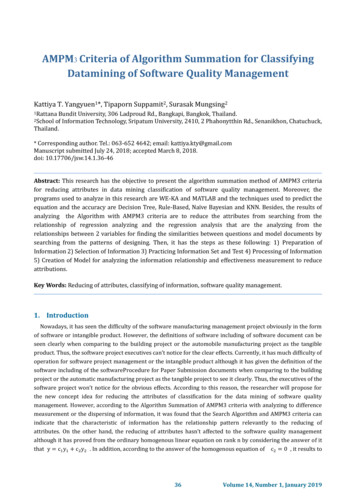
100.0050.000.0001020304050Fig. 2. Information quality assurance.According to the explanation of Fig. 2, the comparison of the data mining for Information quality assurance inapplying among the techniques of Decision Tree, Rule-Based, Naïve Bayesian and KNN. Besides, it was found thatthe accuracy, the validity, the reliability, the overall of effectiveness and ROC values with applying the techniqueof Decision Tree were quite high with the Means of 68 percent and the increasing Means with 75 percent.Besides, according to the selection of information totally 1 in 3, it affected to the learning information withoutequality for each class. Thus, if in each class it has the practicing information numbers more than another class, itreflects to that class to have the best result of test.1.000.500.000204060Fig. 3. Information of quality control.According to the explanation of Fig. 3, the comparison of the data mining for information quality control inapplying among the techniques of Decision Tree, Rule-Based, Naïve Bayesian and KNN. Besides, it was found thatthe accuracy, the validity, the reliability, the overall of effectiveness and ROC values with applying the techniqueof Decision Tree were quite high with the Means of 78 percent and the increasing Means with 80 percent.Besides, according to the selection of information totally 1 in 3, it affected to the learning information withoutequality for each class. Thus, if in each class it has the practicing information numbers more than another class, itreflects to that class to have the best result of test.5. ResearchThe technique for data classifying namely naïve bayes random forest (NBRF) [17] The decision process startsby extracting the difficult designate data, if any and follows by a construction of learning model for reclassifyingthem. There are research performed the first step by using two algorithms; the naïve bayes paralleled with therandom forest. The data getting different answers from the two algorithms will be selection as the difficultdesignate data. These data are lying around the border of the different classes. The experiments performed on 10benchmarks; 6 sets are synthesized data including clus 1000, clus200, rand1000, rand200, pat1 and pat2 data,and 4 sets are real world data including vowel, hepato, iris and kla-azar data. The result showed that the NBRFtechnique outperformed the existing model. The average performance of NBRF is better than those of fuzzyc-mean random forest 4.81%, fuzzy c-mean decision tree 13.57%, random forest 3.91%, naïve bayes 17.15%, andFCM 35.54%The efficiency of stock trading signal prediction is an enhancement factor for the investor to get more gainfrom their decision making. [18] Applied the computer intelligence approach for trading signal predictiongenerating which the method of discovered the hidden pattern cluster, which represent the characterization oftrading significant, in dynamical multi - dimensional phase space by genetic algorithm is the proposed approachin this paper. The hidden pattern is a set of data, lying which in the hyper sphere radius of which the present datapoint is the center. Instead of searching overall area of phase space, using the last point of data as the center of43Volume 14, Number 1, January 2019
hyper sphere is the method that improved the better solution for stock prediction problem and saving the accesstime for machine operation as the same time. This approach is so called “locality-based genetic algorithm”. Inlocal pattern evaluation process, the k-nearest neighbor algorithm and applied singular value decompositionwith principal component regression are introduced to reduce the noise and obtain more resilience for theprediction solution. The result shows that these methods can outperform the accuracy rate of prediction; theaverage rate is more than 60% of trading decision making.The model of automated web services composition by using rule-based engine.[19] Rules are modeledaccording to user’s preferences and learnt from business constraints. The services are composed automaticallyby these rules. Consequently, it generates BPEL document which match exactly with user’s requirements and isable to proceed on BPEL engine.The method to data classification of malaria in plasmodium vivax by texture features and k-nearest neighbor(KNN) [20]. The basic idea is to segment blood cell image and to classify a species of malaria in plasmodiumvivax. The segmentation of blood cell image used texture features and fuzzy c-mean. The texture features insegmentation are derived by using gray level co-occurrence matrix. The data classification used texture featuresand k-nearest neighbor. The texture features in classification is derived by law’s texture. Resulted from law’stexture have 25%, so the sequential backward selection which is suboptimal searching techniques for selectingtexture features for law’s texture. The species of plasmodium vivax is classified by k-nearest neighbor. In ourexperiment, 32 images are tested and compared with expert physical. The results show that our techniqueperforms to data classification correctly more than 81%.The optimal inventory of the short-shelve life products is very important. These products are required onaccurate sale forecast; in other words, maintaining the inventory for products those responses to the customerdemand [21]. Since the product inventory affects the financial flow of the company both from revenue ofproducts out of date. This study, the apply rule-based expert system to improve the accuracy of forecastcompared to those in the literature using some statistical techniques alone. The demand of green cabbage for themodern trade store is used for our case study. The results have shown that the proposed rule based forecastingtechnique can simulate the product demand more accurate and thus can be used as a decision support tool toincrease the operational profit of the company.6. ConclusionAccording to the comparison of technique Decision Tree, Rule-Based, Naïve Bayesian and KNN, it has appliedWE-KA and MATLAB programs. Moreover, it was found that the analysis of Algorithm summation for AMPM3criteria is used for the data mining classification of the software quality management. Then, according to theanalyzing of each technique to gain much accuracy result with the correctness of the software qualitymanagement, it should have the Means of 63percent, 45percent and 85 percent, respectively. However, according tothe AMPM3 criteria analyz
AMPM3 Criteria of Algorithm Summation for Classifying Datamining of Software Quality Management Kattiya T. Yangyuen1*, Tipaporn Suppamit 2, Surasak Mungsing 1Rattana Bundit University, 306 Ladproud Rd., Bangkapi, Bangkok, Thailand. 2School of Information Technology, Sripatum University, 2410, 2 Phahonytthin Rd., Senanikhon, Chatuchuck, Thailand. * Corresponding author.