Transcription
NetCDF TutorialCopyright 1995-2010 Esri All rights reserved.
NetCDF TutorialTable of ContentsAbout the netCDF Tutorial . . . . . . . . . . . . . . . . . . . . . . . . . . . . . . . 3Exercise 1: Displaying a raster layer from a netCDF file. . . . . . . . . . . . . . . . . . . 4Exercise 2: Creating a temperature table at a specific location . . . . . . . . . . . . . . . . . 8Exercise 3: Finding temperature difference between two time steps . . . . . . . . . . . . . . . 11Copyright 1995-2010 Esri. All rights reserved.2
NetCDF TutorialAbout the netCDF TutorialNetwork Common Data Form (netCDF) is a file format for storing multidimensional scientific data (variables)such as temperature, humidity, pressure, wind speed, and direction. You can use tools from theMultidimension Tools toolbox to create a raster layer, a feature layer, and a table view from a netCDF file. Youcan change the display by selecting a specific dimension value from the properties dialog box or by runningthe Select by Dimension geoprocessing tool. You can also perform analysis using a layer or table view createdfrom a netCDF file.Tutorial scenarioThe tutorial data, a netCDF file, contains derived data from an atmospheric model simulation. The threedimensional variable tmin represents the annual minimum temperature for winter seasons. In addition to lonand lat dimensions, the variable tmin also has year, a third dimension to represent time steps.This tutorial is divided into three exercises and is designed to allow you to explore the multidimension toolsand the netCDF-related functionality in ArcGIS at your own pace. In exercise 1, you'll copy the tutorial data locally and create a raster layer from a netCDF file. You'llthen change the display by selecting a different time step. In exercise 2, you'll create a temperature time series table for a specific location. In exercise 3, you'll create a model to find the temperature difference between two time steps.You will need approximately 45 minutes of focused time to complete the tutorial. Alternatively, you canperform the exercises in sequence one at a time, saving your results along the way when recommended.Copyright 1995-2010 Esri. All rights reserved.3
NetCDF TutorialExercise 1: Displaying a raster layer from a netCDF fileYou'll locate the Make NetCDF Raster Layer tool and create a raster layerusing a variable from a netCDF file. You'll then change the display byselecting a different time step. This exercise will take approximately 15minutes to complete.Copying tutorial dataComplexity:BeginnerData Requirement:ArcGIS Tutorial Data SetupData Path:C:\arcgis\ArcTutor\NetCDFGoal:Create a raster layer from a netCDF file.Before working with multidimension tools, you'll organize your tutorial data.Steps:1.Open Windows Explorer. You can use the shortcut key combination Windows logo key E toopen it.2.Navigate to the location where you installed the tutorial data; for example, if you installed ArcGISon your C drive, navigate to C:\arcgis\ArcTutor.3.Right-click the NetCDF folder and click Copy.4.Right-click the C drive (or an alternative location) in Windows Explorer and click Paste.Making a netCDF raster layerYou'll run the Make NetCDF Raster Layer tool to create a raster layer using the tmin variable from thetemperature.nc netCDF file.Steps:1.Start ArcMap by either double-clicking a shortcut installed on your desktop or using the AllPrograms list on the Start menu.2.Click OK on the ArcMap startup dialog box.3.Open the Make NetCDF Raster Layer tool.Note: Use the Search window to locate the Make NetCDF Raster Layertool.a.Click Searchb.Choose Tools.c.Type Make NetCDF Raster Layer.d.Click the magnifying glass icon.e.Click the Make NetCDF Raster Layer tool in the list.Copyright 1995-2010 Esri. All rights reserved.4
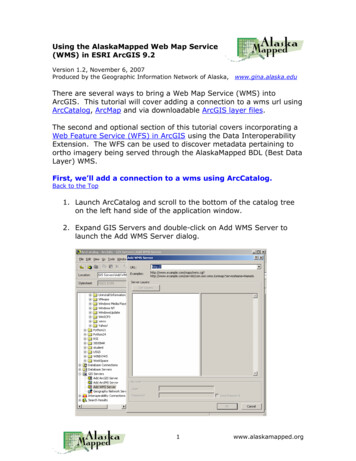
NetCDF Tutorial4.For the Input netCDF File value, type or browse to C:\NetCDF\temperature.nc.5.Accept default values for Variable (tmin), X Dimension (lon), and Y Dimension (lat)parameters.6.Type Minimum Temperature in the Output Raster Layer text box.7.Click OK to run the tool.The Minimum Temperature raster layer is added to ArcMap. It displays the winter minimum temperature ofthe year 1875, which is the default (first) time step. Note that the maximum and minimum and temperaturevalues in the table of contents are 27.6854 and -59.0669, respectively.Copyright 1995-2010 Esri. All rights reserved.5
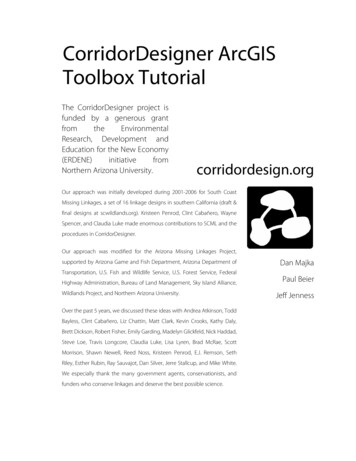
NetCDF TutorialDisplaying a specific time stepThe raster layer is displayed using the default time step, which is 1/1/1875. You'll change the display toshow the minimum winter temperature of the year 1940 by changing the time step on the Layer Propertiesdialog box.Steps:1.Right-click the Minimum Temperature layer in the table of contents and click Properties.2.Click the NetCDF tab.3.Click the cell next to Year under the Value column. An arrow appears.4.Click the arrow and choose 1/1/1940.5.Click OK on the Layer Properties dialog box.The Minimum Temperature layer now displays the winter minimum temperature of 1940. Note that themaximum and minimum temperatures have changed to 28.153 and -60.2398, respectively.Copyright 1995-2010 Esri. All rights reserved.6
NetCDF TutorialReturning to the default time stepYou can return to the default (the first) time step by changing the time dimension value on the LayerProperties dialog box, or you can run the Select by Dimension tool.Steps:1.Open the Select by Dimension tool.2.For the Input Layer or Table value, choose Minimum Temperature from the drop-down list.3.Accept default values for all other parameters.4.Click OK to run the tool.The display of the Minimum Temperature layer is back to the default time step (in other words, the winterminimum temperature of 1875). Note that the maximum and minimum temperatures are now back to27.6854 and -59.0669, respectively.Copyright 1995-2010 Esri. All rights reserved.7
NetCDF TutorialExercise 2: Creating a temperature table at a specificlocationYou'll locate the Make NetCDF Table View tool and create a table view usinga variable from a netCDF file. You'll then create a temperature profile fromthe table. This exercise will take approximately 10 minutes to complete.Making a netCDF table viewComplexity:BeginnerData Requirement:ArcGIS Tutorial Data SetupData Path:C:\arcgis\ArcTutor\NetCDFGoal:Create a table from a netCDF file.Run the Make NetCDF Table View tool to create a temperature timeseries table at a specific location using the tmin variable from thetemperature.nc netCDF file.Steps:1.Open the Make NetCDF Table View tool.2.For the Input netCDF File value, type or browse to C:\NetCDF\temperature.nc.3.Click the Variables arrow and choose the tmin variable.4.Type Temperature for Output Table View.5.Click the Row Dimensions arrow and choose the year dimension.6.Click the Dimension Values arrow and choose the lon dimension.7.Click the cell next to lon in the Value column and type -111.75.8.Click the Dimension Values arrow again and choose the lat dimension.9.Click the cell next to lat in the Value column and type 45.75.10.Click OK to run the tool.Copyright 1995-2010 Esri. All rights reserved.8
NetCDF Tutorial11.Click the List By Source button in the table of contents to see the Temperature table.12.Right-click Temperature table in the table of contents and click Open.Copyright 1995-2010 Esri. All rights reserved.9
NetCDF Tutorial13.Examine fields and values in the Temperature table and close it.14.Click the List By Drawing Order button in the table of contents.You can create a temperature profile from this table. See A quick tour of creating graphs and The steps tocreate a graph for more information.Copyright 1995-2010 Esri. All rights reserved.10
NetCDF TutorialExercise 3: Finding temperature difference betweentwo time stepsIn this exercise, you'll create a model to find the temperature differencebetween two time steps. This exercise will take approximately 20 minutes tocomplete.Creating a new toolboxComplexity:BeginnerData Requirement:ArcGIS Tutorial Data SetupData Path:C:\arcgis\ArcTutor\NetCDFGoal:Perform analysis using a netCDF file.You'll first create a new toolbox to store the model you will create in thisexercise.Steps:1.Click the Catalog Window button2.Click the Default Geodatabase button on the Catalog.3.Right-click Default.gdb and click New Toolbox.4.Change the name of the toolbox you just created from Toolbox to NetCDF.Copyright 1995-2010 Esri. All rights reserved.on the Standard toolbar to open the Catalog window.11
NetCDF TutorialCreating a new modelYou'll create a new model and name it TemperatureDifference.Steps:1.Right-click the NetCDF toolbox and click New Model.2.On the model's Main menu, click Model Model Properties.3.Click the General tab.4.Type TemperatureDifference in the Name text box.5.Type Temperature Difference in the Label text box.6.Click OK to close the dialog box.Copyright 1995-2010 Esri. All rights reserved.12
NetCDF TutorialBuilding the Temperature Difference modelYou'll add the netCDF file and Make NetCDF Raster Layer tool in your model to create two raster layers forthe years 1935 and 1940.Steps:1.From your NetCDF folder in Windows Explorer, drag the temperature.nc file onto your model.2.Locate the Make NetCDF Raster Layer tool and drag it onto your model.3.Connect the temperature.nc variable to the Make NetCDF Raster Layer tool.4.Double-click the Make NetCDF Raster Layer tool.5.Type tmin 1935 in the Output Raster Layer text box.6.Click the Dimension Values arrow and choose the year dimension.7.Click the cell next to year in the Value column, click the arrow, then choose 1/1/1935.8.Click OK on the Make NetCDF Raster Layer dialog box.Copyright 1995-2010 Esri. All rights reserved.13
NetCDF Tutorial9.Locate the Make NetCDF Raster Layer tool again and drag it onto your model.10.Connect the temperature.nc variable to the Make NetCDF Raster Layer (2) tool.11.Double-click the Make NetCDF Raster Layer (2) tool.12.Type tmin 1940 in the Output Raster Layer text box.13.Click the Dimension Values arrow and choose the year dimension.14.Click the cell next to year in the Value column, click the arrow, then choose 1/1/1940.15.Click OK on the Make NetCDF Raster Layer (2) dialog box.Copyright 1995-2010 Esri. All rights reserved.14
NetCDF TutorialFinding temperature differenceNow you'll finish up your model to find the minimum temperature difference between years 1935 and 1940by subtracting two raster layers.Steps:1.Locate the Minus tool in Spatial Analyst or the 3D Analyst Tools toolbox and drag it onto yourmodel.2.Connect tmin 1935 then tmin 1940 to the Minus tool.3.Right-click the output of the Minus tool and click Rename.4.Type Temperature Difference in the text box and click OK.5.Right-click Temperature Difference and click Add To Display.6.Click the Auto Layout button to arrange the model elements.7.Click the Save button8.Click the Run button to run your model. The output raster layer is added to the table ofto save your model.contents.9.Click the legend of the Temperature Difference layer and choose a color ramp for betterdisplay.Copyright 1995-2010 Esri. All rights reserved.15
NetCDF TutorialSaving the map documentYou are done with the exercise. However, you may want to save the map document to explore otherfunctionalities.Steps:1.On the main menu, click File Save.Copyright 1995-2010 Esri. All rights reserved.16
This tutorial is divided into three exercises and is designed to allow you to explore the multidimension tools and the netCDF-related functionality in ArcGIS at your own pace. In exercise 1, you'll copy the tutorial data locally and create a raster layer from a netCDF file. You'll then change the display by selecting a different time step.