Transcription
2Map designIn this chapter, you’ll learn all the steps necessary to symbolize common typesof maps. Most analytical maps convey information with polygons or points usingeither qualitative or numeric attributes. Sometimes, but less often, lines are theprimary interest. For polygons, symbolization mostly uses color fill and boundary lines. For points, it’s the size, shape, color fill, and boundary lines of pointmarkers. For lines, it’s the type of line (for example, solid or dashed), width, andcolor. Symbolization is easy to implement because ArcMap uses attributevalues to automate drawing; for example, it can draw all food pantry facilities ina city with a black square point marker of a certain size and all soup kitchenfacilities with a black circle of a certain size by using an attribute with a type offacility code values.Learning objectives GIST1 10-8.indb 51Symbolize maps using qualitative attributesSymbolize maps using quantitative attributesCreate custom numeric classesCreate normalized and density mapsCreate dot density mapsCreate fishnet mapsCreate group layers9/18/20 3:13 PM
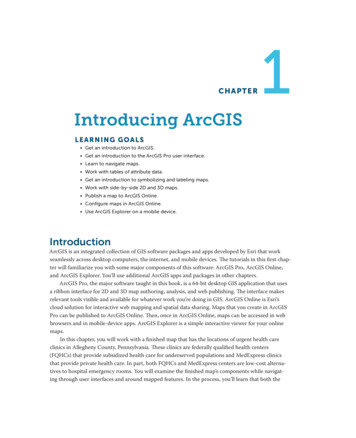
52GIS TUTORIAL FOR ARCGIS DESKTOP 10.812345TUTORIAL 2-1Creating point and polygon maps usingqualitative attributesPlacing objects of all kinds into meaningful classes or categories is a major goal of science.Classification in tabular data is accomplished using attributes with codes that have mutuallyexclusive and exhaustive qualitative values. For example, a code for size could have the valueslow, medium, and high. Any instance of the features with this code is displayed in only one ofthe classes (the values are mutually exclusive) and there are no more size classes (the valuesare exhaustive). In this tutorial, you learn how to symbolize mapped features—points, lines,and polygons—by class membership as available in code attributes.Start ArcMap and open a map document678910111On the taskbar, click Start ArcGIS ArcMap 10.8.x.2Open Tutorial2-1.mxd from the Maps folder. ArcMap opens a map with no layers added. Youadd the needed layers next.3Save the map document to the Chapter2 folder of MyExercises.Add and display polygons using a single symbolThe first layer of your map is an outline of New York City neighborhoods used as a referencelayer.1Click the Add Data button, browse through the Data folder to NYC.gdb, and clickNeighborhoods Add. ArcMap draws the neighborhoods for New York City as filled polygons.2In the Table Of Contents window, click the polygon symbol and select Hollow symbol, typean outline width of 1.15, and select an outline color of Black. Click OK.3In the Table Of Contents window, right-click the Neighborhoods layer, click Properties, andclick the Labels tab.4Click the Label features in this layer check box. For Label Field, select Name, and select 10as the Text Symbol size.12Next, you add a white halo to the label to make the labels stand out and be more legible.5GIST1 10-8.indb 52Click the Symbol button Edit Symbol button Mask tab Halo option button.9/18/20 3:13 PM
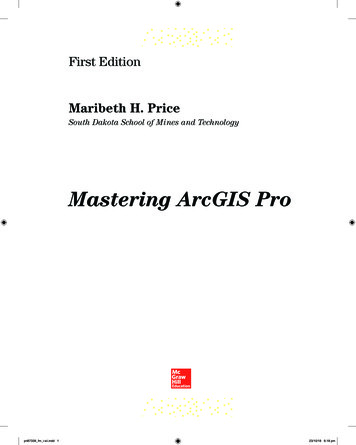
Chapter 2: MAP DESIGN6Type 1.5 for Size and click OK OK OK.5312345 alt Layer Properties with selections made on the Labels tab. /alt 76Click Bookmarks Lower Manhattan. ArcMap zooms to this neighborhood and a fewneighborhoods in the surrounding boroughs.7891011 alt Map zoomed to the Lower Manhattan bookmark. /alt Note: The font size 10 labels for neighborhoods may appear larger or smaller than those shownon the book’s map. If you’d like to change the size of labels for your window, use the steps in thissection. Likewise, you can change the font size for labels in the Your Turn assignment, which isnext.GIST1 10-8.indb 53129/18/20 3:13 PM
54GIS TUTORIAL FOR ARCGIS DESKTOP 10.8YOUR TURN1Add the Water feature class from NYC.gdb with a blue symbol and no outline. Label the layerusing the field LANDNAME with Times New Roman, Bold, and Italic font of size 12. Drag thislayer below Neighborhoods. The two layers you added are from different sources, so theboundaries do not match perfectly. Note: When labeling the Water feature class, you’ll seethat some labels are repeated. You can get just one label to appear by clicking the PlacementProperties button at the lower left of the Labels tab and selecting Remove duplicate labels.23456789Add and display polygons using unique symbolsThe next layer you add has zoning polygons with various classes of land use. Zoning restrictsland use to approved kinds; for example, areas zoned as residential cannot have businesseslocated within them.1Click the Add Data button, browse through the Data folder to NYC.gdb, and clickZoningLandUse Add.2After adding the ZoningLandUse layer, drag it below the Neighborhoods layer in the tableof contents.3In the Table Of Contents window, right-click the ZoningLandUse layer and click Properties Symbology tab.4In the Show panel, click Categories Unique Values.5Under Value Field, click LANDUSE and click Add All Values.ArcMap assigns colors unique to each land use. Next, you’ll assign colors that are commonly usedin zoning maps.101112GIST1 10-8.indb 549/18/20 3:13 PM
Chapter 2: MAP DESIGN5512345 alt Add All Values button on the Symbology tab. /alt 6Double-click the symbol next to Battery Park City, click Fill Color, and choose Apple Dust(column 6, row 7 of the color palette) for the color and Gray 30% as the outline color. ClickOK.6789 alt Apple Dust color selected in the color palette. /alt 7Assign a Gray 30% outline to the remaining symbols using the following colors (withcolumn number, row number of the color palette included in parentheses). You can changeall the outline colors by multiple selection (pressing and holding the Shift key), right-clicking,and choosing Properties for Selected Symbol(s). GIST1 10-8.indb 55Commercial, Rose Quartz (2,1)Commercial Restricted, Medium Coral (2,8)Commercial Retail, Tulip Pink (2,9)Commercial Service, Rose Dust (2,7)Heavy Manufacturing, Blackberry (11,10)Light Manufacturing, Lepidolite Lilac (11,1)Medium Manufacturing, Lilac Dust (11,7)1011129/18/20 3:13 PM
56GIS TUTORIAL FOR ARCGIS DESKTOP 10.8 12348Park, Medium Apple (7,3)Residential, Yucca Yellow (5,1)Residential/Lt Mfg, Light Sienna (4,9)Waterfront, Blue Gray Dust (9,7)Click Apply OK.Label zoning features1In the Table Of Contents window, right-click the ZoningLandUse layer and click Properties Labels tab.2Click Label features in this layer, select ZONE as the Label field, select 6 as the TextSymbol size, select Gray 60% as the color, and click OK. The result is a subtle label forzoning details.56789101112GIST1 10-8.indb 56 alt Zoning details are labeled on the map. /alt YOUR TURNArcMap has predefined symbols for some zoning and land-use features. To view these,double-click the Park symbol Style References Civic OK. Scroll through the Civicpolygon symbols and choose Park & Open Space. When finished, deselect Civic under StyleReferences.9/18/20 3:13 PM
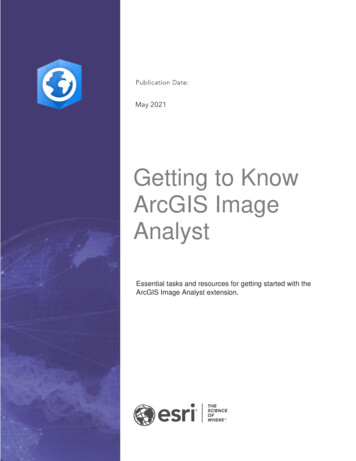
Chapter 2: MAP DESIGN57123456 alt Park & Open Space selected in the Symbol Selector window. /alt Add points and create a definition queryOften a map layer has more classes of features than you want to display. In this case, you can usea definition query to select the desired subset from the larger collection. Below, you add a newlayer to your map document: Facilities, which has various government and nonprofit facilities thatprovide services. Only three classes out of over 100 are needed for the map. Classes have both anumeric code (Facility T) and a corresponding text code (Facttype 1), and the three neededfacility classes are 4901 Soup Kitchen, 4902 Food Pantry, and 4903 Joint Soup Kitchen andFood Pantry. While in common language, you use and to connect members of a collection, such asthe three food facility types, in a query you must use or.GIST1 10-8.indb 571Click the Add Data button, browse through the Data folder to NYC.gdb, and click Facilities Add.2In the Table Of Contents window, right-click the Facilities layer and click Properties Definition Query tab.3Click the Query Builder button.4In the Query Builder window, double-click FACILITY T.5Click as the logical operator.6Click Get Unique Values. The resulting list has all unique values in the FACILITY T attribute.7891011129/18/20 3:13 PM
5812GIS TUTORIAL FOR ARCGIS DESKTOP 10.87In the Unique Values list, double-click 4901.8Click Or, double-click FACILITY T, click as the logical operator, and double-click 4902.9Repeat step 8, except use 4903 instead of 4902. The completed query, FACILITY T 4901 ORFACILITY T 4902 OR FACILITY T 4903, yields a layer with only food type facilities. If yourquery has an error, edit it in the lower panel of the Query Builder, or click Clear and repeatsteps 4 through 8.34567 alt Query Builder with completed query. /alt 8910 Click OK OK to execute your query and close the Layer Properties window.Display points using unique symbolsNext you symbolize food facilities using unique symbols.101112GIST1 10-8.indb 581In the Table Of Contents window, right-click the Facilities layer and click Properties Symbology tab.2In the Show panel, click Categories Unique Values.3Click Factype 1 as the Value field and click Add All Values.ArcMap assigns random unique symbols for each food facility type. Next, you assign threespecific unique symbols.4Double-click the symbol next to Food Pantry and select Esri symbol Square 1 and size 12.Click OK.9/18/20 3:13 PM
Chapter 2: MAP DESIGN5Double-click the symbol next to Joint Soup Kitchen and Food Pantry and select Esri symbolCross 2, size 12. Click OK.6Double-click the symbol next to Soup Kitchen and select Esri symbol Circle 1, size 12. ClickOK.75912Clear the check box next to all other values and click OK.34567 alt Symbology tab with selections made for food facility types. /alt 89101112GIST1 10-8.indb 599/18/20 3:13 PM
are exhaustive). In this tutorial, you learn how to symbolize mapped features—points, lines, and polygons—by class membership as available in code attributes. Start ArcMap and open a map document 1 On the taskbar, click Start ArcGIS ArcMap 10.8.x. 2 Open Tutorial2-1.mxd from the Maps folder. ArcMap opens a map with no layers added. You