Transcription
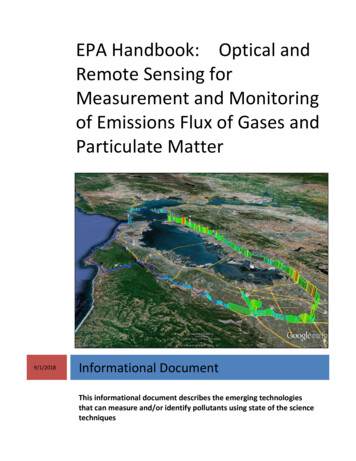
EPA Handbook: Optical andRemote Sensing forMeasurement and Monitoringof Emissions Flux of Gases andParticulate Matter9/1/2018Informational DocumentThis informational document describes the emerging technologiesthat can measure and/or identify pollutants using state of the sciencetechniques
EPA Handbook: Optical andRemote Sensing forMeasurement and Monitoringof Emissions Flux of Gases andParticulate MatterU.S. Environmental Protection AgencyOffice of Air Quality Planning and StandardsAir Quality Assessment DivisionMeasurement Technology GroupResearch Triangle, North Carolina, 27711
ForwardOptical Remote Sensing (ORS) technologies have been available since the late 1980s. In theearly days of this technology, there were many who saw the potential of these new instrumentsfor environmental measurements and how this technology could be integrated into emissionsand ambient air monitoring for the measurement of flux. However, the monitoring communitydid not embrace ORS as quickly as anticipated. Several factors contributing to delayed ORS usewere: Cost: The cost of these instruments made it prohibitive to purchase, operate andmaintain. Utility: Since these instruments were perceived as “black boxes.” Many instrumentspecialists were wary of how they worked and how the instruments generated thevalues. Ease of use: Many of the early instruments required a well-trained spectroscopist whowould have to spend a large amount of time to setup, operate, collect, validate andverify the data. Data Utilization: Results from path integrated units were different from point sourcedata which presented challenges for data use and interpretation.Over the years, the air monitoring community has come to accept both the challenges andoverall utility of ORS technologies and applications. The emissions monitoring community andmonitored sources have been employing ORS for several years and are using these technologiesto answer questions that traditional instrumentation could not address. In addition, ORStechnology has been applied to ambient and fenceline monitoring, including near-roadwaymonitoring. Therefore, application of ORS technology has an expanding place with other airmeasurement tools.
The EPA staff and other scientists and engineers in the monitoring community recognized that acompilation of ORS material was needed to encourage wider use and understanding of ORS.Questions on how instruments generate data and how an agency or source validates and verifiesdata are universal, whether the instrument is optically remote or an extractive instrument onsite or within the stack. With this in mind, the EPA developed this Handbook to assist the “nonspectroscopist” in understanding and using data and information generated by ORS. ThisHandbook is divided into five sections: Section 1: Discusses what ORS means and how this technology can be used. It also hasseveral tables that have a “crosswalk” between the different technologies and their use(i.e., techniques). Section 2: Describes the different technologies or “hardware” that are currentlyavailable that are considered “optically remote.” Section 3: Explains how to use the “hardware” with different techniques and how tocalculate emission flux. Section 4: Discusses the “other” data that needs to be collected to understand andbetter validate and verify the ORS data. Section 5: Provides a very brief overview of how to validate and verify this data once itis collected.
Disclaimer of EndorsementMention of, or referral to, commercial products or services and/or links to non-EPA internet sitesdoes not imply official EPA endorsement of, or responsibility for opinions, ideas, data, orproducts presented at those locations, or guarantee the validity of the information provided.Mention of commercial products/services and non-EPA websites is provided solely as areference to information on topics related to environmental protection that may be useful toEPA staff and the public.
AcknowledgementA document such as this requires the work and dedication of many people. This sectionacknowledges those that have provided their time and effort to create this document.Team Lead: Dennis K. Mikel, EPA-OAQPSReviewers:David Nash, EPA-OAQPSRaymond Merrill EPA-OAQPSJason Dewees, EPA-OAQPSComments and questions can be directed to:Steffan Johnson EPA-OAQPS109 Alexander DriveResearch Triangle Park, NC 27711 Email: johnson.steffan@epa.gov
Table of Contents1.0 Introduction . 11.1 Purpose of the Handbook .11.2 Contents and Overview of the Handbook.31.3 Stationary Sources and Emissions Points .6Ducted or Vented Emissions . 7Area or Fugitive Emissions Sources . 81.4 Why Remote Measurement? .9Criteria Pollutant Gases, HAPs and GHGs . 111.5 Knowledge and Advancement of Remote Sensing to Emissions Measurement . 15Active . 15Passive. 16Backscatter. 17Mobile . 18Advantages Over Closed Path Techniques . 181.6 General Discussion of the EPA Quality System .20Data Quality Objectives . 21Measurement Quality Objectives . 221.7 Choosing the Right Tool for the Right Job.24What is the nature of the source? . 24What is the required time resolution? . 25What are the QA/QC requirements for the measurement?. 26How easy are the data to process? . 271.8 Future Evolution and Updates of this Handbook .281.9 References .282.0 Optical Remote Sensing Technologies . 12.1 Fourier Transform Infrared Spectroscopy.2Basic Operation . 2Extractive (Closed) Cell Measurement Applications. 5Open-Path Measurement Applications . 6Pollutants and Relative Levels That Can Be Measured. 8Typical QA/QC . 11Calibration Spectra. 11QA/QC for OP-FTIR Instrumentation . 13Data Quality Indicators for Precision and Accuracy for OP-FTIR . 14Example Applications and Vendors . 14Strengths and Limitations . 16References . 192.2 Tunable Diode Laser .21Basic Operation . 22Pollutants and Relative Levels That Can Be Measured . 26Typical QA/QC . 27Selection of the Laser and Absorption Line . 27Calibration . 29Quality Control Procedures. 30
Example Applications and Vendors Applications . 30Vendors . 31Strengths and Limitations . 31References . 332.3 Ultraviolet Differential Optical Absorption Spectroscopy .35Basic Operation . 35UV-DOAS Field Implementation . 38Passive UV-DOAS . 40Pollutants and Relative Levels That Can Be Measured. 40Typical QA/QC . 41Record Keeping . 42Instrument Performance . 42Example Applications and Vendors . 43Vendors . 44Strengths and Limitations . 44References . 462.4. Differential Absorption Light Detection and Ranging Systems .47Basic Operation . 48Pollutants and Relative Levels That Can Be Measured. 54Typical QA/QC . 55Record Keeping . 56Instrument Performance . 56Example Applications and Vendors Applications . 56Vendors . 58Strengths and Limitations . 58References . 602.5 Thermal Infrared Cameras .62Basic Operation . 63Pollutants and Relative Levels That Can Be Detected . 69Typical QA/QC . 70Example Applications and Vendors . 74Vendors . 75Strengths and Limitations . 75References . 762.6 Cavity Ring-Down Spectroscopy.79Basic Operation . 79General Experimental Design . 81Current Method Developments. 85Pollutants and Relative Levels That Can Be Measured. 86Typical QA/QC . 88Example Applications and Vendors Applications . 89Vendors . 90Strengths and Limitations . 90References . 922.7 Particulate Matter LIDAR.94Basic Operation . 95Pollutants and Relative Levels That Can Be Detected . 101Typical QA/QC . 102
Example Applications and Vendors . 102Vendors . 102Strengths and Limitations . 104References . 1043.0 Measurements Applicable to Emissions Flux . 1Reference . 23.1 Radial Plume Mapping: Other Test Method 10 .3General Description of Approach . 3Horizontal RPM Algorithm . 4Vertical RPM algorithm . 6One-dimensional RPM algorithm . 9RPM-ORS Technologies . 11Verification/Validation Studies . 12OP-FTIR and OP-TDLAS comparison studies . 12OP-FTIR and UV-DOAS comparison: Colorado Springs field study . 13VRPM plume capture validation study . 13Typical QA/QC . 14Siting Concerns . 15Strengths and Limitations . 16References . 173.2 Range Resolved Measurements using Differential Absorption LIDAR . 19General Description of Approach . 19Basic DIAL algorithm to calculate backscatter . 20Verification/Validation Studies . 22Verification of DIAL for Gas Species Measurements . 22Typical QA/QC . 24Siting Concerns. 25Strengths and Limitations . 25References . 263.3 Solar Occultation Flux Measurement .28General Description of Approach . 29Verification/Validation Studies . 34Typical QA/QC . 37Siting Concerns . 39Strengths and Limitations . 39References . 403.4 Tracer Gas Correlation .42General Description of Approach . 42Verification/Validation Studies . 45Typical QA/QC . 48Sitting Concerns . 48Strength and Limitations. 49References . 503.5 Backward Lagrangian Stochastic Inverse-Dispersion model .51General Description of Approach . 51Backward LS Dispersion Model for Calculating (C/Qsim) . 53bLS Model Output Units. 55
Verification/Validation Study. 55Flesch et al Conditions and Setup . 56Flesch et al Results and Conclusions . 58Typical QA/QC . 59Siting Concerns . 60Strengths and Limitations . 61References . 633.6 Geospatial Measurement of Air Pollution, Remote Emission Quantification – OtherTest Method 33 .64General Description of Approach . 66Verification/Validation Studies . 69Typical QA/QC . 69Siting Concerns. 70Strength and Limitations. 71References . 733.7 Geospatial Measurement of Air Pollution, Remote Emission Quantification: DirectAssessment – Other Test Method 33A .75General Description of Approach . 76Verification/Validation Studies . 82Typical QA/QC . 91Siting Concerns . 93Strengths and Limitations . 95References . 963.8 Hyperspectral Imaging .98General Description of Approach . 99Operating Principles. 100Example Instruments . 102Physical Sciences’ AIRIS. 103Rebellion Photonics’ Gas Cloud Imager . 104Telops’ HyperCam and MS-IR . 106Additional Considerations. 108Verification/Validation Studies . 110Typical QA/QC . 113Summary of Thermal IR Camera QA/QC . 114Siting Concerns . 115Strengths and Limitations . 115References . 1163.9 Fenceline Passive Sampling – Method 325 A/B. 118General Description of Approach . 118Passive Tube Samplers . 119Sampler Deployment . 122Passive Sampler Recovery. 123Meteorological Data Collection . 124Passive Sampler Analysis . 124Recordkeeping and Data Analysis . 126Verification/Validation Studies . 126Flint Hills West Refinery . 126South Philadelphia PS and Sensor Study . 128
Typical QA/QC . 129Field Sampling QA/QC . 129Laboratory QA/QC . 130Siting Concerns. 131Strength and Limitations. 132References . 1333.10 Method to Quantify Particulate Matter Emissions from Windblown Dust – OtherTest Method 30 . 134General Description of Approach . 134Instrumentation . 136Dispersion Modeling and K-factors. 139Sample Collection . 140Owens (dry) Lake, Inyo County California. 141Mono Lake, California . 141Typical QA/QC . 142Siting Concerns . 143Strengths and Limitations . 144References . 1443.11 Determination of Emissions from Open Sources by Plume Profiling – Other TestMethod 32 . 146General Description of Approach . 146Sampling Equipment . 147Sample Deployment. 149Sample Analysis. 151Verification/Validation Studies . 151United Taconite and U.S. Steel Minntac . 151Typical QA/QC . 153Quality Control Samples . 153Quality Assurance . 153Precision. 153Siting Concerns . 154Strengths and Limitations . 155References . 1563.12 Method to Quantify Road Dust Particulate Matter from Paved and Unpaved Roads
site or within the stack. With this in mind, the EPA developed this Handbook to assist the "non- spectroscopist" in understanding and using data and information generated by ORS. This Handbook is divided into five sections: Section 1: Discusses what ORS means and how this technology can be used. It also has