Transcription
The2020EPA AutomotiveTrends ReportGreenhouse Gas Emissions,Fuel Economy, andTechnology since 1975ft .,.,,.EA United StatesEnvironmental ProtectionAgencyEPA-420-R-21-003 January 2021
This technical report does not necessarily represent final EPA decisions, positions, or validation of compliancedata reported to EPA by manufacturers. It is intended to present technical analysis of issues using datathat are currently available and that may be subject to change. The purpose of the release of such reportsis to facilitate the exchange of technical information and to inform the public of technical developments.These data reflect the most current available data. Historic data have been adjusted, when appropriate, toreflect the result of compliance investigations by EPA or any other corrections necessary to maintain dataintegrity. This edition of the report supersedes all previous versions.The Department of Justice and EPA have reached a settlement with Mercedes based on the sale of certaindiesel vehicles equipped with devices to defeat the vehicles’ emission control systems. This report includesthe original fuel economy and GHG certification values of these vehicles, as EPA believes this is a reasonable representation of how these vehicles were expected to perform. The affected vehicles are certainmodel year 2009 to 2016 diesel vehicles from Mercedes, and account for less than 1% of production in allaffected years. For more information about this settlement, please see z-usa-llc-clean-air-act-civil-settlement.
Table of ContentsIntroduction . 11.A.What’s New This Year .1B.Manufacturers in this Report .2C.Fuel Economy and CO2 Metrics in this Report .3Fleetwide Trends Overview . 52.A.Overall Fuel Economy and CO2 Trends .5B.Manufacturer Fuel Economy and CO2 Emissions .8Vehicle Attributes. 133.A.Vehicle Class and Type .13B.Vehicle Weight.18C.Vehicle Power .21D.Vehicle Footprint.25E.Summary.28Vehicle Technology. 354.A.Engines .37B.Transmission and Drive Types .57C.Technology Adoption .63Manufacturer GHG Compliance . 735.A.Footprint-Based CO2 Standards.75B.Model Year Performance.78C.GHG Program Credits and Deficits. 103D.End of Year GHG Program Credit Balances. 113Appendices: Methods and Additional DataA.Sources of Input DataB.Harmonic Averaging of Fuel Economy ValuesC.Fuel Economy and CO2 MetricsD.Historical Changes in the Database and MethodologyE.Electric Vehicle and Plug-In Hybrid MetricsF.Authors and Acknowledgments- -----i
List of FiguresFigure 2.1. Estimated Real-World Fuel Economy and CO2 Emissions .5Figure 2.2. Trends in Fuel Economy and CO2 Emissions Since Model Year 1975 .6Figure 2.3. Distribution of New Vehicle CO2 Emissions by Model Year.7Figure 2.4. Manufacturer Estimated Real-World Fuel Economy and Tailpipe CO2 in Model Year 2014and 2019.9Figure 3.1. Regulatory Classes and Vehicle Types Used in This Report .14Figure 3.2. Production Share and Estimated Real-World Fuel Economy .15Figure 3.3. Vehicle Type Distribution by Manufacturer for Model Year 2019 .16Figure 3.4. Car-Truck Classification of SUVs with Inertia Weights of 4000 Pounds or Less .17Figure 3.5. Average New Vehicle Weight by Vehicle Type.19Figure 3.6. Inertia Weight Class Distribution by Model Year .20Figure 3.7. Relationship of Inertia Weight and CO2 Emissions.21Figure 3.8. Average New Vehicle Horsepower by Vehicle Type .22Figure 3.9. Horsepower Distribution by Model Year .23Figure 3.10. Relationship of Horsepower and CO2 Emissions.24Figure 3.11. Calculated 0-to-60 Time by Vehicle Type .25Figure 3.12. Footprint by Vehicle Type for Model Year 2008–2020 .26Figure 3.13. Footprint Distribution by Model Year .27Figure 3.14. Relationship of Footprint and CO2 Emissions .28Figure 3.15. Relative Change in Fuel Economy, Weight, and Horsepower, since Model Year 1975 .29Figure 4.1. Vehicle Energy Flow .35Figure 4.2. Manufacturer Use of Emerging Technologies for Model Year 2020.36Figure 4.3. Production Share by Engine Technology .38Figure 4.4. Gasoline Engine Production Share by Number of Cylinders .40Figure 4.5. Percent Change for Specific Gasoline Engine Metrics .42Figure 4.6. Engine Metrics for Different Gasoline Technology Packages .44Figure 4.7. Gasoline Turbo Engine Production Share by Vehicle Type .46Figure 4.8. Gasoline Turbo Engine Production Share by Number of Cylinders.46Figure 4.9. Distribution of Gasoline Turbo Vehicles by Displacement and Horsepower, Model Year2011, 2014, and 2019 .47Figure 4.10. Gasoline Hybrid Engine Production Share by Vehicle Type.49Figure 4.11. Gasoline Hybrid Engine Production Share by Number of Cylinders .49Figure 4.12. Hybrid Real-World Fuel Economy Distribution, Cars Only .50Figure 4.13. Production Share of EVs, PHEVs, and FCVs, Model Year 1995-2020.52Figure 4.14. Charge Depleting Range and Fuel Economy for EVs and PHEVs.53Figure 4.15. Diesel Engine Production Share by Vehicle Type .55Figure 4.16. Diesel Engine Production Share by Number of Cylinders.55Figure 4.17. Percent Change for Specific Diesel Engine Metrics .56Figure 4.18. Transmission Production Share.58- -----ii
Figure 4.19. Average Number of Transmission Gears .60Figure 4.20. Comparison of Manual and Automatic Transmission Real-World Fuel Economy forComparable Vehicles .60Figure 4.21. Front-, Rear-, and Four-Wheel Drive Production Share .62Figure 4.22. Industry-Wide Car Technology Penetration after First Significant Use .64Figure 4.23. Manufacturer Specific Technology Adoption over Time for Key Technologies.66Figure 4.24. VVT Adoption Details by Manufacturer .68Figure 4.25. Five-Year Change in Light Duty Vehicle Technology Production Share.69Figure 5.1. The GHG Compliance Process.73Figure 5.2. 2012–2019 Model Year CO2 Footprint Target Curves .75Figure 5.3. Changes in “2-Cycle” Tailpipe CO2 Emissions, Model Year 2012 to 2019 (g/mi) .80Figure 5.4. Model Year 2019 Production of EVs, PHEVs, and FCVs .82Figure 5.5. Model Year 2019 Advanced Technology Credits by Manufacturer .83Figure 5.6. Production of FFVs, Model Year 2012–2019.85Figure 5.7. FFV Credits by Model Year .85Figure 5.8. HFO-1234yf Adoption by Manufacturer.87Figure 5.9. Fleetwide A/C Credits by Credit Type .89Figure 5.10. Total A/C Credits by Manufacturer for Model Year 2019 .89Figure 5.11. Off-Cycle Menu Technology Adoption by Manufacturer, Model Year 2019 .91Figure 5.12. Total Off-Cycle Credits by Manufacturer for Model Year 2019 .98Figure 5.13. Performance and Standards by Manufacturer, Model Year 2019 . 104Figure 5.14. Early Credits by Manufacturer . 110Figure 5.15. Total Credits Transactions through Model Year 2019 . 111Figure 5.16. Manufacturer Credit Balance After Model Year 2019. 115Figure 5.17. Industry Performance and Standards, Credit Generation and Use. 119List of TablesTable 1.1. Model Year 2019 Manufacturer Definitions .3Table 1.2. Fuel Economy and CO2 Metrics Used in this Report.4Table 2.1. Production, Estimated Real-World CO2, and Fuel Economy for Model Year 1975–2020.10Table 2.2. Manufacturers and Vehicles with the Highest Fuel Economy, by Year .11Table 2.3. Manufacturer Estimated Real-World Fuel Economy and CO2 Emissions for Model Year2018–2020.12Table 3.1. Vehicle Attributes by Model Year .30Table 3.2. Estimated Real-World Fuel Economy and CO2 by Vehicle Type .31Table 3.3. Model Year 2019 Vehicle Attributes by Manufacturer .32Table 3.4. Model Year 2019 Estimated Real-World Fuel Economy and CO2 by Manufacturer andVehicle Type .33Table 3.5. Footprint by Manufacturer for Model Year 2018–2020 (ft2) .34- -----iii
Table 4.1. Production Share by Engine Technologies .70Table 4.2. Production Share by Transmission Technologies.71Table 4.3. Production Share by Drive Technology .72Table 5.1. Manufacturer Footprint and Standards for Model Year 2019 .77Table 5.2. Production Multipliers by Model Year .81Table 5.3. Model Year 2019 Off-Cycle Technology Credits from the Menu, by Manufacturer andTechnology (g/mi).95Table 5.4. Model Year 2019 Off-Cycle Technology Credits from an Alternative Methodology, byManufacturer and Technology (g/mi).97Table 5.5. Manufacturer Performance in Model Year 2019, All (g/mi). 100Table 5.6. Industry Performance by Model Year, All (g/mi) . 100Table 5.7. Manufacturer Performance in Model Year 2019, Car (g/mi) . 101Table 5.8. Industry Performance by Model Year, Car (g/mi) . 101Table 5.9. Manufacturer Performance in Model Year 2019, Truck (g/mi) . 102Table 5.10. Industry Performance by Model Year, Truck (g/mi). 102Table 5.11. Credits Earned by Manufacturers in Model Year 2019, All. 106Table 5.12. Total Credits Earned in Model Years 2009–2019, All . 106Table 5.13. Credits Earned by Manufacturers in Model Year 2019, Car . 107Table 5.14. Total Credits Earned in Model Years 2009–2019, Car . 107Table 5.15. Credits Earned by Manufacturers in Model Year 2019, Truck . 108Table 5.16. Total Credits Earned in Model Years 2009–2019, Truck . 108Table 5.17. Example of a Deficit Offset with Credits from Previous Model Years. 113Table 5.18. Final Credit Balance by Manufacturer for Model Year 2019 (Mg) . 116Table 5.19. Distribution of Credits by Expiration Date (Mg) . 117- -----iv
1. IntroductionThis annual report is part of the U.S. Environmental Protection Agency’s (EPA) commitmentto provide the public with information about new light-duty vehicle greenhouse gas (GHG)emissions, fuel economy, technology data, and auto manufacturers' performance inmeeting the agency’s GHG emissions standards.EPA has collected data on every new light-duty vehicle model sold in the United Statessince 1975, either from testing performed by EPA at the National Vehicle Fuel andEmissions Laboratory in Ann Arbor, Michigan, or directly from manufacturers using officialEPA test procedures. These data are collected to support several important nationalprograms, including EPA criteria pollutant and GHG standards, the U.S. Department ofTransportation’s National Highway Traffic Safety Administration (NHTSA) CorporateAverage Fuel Economy (CAFE) standards, and vehicle Fuel Economy and Environmentlabels. This expansive data set allows EPA to provide a uniquely comprehensive analysis ofthe automotive industry over the last 45 years.A. What’s New This YearThis report is updated each year to reflect the most recent data, best methodology, andany relevant regulatory changes. This version of the report contains the most up to datedata available to EPA for all model years and supersedes all previous reports. The majorupdates for this year are as follows: EPA and NHTSA finalized the Safer Affordable Fuel-Efficient (SAFE) Vehicles Rule inApril of 2020, which established new light-duty GHG standards for model years 20212026. This report includes compliance data through model year 2019 and does notgenerally discuss future model years. While this report has been updated to reflectregulatory changes due to the SAFE rule, the changes are minor. EPA also finalized technical amendments to the light-duty GHG rules that correctcalculations used to determine the amount of credits created through the sale ofadvanced technology vehicles, such as electric vehicles. The calculations in this reportreflect the methodology defined in the final technical amendment. Small Volume Manufacturers (SVMs) are included in discussion of the light duty GHGprogram (section 5), following the finalization of alternative standards for this groupof manufacturers. Previous reports had omitted these manufacturers as they did nothave final standards.- -----1
This report shows projected model year 2020 data that was generally provided to EPAby manufacturers before the outbreak of COVID-19, and any associated impacts onthe automobile industry. Therefore, the projected model year 2020 data may changesignificantly before being finalized. EPA has added detailed compliance data, covering all years of the light-duty GHGstandards, to the EPA Automotive Trends website. We encourage readers to visithttps://www.epa.gov/automotive-trends and explore the data. EPA will continue toadd content and tools on the web to allow transparent access to public data.B. Manufacturers in this ReportThe underlying data for this report include every new light-duty vehicle offered for sale inthe United States. These data are presented by manufacturer throughout this report, usingmodel year 2019 manufacturer definitions determined by EPA and NHTSA forimplementation of the GHG emission standards and CAFE program. For simplicity, figuresand tables in the executive summary and in Sections 1-4 show only the top 14manufacturers, by production. These manufacturers produced at least 125,000 vehicleseach in the 2019 model year and accounted for approximately 98% of all production. Thecompliance discussion in Section 5 includes all manufacturers, regardless of productionvolume, and for the first time this year provides detailed data for small volumemanufacturers Aston Martin, Ferrari, Lotus, and McLaren. Table 1.1 lists all manufacturersthat produced vehicles in the U.S. for model year 2019, including their associated makes,and their categorization for this report. Only vehicle brands produced in model year 2019are shown in this table; however, this report contains data on many other manufacturersand brands that have produced vehicles for sale in the U.S. since 1975.When a manufacturer grouping changes under the GHG and CAFE programs, EPA appliesthe new manufacturer definitions to all prior model years for the analysis of estimated realworld CO2 emission and fuel economy trends in Sections 1 through 4 of this report. Thismaintains consistent manufacturer and make definitions over time, which enables betteridentification of long-term trends. However, the compliance data that are discussed inSection 5 of this report maintain the previous manufacturer definitions where necessary topreserve the integrity of compliance data as accrued.- -----2
Table 1.1. Model Year 2019 Manufacturer issanSubaruTeslaToyotaVolkswagenJaguar Land RoverMitsubishiVolvoAston Martin*Ferrari*McLaren*Makes in the U.S. MarketBMW, Mini, Rolls RoyceAlfa Romeo, Chrysler, Dodge, Fiat, Jeep, Maserati, RamFord, Lincoln, Roush, ShelbyBuick, Cadillac, Chevrolet, GMCAcura, HondaGenesis, HyundaiKiaMazdaMaybach, Mercedes, SmartInfiniti, NissanSubaruTeslaLexus, Scion, ToyotaAudi, Bentley, Bugatti, Lamborghini, Porsche, VolkswagenJaguar, Land RoverMitsubishiPolestar, VolvoAston MartinFerrariMcLaren* Small Volume ManufacturersC. Fuel Economy and CO2 Metrics in this ReportAll data in this report for model years 1975 through 2019 are final and based on officialdata submitted to EPA and NHTSA as part of the regulatory process. In some cases, thisreport will show data for model year 2020, which are preliminary and based on dataprovided to EPA by automakers prior to the model year, including projected productionvolumes. All data in this report are based on production volumes delivered for sale in theU.S. by model year. The model year production volumes may vary from other publicizeddata based on calendar year sales. The report does not examine future model years, andpast performance does not necessarily predict future industry trends.The carbon dioxide (CO2) emissions and fuel economy data in this report fall into one oftwo categories based on the purpose of the data and the subsequent required emissionstest procedures. The first category is compliance data, which is measured using laboratorytests required by law for CAFE and adopted by EPA for GHG compliance. Compliance dataare measured using EPA city and highway test procedures (the “2-cycle” tests), and- -----3
fleetwide averages are calculated by weighting the city and highway test results by 55% and45%, respectively. These procedures are required for compliance; however, they no longeraccurately reflect real-world driving. Compliance data may also encompass optionalperformance credits and adjustments that manufacturers can use towards meeting theiremissions standards.The second category is estimated real-world (previously called “adjusted”) data, which ismeasured using additional laboratory tests to capture a wider range of operatingconditions (including hot and cold weather, higher speeds, and faster accelerations)encountered by an average driver. This expanded set of tests is referred to as “5-cycle”testing. City and highway results are weighted 43% city and 57% highway, consistent withfleetwide driver activity data. The city and highway values are the same values found onnew vehicle fuel economy labels, however the label combined value is weighted 55% cityand 45% highway. Unlike compliance data, the method for calculating real-world data hasevolved over time, along with technology and driving habits.Table 1.2. Fuel Economy and CO2 Metrics Used in this ReportCO2 and Fuel EconomyData CategoryPurposeComplianceBasis for manufacturercompliance with standardsEstimated Real-World(“adjusted” in previousreports)Best estimate of urrent TestBasis55% / 45%2-cycle43% / 57%5-cycleThis report will show estimated real-world data except for the discussion specific to theGHG regulations in Section 5 and Executive Summary Figures ES-6 through ES-8. Thecompliance CO2 data must not be compared to the real-world CO2 data presentedelsewhere in this report. Appendices C and D present a more detailed discussion of the fueleconomy and CO2 data used in this report.This report does not provide data about NHTSA’s CAFE program. For more informationabout CAFE and manufacturer compliance with the CAFE fuel economy standards, see theCAFE Public Information Center, which can be accessed athttps://one.nhtsa.gov/cafe pic/CAFE PIC Home.htm.- -----4
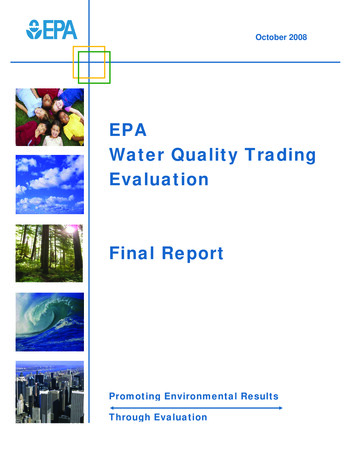
2. Fleetwide Trends OverviewThe automotive industry has made strong progress towards lower tailpipe CO2 emissionsand higher fuel economy in recent years. This section provides an update on the estimatedreal-world tailpipe CO2 emissions and fuel economy for the overall fleet, and formanufacturers based on final model year 2019 data. The unique, historical data on whichthis report is based also provide an important backdrop for evaluating the more recentperformance of the industry. Using that data, this section will also explore basic fleetwidetrends in the automotive industry since EPA began collecting data in model year 1975.A. Overall Fuel Economy and CO2 TrendsIn model year 2019, the averageestimated real-world CO2 emissionrate for all new vehicles increasedslightly (less than 1%) from the recordlow achieved in model year 2018. TheFigure 2.1. Estimated Real-World FuelEconomy and CO2 Emissions5'Q.6 ,new vehicle emission rate increased 3Eg/mi to 356 g/mi. Fuel economy0decreased by 0.2 miles per gallon to24.9 mpg, or slightly below the record 240Cuw20Q)24.9 MPGMY 2019:::;LL"O"§high achieved in model year 2018 1.sSince 2004, CO2 emissions have0::decreased 23%, or 105 g/mi, and fuel·-economy has increased 29%, or 5.6OJ16.!.CllQ)mpg. Over that time, CO2 emissions andfuel economy have improved in twelve700Efl)C0"iii600356 g/miMY 2019fl)Ewout of fifteen years. The trends in CO20emissions and fuel economy since 1975"Oare shown in Figure 2.1.sNu500-.::::0.!.400CllQ)Preliminary data suggest improvementsin model year 2020. Average estimatedreal-world CO2 emissions are projected0::19751985199520052015 2025Model YearEPA generally uses unrounded values to calculate values in the text, figures, and tables in this report. Thisapproach results in the most accurate data but may lead to small apparent discrepancies due to rounding.1- -----5
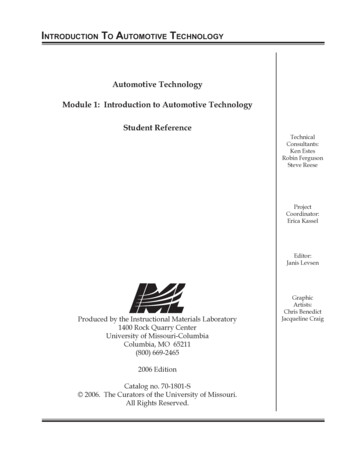
to fall 12 g/mi to 344 g/mi and fuel economy is projected to increase 0.8 mpg to 25.7 mpg.If achieved, these values will be record low average new vehicle CO2 emissions and recordhigh fuel economy. The preliminary model year 2020 data are based on productionestimates provided to EPA by manufacturers months before the vehicles go on sale. Thedata are a useful indicator, however there is always uncertainty associated with suchprojections, and we caution the reader against focusing only on these data. Projected dataare shown in Figure 2.1 as a dot because the values are based on manufacturer projectionsrather than final data.While the most recent annual changes often receive the most public attention, the greatestvalue of the Trends database is to document long-term trends. The magnitude of changesin annual CO2 emissions and fuel economy tend to be small relative to longer, multi-yeartrends. Figure 2.2 shows fleetwide estimated real-world CO2 emissions and fuel economyfor model years 1975–2019. Over this timeframe there have been three basic phases: 1) arapid improvement of CO2 emissions and fuel economy between 1975 and 1987, 2) aperiod of slowly increasing CO2 emissions and decreasing fuel economy through 2004, and3) decreasing CO2 emissions and increasing fuel economy through the current model year.Figure 2.2. Trends in Fuel Economy and CO2 Emissions Since Model Year 197525Q.:a: ,E0C0(.)20wQ)::iLL"'C"t:0 15 68%aiQ.)c:r:t1988 to 2004-12%'2005 to 2019 29%1988 to 2004 14%2005 to 2019-23%.E flC6000"iiit fl.Ew0500'0"'C"t:0 400aiQ.)c:r:19801990200020102020Model Yearti6
Vehicle CO2 emissions and fuel economy are inversely related for gasoline and dieselvehicles, but not for electric vehicles. Since gasoline and diesel vehicles have made up thevast majority of vehicle production since 1975, Figure 2.2 shows an inverted, but highlycorrelated relationship between CO2 emissions and fuel economy. Electric vehicles, whichaccount for a small but growing portion of vehicle production, have zero tailpipe CO2
EPA Automotive Trends Report . Greenhouse Gas Emissions, Fuel Economy, and Technology since 1975 . EPA-420-R-21-003 January 2021 . This technical report does not necessarily represent final EPA decisions, positions, or validation of compliance. data reported to EPA by manufacturers. It is intended to present technical analysis of issues using data that are currently available and that may be .