Transcription
Bruker Optical Profilometer SOPRevision 103/02/12Page 1 of 13Bruker Optical ProfilometerSOPThe Contour GT-I, is a versatile bench-top optical surface-profiling system that can measure awide variety of surfaces and samples. Contour GT optical profilers measure surface topography(2D and 3D) with high accuracy in a range from fractions of a nm up to approximately 10mm.Note: Qualification on this tool will require that you complete the training and then contactstaff when you plan to use the tool for the first time. If you “pass” the solo test you will thenbe signed off.SafetyHigh Voltage - Voltages supplied to and within certain areas of the system are potentiallydangerous and can cause injury to personnel.Moving Components – The optical profiler is equipped with a motorized stage that can createpinch points – areas where a person’s fingers can get caught or crushed. Do not move the stagewith your hands near it.1.Pre-Operation1.1. Tool Reservations may be made via the NRF Reservation Page.2.Restrictions2.1. None3. Operation IndexProcedureStart Vision 64 softwareRaise head and load sampleFocusRemove tiltMeasureAnalyze dataRaise head and unload sampleShutdown Vision 64 softwareLevel using Terms MaskSection4.14.24.34.44.5 – 4.64.74.84.9Appendix A
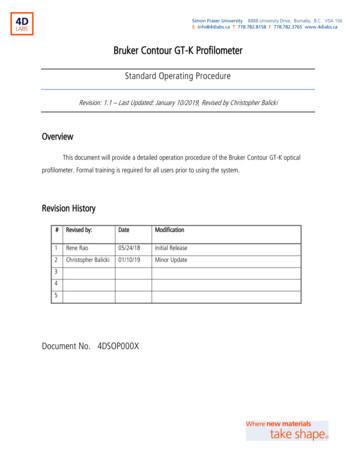
Bruker Optical Profilometer SOP4.Revision 1Operation4.1. Start Up4.1.1. Log on TUMI4.1.2. Start the Vision 64 software by double-clicking the icon4.1.2.1. Main screen and control box shown below03/02/12Page 2 of 13
Bruker Optical Profilometer SOPRevision 103/02/12Page 3 of 134.2. Sample Loading4.2.1. Ensure that the objectives are raised high enough to easily clear your sample.CAUTIONCAUTIONALWAYS ENSURE THAT OBJECTIVES WILL NOT STRIKE YOUR SAMPLE4.2.2. If the head needs to be raised, this can be accomplished in two ways. Raise the head through the Vision 64 software by left clicking and pulling up on thered indicator in the z-control window. Control the speed by how high you pull theindicator and by the SLOW, MED, FAST buttons.Raise the head through the control box by rotating the z-control knob clockwise.To increase speed, hold the FAST button while rotating.4.2.3. Move the stage all the way to the front of the machine (if not there already) bypressing the Unload XYor by using the XY Control joystick on the control box.4.2.4. Place your sample on the stage and move your sample beneath the objective. By using software, left click and drag the red dot in the XY control window By control box, move the XY josytick4.3. Focusing Safely4.3.1. Click Auto on the intensity control window.4.3.2. While watching the objective carefully from the side, adjust the focus to lower thehead so that the objective is a few millimeters above the surface of the sample.4.3.3. Focus the system by slowly raising the head. As you raise the head watch theintensity and video windows: To see when the sample features start to sharpen or, To see when the intensity value reaches a minimum.4.3.4. When any of the above occurs, you are very close to focus. Slow your adjustmentand watch very carefully for fringes. Note that if the sample is highly tilted the fringesmay appear over a very narrow band.4.3.5. Continue to raise the head until fringes appear in the Video window. If the intensitystarts to increase you have passed through focus and will need to lower the headagain.4.3.6. Turn off the Auto intensity
Bruker Optical Profilometer SOPRevision 103/02/12Page 4 of 134.3.7. Now that the surface is in focus, you can move the XY stage and find your feature ofinterest. This can be accomplished in 4 ways. Using the joystick on the control box Using the XY Control Window by pulling the red dot in the direction needed Double-clicking in the grid of the XY Control window Double clicking in the Video Window4.4. Removing Tilt4.4.1. Your sample will always show some degree of tilt with respect to the measurementhead. This tilt will need to be removed to get the correct number of fringes for themeasurement type. For VSI, you need 0-15 fringes and for PSI you need 5 fringes.4.4.2. Tilt is usually more visible at higher magnification. If the 20X objective is not selectedthen go to the drop down menu on the left and select it4.4.3. The head tilt can be removed in two ways. Using the Tilt Control Window, left-click and pull the red dot in a direction normal tothe fringes. If fringes get smaller, then pull the opposite direction. Using the control box, press and hold the TILT button while moving the joystick ina direction normal to the fringes. If fringes get smaller, then pull the oppositedirection.4.5. VSI Measurements4.5.1. Vertical scanning interferometry (VSI) uses a broadband (normally white) lightsource. It is effective for measuring objects with rough surfaces, as well as those withadjacent pixel-height differences (steps) greater than 135 nm. Resolution is in the nmrange and the maximum height is 10mm.4.5.2. Select VSI/VXI from the pulldown menu in the left window4.5.3. Select your objective (2.5X or 20X) from the pulldown menu4.5.4. Select your field of view (0.55X, 1X, 2X) from the pulldown menu. Note that theapproximate measurement area for the selected optics combination is automaticallyupdated in the Measurement Area section.4.5.5. Click on the Measurement Setup buttonand then the “Measurement” buttonin the left window and you will see the menu below
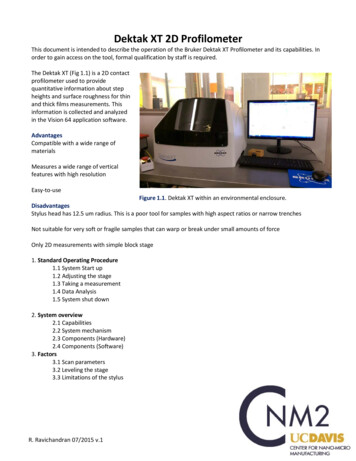
Bruker Optical Profilometer SOPRevision 103/02/12Page 5 of 134.5.6. Measurement Parameters Speed – Choose the speed that the scan head will move. 1X is fast enough formost applications. Will lose resolution as speed increases 3X speed is roughly3X lower resolution, etc. Backscan - The distance that the system moves backward before it begins ascan. Set the backscan large enough to account for the greatest possible variationin feature height Length - Enter the vertical length that the system will scan during a measurement.To determine the appropriate length, estimate the peak-to-valley height of thestep/surface that you are measuring, and then set the length 10% to 20% higher. Threshold - Enter a percentage value to determine the acceptable signal-to-noiselevel for which a given pixel is considered valid. Data points that do not meet themodulation threshold are marked as invalid and are not considered for analysis.Follow these guidelines: If you lower the modulation threshold too much, poor-quality data pointswill be considered. If you raise the modulation threshold too much, high-quality data pointswill be eliminated. Home Scanner - check box to cause the scanner return to a given location (whichis different from the start of the scan) at the completion of the current scan. Afteryou make this selection, do the following: In the “Based on % of Pixels” field, enter the percentage of pixels to beused to calculate the height to which the system will return the scanner.For example, a 50% setting returns the scanner to the position at whichhalf the pixels have reached their maximum modulation. A 70% valuereturns the scanner to a lower position, where more pixels have reachedtheir maximum modulation. Click the From Top or From Button button to direct the system to return tothe fringe position relative to the top or bottom of the previous scan. Illumination - Select the Use Default check box to direct the system to apply theillumination filter that is most appropriate for the selected magnification and the
Bruker Optical Profilometer SOP Revision 103/02/12Page 6 of 13VSI measurement mode. Otherwise, select White, Green based on the followingconsiderations: White illumination has a wide bandwidth ( 200 nm) and is appropriate formost VSI measurements made at 1X and 3X speeds. This illumination modeprovides a short fringe envelope from which height can be readily calculated. Green illumination produces much narrower bandwidth illumination ( 25 nm)that creates a substantially longer fringe envelope. This is helpful whenmeasuring very rough surfaces. Green illumination should also be used whenperforming VSI measurements with 5X or greater speeds.Reference – The reference file contains all errors caused by small aberrations inthe system’s optics and was set at the factory. Checking the “Subtract” box willremove the error introduced by the system but is not useful for VSI measurements.DO NOT PRESS THE “GENERATE” OR “VIEW” BUTTONS!Averaging - Select the Average check box to direct the system calculate a finalresult by averaging the number of measurements that you enter in theMeasurements field.Autoscan - Select the “Enabled” check box and then enter scan values for lengthand then percentage value. The percentage of data collected is the percentage ofthe field of view over which fringes modulate during the scan. The scan length isthe user-defined limit of distance the scanner travels during a VSI measurementafter the defined percentage of image or pixels get modulation data (fringes).Processing Method - Select the type of Processing Method between VSI andVXI. Only when VXI has been selected from the drop-down menu will you be ableto make the rest of the selections - Resolution, SNR (Signal to Noise Ratio)Threshold. The options in the drop-down menu for Resolution include: Auto,Standard, High Fidelity, and High Speed. VXI is useful for 50µm scan ranges with minimal noise floor. It will showmuch better detail (lower noise) than a regular VSI measurement. But,since VXI captures every frame of data, it is a huge memory drain. Anysteps or structure 50um should be measured with VSI.4.5.7. Set the intensity. Use either Z control to move the fringes across your sample to find the brightestarea (white). If the detector is saturated, it will show red areas instead of white. Select the Auto button in the Intensity Control window, or manually slide the bar toget the brightest image possible without red areas Deselect the Auto button (Do not leave Auto Intensity on during yourmeasurement!!!)4.5.8. Press the Single Acquisition buttonto start the scan4.6. PSI Measurements4.6.1. Phase-Shifting Interferometry (PSI) uses a narrowband light source. It is typicallyused to test smooth surfaces (roughness less than 30 nm), such as mirrors, optics, orother highly polished samples. It is very accurate, resulting in vertical measurementswith sub-nanometer resolution. However, PSI cannot obtain a correct profile for objects
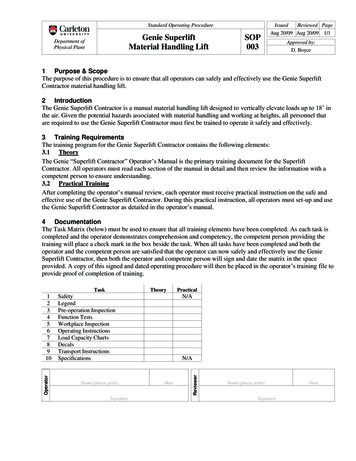
Bruker Optical Profilometer SOPRevision 103/02/12Page 7 of 13that have large step-like height changes. It thus becomes ineffective as heightdiscontinuities of adjacent pixels approach one quarter of the used illuminationwavelength (about 135 nm when using green light).4.6.2. Select PSI from the pulldown menu in the left window4.6.3. Select your objective (2.5X or 20X) from the pulldown menu4.6.4. Select your field of view (0.55X, 1X, 2X) from the pulldown menu. Note that theapproximate measurement area for the selected optics combination is automaticallyupdated in the Measurement Area section.4.6.5. Click on the Measurement Setup buttonand then the “Measurement” buttonin the left window and you will see the menu below4.6.6. Measurement Parameters Modulation Threshold - Enter a percentage value in the Modulation Thresholdfield to determine the acceptable signal-to-noise level for which a given pixel isconsidered valid. Data points that do not meet the modulation threshold aremarked as invalid and are not considered for analysis. Follow these guidelines: If you lower the modulation threshold too much, poor-quality data points willbe considered. If you raise the modulation threshold too much, high-quality data points willbe eliminated. Illumination - Select the Use Default check box (Always use green for PSI) Reference - Select the Subtract check box to use a reference file to subtract theerror from the system optics from the final measurement for the current selectionof optics. DO NOT PRESS THE “GENERATE” OR “VIEW” BUTTONS! Vibration Detection - Select the On check box and then enter a percentagethreshold at which the system should detect vibration. Phase Unwrapping - Select Standard for most measurements or Planar for veryflat surfaces.
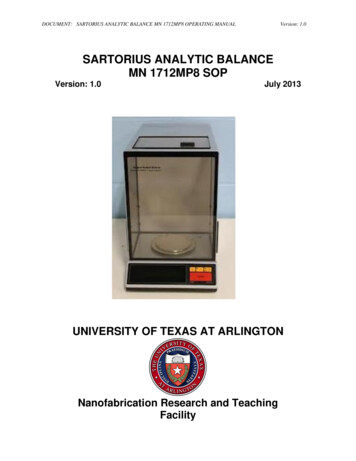
Bruker Optical Profilometer SOP Revision 103/02/12Page 8 of 13Check Intensity - Select the Reduce Saturation check box to direct the system toreduce saturation when the intensity level becomes too high to produce anaccurate PSI measurement.4.6.6.1.Set the intensity. Use either Z control to move the fringes across your sample to find thebrightest area (white). If the detector is saturated, it will show red areasinstead of white. Select the Auto button in the Intensity Control window, or manually slidethe bar to get the brightest image possible without red areas Deselect the Auto button (Do not leave Auto Intensity on during yourmeasurement!!!)4.6.6.2.Press the Single Acquisition button to start the scan4.7. Data Analysis4.7.1. When the measurement is complete, it will go to the Data Analysis Window. You canget to this window anytime by pressing the Data Analysis buttonin the top menu.4.7.2. The contour plot (2D) is the default and is shown above. The Data Analyzer Windowon the right side, shows all of the filters and analysis options that are active.4.7.3. Clicking on “Data” in the Analyzer Window will activate the Analysis Toolbox options.
Bruker Optical Profilometer SOPRevision 103/02/12Page 9 of 134.7.4. Analysis - To insert an analysis, simply click on it and it will be applied to the data.Please refer to the HELP menu for an explanation of what each analysis can perform.4.7.5. Filters - There are a few filters that are used most often. Once a filter is added to theData Analyzer Window, right-clicking on the filter will open the edit option. Be carefulwhen you select filters and analysis options. They will be applied and calculated in theorder you add them. Data Fill - Fills in area of bad pixels with High Data (50% higher than the highestpoint in the dataset), Low Data (50% lower than the lowest point in the dataset) ora user-defined value. Data Restore - Fills in small area of bad pixels using the height data surroundingthe drop-out area. Mask Data - Excludes user-specified areas from analysis. It has a number ofuses, including: Eliminating a bad spot from sample surface; Isolating a singlearea of sample surface for repeated analyses; Showing only data points within acertain height range. Analysis Mask: allow users to view or analyze only specific portions of adataset. Detector Mask: blocks pixel elements during a measurement. Terms Mask: an analysis mask that acts like a filter Terms removal (F-operator) – Is used to remove tilt and curvature.
Bruker Optical Profilometer SOP Tilt Only (Plane Fit) - To remove linear tilt from surface measurements.Since samples will usually have some inherent tilt, this term is almostalways removed when new data is taken.Modal Tilt Only - To adjust your results by removing the most commonor most representative tilt throughout the entire measurement,calculated by comparing each point with its neighbor.Mask - Select the Use Terms Mask check box to apply a Terms mask tothe dataset. Useful if you have large steps or only a particular surface isflat. See Appendix A for how to apply a Terms Mask.4.7.6. 3D Image – Press the 3D Plot button Revision 103/02/12Page 10 of 13(3D window shown below)From this window you can rotate and tilt by left-clicking and dragging to getthe desired look. You can also change the scale, image lighting, as well asthe colors by using the functions highlighted in the image above.4.7.7. Critical Dimension Plot - Click the Critical Dimensions iconto display theactive dataset as a Critical Dimensions (CD) plot (see the picture below). The CriticalDimensions plot provides Geometric Dimensioning and Tolerancing (GD&T)information on your data.
Bruker Optical Profilometer SOP Revision 103/02/12Page 11 of 13Use the tools on the left to measure lines, circles, angles, etc.4.8. Unloading or Exchanging Sample4.8.1. Raise the measurement head about a centimeter above your sample.4.8.2. Move the stage all the way to the front of the machine by pressing the Unload XYor by using the XY Control joystick on the control box.4.8.3. Remove your sample and exchange with next if needed.CAUTIONCAUTIONNEVER TRY TO REMOVE/EXCHANGE SAMPLES WITHOUT FIRST RASING THEHEAD AND MOVING THE STAGE TO THE FRONT!4.9. Shutdown4.9.1. Close the Vision 64 software. Note: Do not leave software open as this will leavethe light sources on and reduce the lifetime.4.9.2. Log off TUMI
Bruker Optical Profilometer SOPRevision 103/02/12Page 12 of 13APPENDIX A1. Level Using Terms Mask1.1. From the Analysis Toolbox, click on “Terms Removal (F Operator)” to apply the filter to theData Analyzer Window.1.2. Right-click on the Terms Removal in the Data Analyzer. This will bring up another menuand now click on “Edit Settings”1.3. Select Tilt Only and check “Use Terms Mask”, then click on “Edit Mask” as shown from thesteps in the SOP.1.4. The Mask Editor is shown below and displays the unleveled data.1.4.1. From the “Tool” dropdown menu, select whatever shape works best for your sample.1.4.2. On the “Region” check the “Inside” box
Bruker Optical Profilometer SOPRevision 103/02/12Page 13 of 131.4.3. Draw the box (or other shape) on an area you want to include in the levelling processand click “Mask”. Do this for a few regions and they will be grayed out as shown below.1.4.4. Now click on “Invert Mask”. This will make your selected areas active and the rest ofthe data inactive.1.4.5. Now click “OK” and your sample will be leveled using the masked data
Bruker Optical Profilometer SOP Revision 1 03/02/12 Page 1 of 13 Bruker Optical Profilometer SOP The Contour GT-I, is a versatile bench-top optical surface-profiling system that can measure a wide variety of surfaces and samples. Contour GT optical profilers measure surface topography (2D and 3D) with high accuracy in a range from fractions of .File Size: 1MB