Transcription
NEWSWELCOME TO THELEISURE DOMEISSUE 5FOOD& BEVERAGEUnder-served and over-supplied marketsA N AT I O NOF LEISURELOVERSWhy spend is no longer discretionaryCLIENTINTERVIEWSLoungers, Adventure Leisureand Oxygen Freejumping
INTRODUCTIONKEYTAKEAWAYS LEISURE IS BIG BUSINESS. SPEND TOTALLED 238 bn IN 2016, ACCOUNTING FOR 20%OF CONSUMER SPENDING. L EISURE SPEND IS SUSTAINABLE – CHANGINGCONSUMER PRIORITIES NOW MAKES LEISURESPENDING FAR LESS DISCRETIONARY. F &B IS THE TRAILBLAZER. NEW SHOPPING CENTRESTYPICALLY ALLOCATE 20% OF SPACE TO F&B ANDMANY EXISTING SCHEMES ARE BEING BACKFILLED.Iwould like to think I have seen most things over the past 15/20 years in theleisure sector, but I have never seen such a disparity between investor demandand market supply as today.Before leisure became “institutional”, the definition of prime was tiny, and thedomain was sub 20m, 15 year income with rent indexation. Prime remainsthe “golden egg”, but significant emphasis is now placed on the scheme/tenantperformance, and the opportunity that gives the owner to leverage genuine openmarket rental growth.As a positive consequence, most pro-active owners now understand that therelationship with their tenants is more than just rent collections. However, morenow than ever, if any operator or owner becomes complacent, the scheme orbrand can quickly fall out of favour. Ownership and operation in the leisureworld is extremely “hands on”, and we try to take the same view when advisingin such a vibrant and progressive market. HE F&B MARKET IS GEOGRAPHICALLY POLARIZED.TSOME MARKETS ARE OVER-SUPPLIED AND SOME RENTSARE UNSUSTAINABLE – SOME FALL-OUT IS INEVITABLE.ANDREW MCGREGOR C ONVERSELY, SOME TOWNS ARE STILL UNDER-SERVEDF&B MARKETS, INCLUDING MANY REGIONAL CENTRES.PARTNER - HEAD OF OUT OF TOWN RETAIL ANDLEISURE INVESTMENT THE LEISURE MARKET CAN’T AFFORD TO STAND STILL –AND IT ISN’T. SUB-SECTORS SUCH AS CINEMAS ANDBOWLING ARE EVOLVING AND THE RISE OF “COMPETITIVESOCIALISING” IS SPAWNING A RAFT OF INNOVATIVENEW OPERATORS. L EISURE HAS BECOME A RECOGNISED ASSETCLASS. IT IS NOW AT THE TOP OF MANY INVESTORS’SHOPPING LISTS.-1-R E TA I L N E W S
LEISUREDASHBOARDLEISURE SPEND – CONSUMERS PUTTING MONEY WHERE THEIR MOUTH IS 238BNESTIMATED LEISURE SPENDIN THE UK IN 2016 5.7%AVERAGE ANNUAL GROWTHIN LEISURE SPEND OVERTHE LAST 30 YEARS 429%TOTAL GROWTH IN LEISURESPEND (1985-2016) 1IN EVERY 5AMOUNT OF CONSUMERSPEND CHANNELLEDINTO LEISUREF&B – STILL HOT OR JUST OVER-HEATING?42%EATING OUT ASA PROPORTION OFALL LEISURE SPENDING6%-7%PROPORTION OFSHOPPING CENTRE SPACEHISTORICALLY DEVOTEDTO F&BNON F&B KILLER LEISURE STATS22%PROPORTION OF SPACEDEVOTED TO F&B ATTRINITY LEEDS 150/SQ FT F&B RENTS IN CERTAINCENTRAL LONDONHOTSPOTS“THE WALL OF COSTS” 7.50vs 7.20MINIMUM WAGE INCREASE(AS OF APRIL 2017)800/4,244NUMBER OF CINEMAS/SCREENS IN THE UK IN 201633%PROPORTION OFUK POPULATION WHOHAVE BEEN 10 PIN BOWLINGOVER THE LAST YEAR5.4MESTIMATED TOTALUK GYM MEMBERSHIP100 NUMBER OF TRAMPOLINEPARKS ALREADY IN THE UKA COMPELLING INVESTMENT CASE FOR LEISURE PROPERTY 26.2%THE AVERAGE INCREASEIN BUSINESS RATES ALLRETAIL/LEISURE OUTLETSIN LONDON FACE FROMAPRIL 201742.0%THE UPPER CAP INTRANSITIONAL RATE RELIEFAVAILABLE FOR UNITS WITHRV 100K-4.1%THE LOWER CAP INTRANSITIONAL RATE RELIEFAVAILABLE FOR UNITS WITHRV 100K 482.5MLEISURE PROPERTYINVESTMENT VOLUMES 201650%PROPORTION OFTRANSACTIONS (BY VOLUME)IN 2016 BY UK INSTITUTIONS 108Mvs 98mPRICE ACHIEVEDFOR PRINTWORKSIN MANCHESTERVS ASKING PRICE5.00%PRIME LEISURE PARKYIELDS (AS OF MARCH 2017)
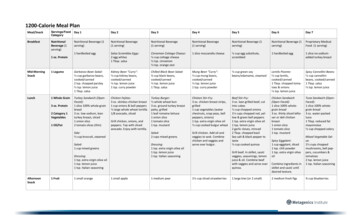
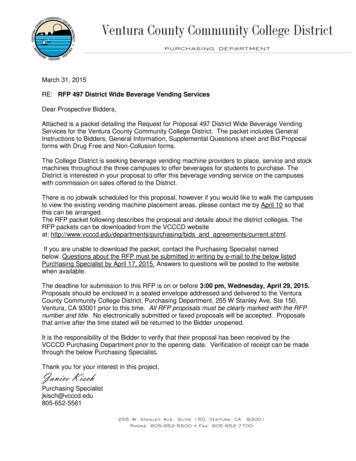
LEISURE SPEND 1985-2016Source: ONS, Knight Frank‘LEISURE’ DEFINED AS ‘RECREATION & CULTURE’ AND ‘RESTAURANTS & 17%50,00016%ISSUE 1995Source: ONS, Knight Frank‘LEISURE’ DEFINED AS ‘RECREATION & CULTURE’ AND ‘RESTAURANTS & HOTELS’.25%20%15%10%5%0%LEISURE SPEND GROWTH 5%1987“Leisure spend inthe UK has morethan quadrupledover the last 30years ( 429%).”SHARE OF CONSUMER SPENDING (%) (RHS)LEISURE SPEND ANNUAL GROWTH 1986-20161986Growth sectorsProbing a bit more deeply into the numbers, which arethe fastest growing leisure sub-sectors? There are three “fine”spend categories that correspond most closely to what arewidely perceived as the key leisure segments – Restaurants &Cafes, Recreational & Sporting Services and Cultural Services.Purely in terms of growth, Recreational & Sporting Serviceshas been the trailblazer. Fuelled by higher participation insporting activities and a far more health-conscious consumer,spend has skyrocketed sixfold over the last 30 years and thesector is now worth ca. 9 billion annually. This translatesto a CAGR of 6.9%, significantly ahead of both All Leisure( 5.7%) and All Consumer Spending ( 5.3%). As the mostobvious standard-bearer for theRecreational & Sporting Servicessub-sector, gyms have enjoyed almostmeteoric growth over the last 30 years.Mintel estimates that there are nowmore than 3,000 health & fitnessclubs across the UK and membershipcontinues to grow.The slightly more ambiguouslytitled Cultural Services sub-sector(which includes a wide range ofleisure pursuits including cinema,theatre and museums) has alsowitnessed stellar growth over both a short and longer-term.A 30 year CAGR of 6.2% is comfortably above both AllLeisure and All Consumer Spending. Cultural Services spendsurpassed the 20 billion mark for the first time in 2016.Over the past 30 years, spend levels have increased fivefold.Over the last decade, growth has even outstripped that ofRecreational & Sporting Services ( 55% versus 40%).Perhaps surprisingly, the growth trajectory of Restaurants &Cafés has been slightly less dramatic. The sector has grown at aCAGR of 5.1% over the last 30 years, which is slightly below AllConsumer Spending ( 5.3%). Given the extent to which the food& beverage market has evolved in the intervening period and thefact that the concept of eating out has become so commonplace1985Fact: leisure accounts for an increasing share of our hardearned cash. Hard and fast figures on total leisure spend arehard to elicit due to the multitude of sub-sectors it encompasses,but all tangible evidence suggests that leisure accounts for agrowing proportion of the consumer wallet.How big is the UK leisure sector? Aggregating the two“coarse” ONS consumer spend categories that incorporateleisure (‘Recreation & Culture’ and ‘Restaurants & Hotels’),leisure spend in the UK totalled around 223 billion in 2015.Extrapolating the first three quarters of 2016, we estimatethat this figure rose to around 238 billion last year. Leisure isclearly big business.How fast is it growing as a sector? The short answer isfaster than most other facets ofconsumer spending. Over the last 30years, consumer spending overall hasincreased at a compound averageannual growthrate (CAGR) of 5.3%. Leisurespending has increased at a CAGRof 5.7% over the same period.A small difference numerically, but oversuch a long timeframe, this representssubstantial outperformance.Perhaps the absolute figures tell amore impressive story still. Leisurespend in the UK has more than quadrupled over the last30 years ( 429%). Even over the last decade, which, lest weforget included the worst recession in living memory, leisurespend expanded by 29%, a net increase of nearly 50 billion.As a result, leisure spend as a proportion of the overallconsumer wallet has slowly but surely crept up. Back in 1985,leisure accounted for 17% of overall consumer spending.At its peak in the early 2000s, this proportion reached asmuch as 21%. A dip during the financial crisis and subsequentrecession has since been arrested and this share is again onthe rise – in 2016, we estimate that it was just shy of 20%(19.7%). Expressed another way, 1 in every 5 spent in thiscountry is channelled into some form of leisure-based activity.2009LEISURE SPEND ( m) LHS199419931992199119901989198819871986Enjoying ourselves is no longer a luxury,it is a priority and high levels of leisure spendare sustainable despite economic headwinds.19%150,0001985W O R D S : S T E P H E N S P R I N G H A M , PA R T N E R , H E A D O F R E TA I L R E S E A R C H2016A NATIONOF LEISURE LOVERSSHARE OF CONSUMER SPENDING (%)among consumers (particularly families), this growth rateappears surprisingly low. However, the figures do need somequalification. Restaurants & Cafés is by far the largest of theleisure sub-sectors, with estimated spend of ca. 80 billion in2016, so any growth is being leveraged off a much higher base.For all its evolution, it is also the most mature of leisure subsectors, so is likely to achieve less spectacular growth than someof its newer peers.But even allowing for these caveats, the absolute figuresare still very impressive. The sector has seen spend expandby around 19.8 billion over the last decade alone andcontinues to enjoy growth of ca. 3 billion per annum.On this basis, “underperformance” compared toAll Consumer Spending is largely relative.“Discretionary” spending is being redefinedIf there is a question mark over the leisure sector it is thedurability of this spend – the leisure market is perceived tobe more fickle than other spend categories, particularly thoseover which the consumer has minimal influence, such ashousing and transport. Even retail is regarded to be farless volatile as a spend category.Leisure is ostensibly still at the most discretionary endof the spending spectrum. Economic wisdom wouldtherefore dictate that it is the first category to give way intimes of hardship and austerity. History certainly supportsthis view. Leisure may have consistently outperformed allconsumer spending over the last 30 years, but during thelast recession (2008-2012) this broader trend was reversed.-5-R E TA I L N E W S
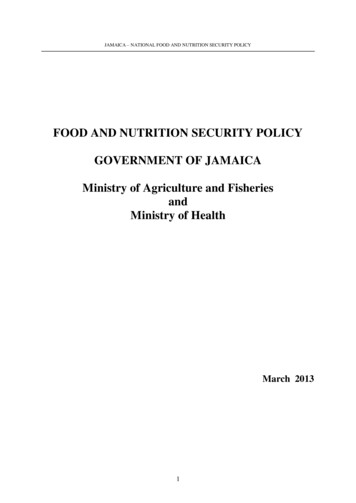
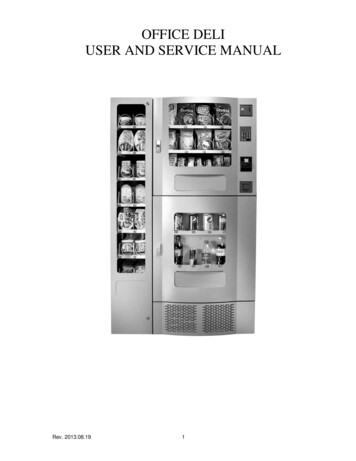
“BREAKDOWN OF LEISURE SPEND – DECEMBER 2016LIVE SPORTS EVENTSTHEATRE/CINEMAOTHER LIVE EVENTS8.4%BOWLING4.8%GYM MEMBERSHIP9.0%MUSEUMS, ART GALLERIES& OTHER ATTRACTIONS%2.95.6%24.0%DRINKING OUTGAMBLING (CASINO & GAMING).2%42”Source: GREENE KING LEISURE SPEND TRACKER, JANUARY 2017%1.5 7%1.There is evidence to suggest that leisuremay have undergone a redefinition of priorityin consumers’ minds. For many,it is less “discretionary” than economistswould have us believe.EATING OUTLEISURE VS CONSUMER SPEND INDEX (1988 100) 1985-2016Source: ONS, Knight Frank‘LEISURE’ DEFINED AS ‘RECREATION & CULTURE’ AND ‘RESTAURANTS & HOTELS’.900Index (1985 100)and continued to spend on clothing as they had done before.What constituted “discretionary” previously had beenredefined. For many consumers, fashion shopping was nolonger a luxury, it was a necessity.In the intervening period, there is evidence to suggest thatleisure may have undergone a similar redefinition of priorityin consumers’ minds. For many, it is far less “discretionary”than economists would have us believe and therefore far lessvulnerable to an economic downturn or forced austerity.Enjoying ourselves is no longer a privilege nor a luxury,it is a priority. And share of wallet will be allocatedaccordingly, whatever the prevailing economic climate.Indeed, in the nadir of the financial crisis (2009), the declinein leisure spend was more severe (-5.6%) than in overallspending (-2.4%).Will history repeat itself as we again enter a periodof political and economic uncertainty? There are parallelswithin the retail sector to suggest that this will not necessarilybe the case. Within retail, there is a distinct hierarchy ofdiscretionary spend sub-catories. Broadly speaking, foodis rarded as non-discretionary and comparison goods items(e.g. clothing, household goods) as discretionary. Mosteconomists predicted a collapse in non-food spend duringthe last recession that simply did not materialise. Thereason? The consumer had scant regard for economic logic800700600500400300200RESTAURANTS & CAFESCULTURAL SERVICESALL LEISURE PORTING SERVICESALL CONSUMER SPENDLEISURE SPEND GROWTH VS CONSUMER SPENDING GROWTH 1986-2016Source: ONS, Knight Frank‘LEISURE’ DEFINED AS ‘RECREATION & CULTURE’ AND ‘RESTAURANTS & HOTELS’.20%15%10%5%0%CONSUMER SPEND GROWTH (%m)ISSUE 2199119901989198819871986-5%LEISURE SPEND GROWTH (%)-6--7-R E TA I L N E W S
F&B: STANDARD BEARERFOR THE LEISUREINDUSTRYW O R D S : D AV I D L E G AT, PA R T N E R , R E TA I L A G E N C YThe role of F&B in retail has changed dramatically.Historically an after-thought, it is now a vital componentof any location trying to create a “sense of place” –and it more than pays it way.Leisure is a catch-all term for what is actually a highlydiverse sector. The array of pursuits that fall under thewider umbrella of leisure is both broad and expanding.However, eating out is by far the largest and mostconspicuous facet of the whole leisure market. Indeed,F&B is not only a standalone market in its own right, itis invariably a complementary component of virtuallyevery leisure concept. In many cases, it is where the leisureoperators actually make their money, the main event itselflargely being a device to pull people in.No longer the poor relation to retailFor all its maturity as a concept, F&B continues to evolveat a fairly rapid pace. Recent history has seen increasingproportions of leisure, especiallyF&B, being integrated into retailschemes, both in-town and out-oftown. The number of casual diningrestaurants in the UK has boomedin the last five years as consumerscontinue to embrace a huge varietyof new, fun dining concepts.Landlords are working hard toaccommodate this demand; onexisting shopping centres theyare working to adapt outdatedfirst generation space to meetmodern requirements, while on new schemes developersare dedicating an ever increasing proportion of their floorspace to leisure. The historic “rule of thumb” was that F&Btypically made up 6%-7% of floorspace in a shopping centre.However, this proportion has trended upwards in recent years,in some cases substantially so. Westfield Stratford City raisedthe bar considerably when it opened, with around 17% ofspace dedicated to F&B and in excess of 70 dining options.Trinity Leeds originally proposed around 10% leisurefloorspace – when the scheme finally opened in March 2013,this allocation had increased to 22%. The narrative behindthe higher space allocation to leisure is to increase dwell timeand create “a sense of place”. But beneath the rhetoric, thenet result of this higher proportion of leisure is often farmore commercial – higher levels of customer spend. WhileF&B may have been seen in the past as something of aspace-filler and primarily a driver for the retail floorspace,it is increasingly a money-spinner its own right.London versus the regionsWhile London does have the highest concentration of casualdining restaurants and also the highest growth rates in termsof new openings since 2012, this leisure focus is by no meansconfined to the capital and the rest ofthe UK is not far behind. Brands onthe whole still favour London as theirtraining ground before branching outto the rest of the nation, perhaps asconsumers are so faddy and alwayswant to try the latest concept.But the F&B market in CentralLondon is facing something of areality check in 2017. On the backof the rates revaluation there is likelyto be a significant (and imminent) risein property costs, over and above theexpected inflationary price rises and additional cost of bothproduce and staff. Ongoing uncertainty around Brexit is nothelping matters, with the fate of the skilled migrant workers,upon which the Central London restaurant scene relies, farfrom certain.Against this uncertain backdrop, rents are already atrecord levels in Central London. Mayfair is 150/sq ft and Soho is reportedly not far off this level. These recordrents are bound to claim a few casualties, taking into account“The F&B marketin Central Londonis facing somethingof a reality checkin 2017.”ISSUE 5-8-expected higher operational and occupancy costs, despitethe transitional relief that some operators will benefitfrom when it comes to the rate increases. In the face of apotentially over-heating market, we expect rents to plateauand operators to take a moreconsidered approach in assessingthe viability of opportunities whenthey present themselves.As the capital becomes ever moresaturated with operators, somerestaurateurs are choosing to buckthe trend and start up in regionalcities. One example is Mowgli,an Indian street food restaurantwhich started life in Liverpool andnow has three restaurants openand trading all in the North West,with a small number of moreon the horizon and no doubt aLondon debut will follow.Those towns, cities andshopping centres which areundersupplied with casual diningare likely to see the largest levelsof growth in new concepts overthe next few years as restaurateurstry to exploit this undersupplyand escape the highly competitiveLondon market. We assess theextent to which individual markets and towns are underor over-supplied in the next section of this Newsletter.leisure provision has come a long way from the traditionalfood courts, typically banished to the upper or lower reachesof schemes. The mix and type of leisure necessary toincrease footfall is diversifying significantly.In the majority of cases, acinema is still seen at the anchorfor a traditional leisure scheme.In The Arndale EastbourneExtension, for example, the preleasing of a 32,000 sq ft Cineworldprovided the comfort to the casualdining brands that there wouldbe day and evening leisure spendwithin the scheme, and so brandssuch as Carluccio’s, Wagamama,Nando’s, Ask and Byron allcommitted to the scheme.Beyond the traditional cinemaanchor, landlords are seeking otherways to differentiate the leisureoffer. We have seen concepts suchas KidZania opening in WestfieldLondon, and this tendency isspreading throughout the spectrumof the shopping centre hierarchywith soft play, trampolining, crazygolf and various other conceptsbeing introduced to not only helpenhance the shopper experience,but in many cases help to solve the problem of what mightotherwise be empty spaces.From space-filling, low rent after-thought to frontof-house revenue-generating necessity, the rise of F&Bwithin the retailing hierarchy has been significant. Its roleas a bridgehead between the mainstream retail offer anddestination leisure elements should also not beunder-estimated.“Those towns,cities and shoppingcentres which areundersuppliedwith casual diningare likely to seethe largest levelsof growth in newconcepts over thenext few years.”F&B: the ideal complement to otherleisure activitiesIt is not just the scale of provision that has changed.The nature of F&B has also evolved considerably in recentyears, particularly within shopping centres. Over the years,-9-R E TA I L N E W S
LOUNGERSINTERVIEWWORDS: RAJ MANEK, PROPERT Y DIRECTORWith a dual-brand strategy (Lounges and Cosy Clubs), Loungers isone of the new breed of highly successful informal food-led café/bars.The business is highly acquisitive and is poised to open its 100th site.QQ For those unfamiliar with your brand and conceptcan you explain what you offer and how it works?AA We are a true all-day A3 operator. We have two distinctconcepts: Lounges and Cosy Clubs. Lounges are traditionallylocated in towns and suburb locations. Lounges are homely,relaxed and slightly eccentric and they offer quality, value-formoney, casual dining and drinking. As a result they attract adiverse customer base including young professionals, mums,families, over 60s and students. The concept is informal,resulting in a rolling customer base where customers use“their Lounge” to fulfil differentneeds at different times of the day.Cosy Clubs are playful andunashamedly celebrate all-thingsBlighty; think “gent’s club meetsvillage hall meets cricket pavilion”.Cosy Clubs are more formal and a“grown-up” model with a premiumfood and drink offering, althoughthe Loungers value-for-moneyethos still prevails. We focus onprime city centre retail locations,for example Liverpool One, CardiffSt Davids and Bath Southgate.restaurant and bar trade they decided it was time they didtheir own thing. They found an empty opticians on NorthStreet in Bedminster, raised 30,000 between them andwith the help of a 20,000 small business loan opened TheLounge on Tuesday 29th August 2002. The original Loungeis still open today.QQ Loungers operate in a highly competitive market,can you tell us what differentiates you fromyour competition?A We are able to appeal to a widerange of demographics and agegroups; we focus on providing ahomely/informal atmosphere andwe offer a quality value-for-moneymenu. We are successfully able toattract customers back on multipleoccasions – you might come in fora panini at lunch during the week,a quick dinner and glass of winewith friends in the evening andthen again for breakfast onthe weekend.QQ How many sites do you currently have across theUK? And how many more units are you planning?AA We will be up to site 100 in May this year. At the momentwe are aiming for between 20-30 new sites per year.The concept is scalable and we believe in our abilityto have 500 sites nationally. Are there any overseasexpansion plans? At the moment no, there is still a lotto do in the UK.QQ Loungers often trade under individual names ineach location, what is the rationale for this?AA Yes, all Lounges have a different name and the namealways ends in the letter ‘O’. Each Lounge fitout is tailoredto the history of the building or the location. With a uniquename and a unique fitout for each restaurant we cancreate the feel of an independent restaurant (as opposedto a chain) – in this way we give each Lounge a betteropportunity to become more quickly established within thelocal community. Cosy Clubs are just called Cosy Clubs buteven here each fitout is unique.QQ What are your key requirements when consideringa site for a new acquisition?AA For Lounges we are looking for a healthy high street, withlimited vacancies and a good variety of types of retailer. Tous this indicates that residents in the surrounding communityuse this pitch, and are therefore likely to use us. For Cosys,the focus is on character buildings (e.g. Grade II Listedformer Midland Bank for Cosy Club Birmingham) orvery prominent shopping centre locations (e.g. Cosy ClubLiverpool located on the first floor site in the middle ofLiverpool One).QQ Which of your competitors are you impressed withmost and why? Are you happy to trade alongsideyour competitors?AA To be honest, there is something impressive about almostevery competitor – whether it is the menu, consistent qualityof food, quality of fitout – everyone is good at at leastsomething, otherwise they wouldn’t still be here. Nando’sare a fantastic model, a very specific menu offer but theycontinue to be successful everywhere they open. Turtle Bayhave seen phenomenal growth here in the UK and are nowexpending into Europe, with sites in Germany. The realchallenge that everyone faces is being flexible enough toevolve with changing demand.QQ What is the biggest hurdle in the UK to acquiringnew stores?AA For Lounges it is challenging to find 3,500-4,500 sq ft unitsin some towns and centres, due the limited supply of largeunits. This is in line with many retailer requirements, whocan move much more quickly than us (no planning/licencingrequired, shorter fitout periods). We are also very strict withour rent levels, which often means that we cannot get tolandlord expectations for high demand sites.QQ What is next for Loungers?AA We recently received significant backing and investmentfrom Lion Capital in a transaction valuing the businessat 137m. They bring with them significant experience(Wagamama, Weetabix, Kettle Foods). With site 100around the corner, we are now making plans to getto site 200.“Cosy Clubsare playful andunashamedlycelebrate all-thingsBlighty; think gent’sclub meets villagehall meetscricket pavilion.”QQ What drew you to Loungers?AA I joined in June 2013. Piper PrivateEquity had invested a year earlierand the annual site rollout was in theprocess of being ramped up from12 to 20 per year. It was a fantasticopportunity to get involved in the growth of such a uniqueand successful concept.QQ How and when did Loungers begin in the UK?AA Loungers was founded in Bristol in 2002 by Dave Reid,Alex Reilley and Jake Bishop. Having spent years in theISSUE 5Q With so many differentA3 operators in the UK marketand more emerging brandseach day almost, do you thinkthe current number ofrestaurants is sustainable?A We have already seen some longestablished operators cut back on new openings and look closely attheir offer and brand. The availability of staff in our sector standsto be negatively impacted due to Brexit. Business Rates are goingto be a big headache for those with “London/South East heavy”estates. However, it seems that every week there is a new conceptbeing launched, so there is still healthy customer demand out there.- 10 -- 11 -R E TA I L N E W S
F&B: OVER- ANDUNDER-SERVED MARKETS“There has also beensomething of a herdingmentality – A3 operatorswill inevitably gravitateto locations where theirpeer group, and indeedcompetitors, havealready ventured.”WORDS: STEPHEN SPRINGHAMThe F&B “gold rush” of recent years has given riseto a very polarised market. Some markets are alreadyover-heating, while others have been left behind.Where’s hot and where’s not?The UK leisure market bears many of the traits of aWild West Gold Rush – identification of a gilt-edgedopportunity; a mad, chaotic pursuit from speculators (withlimited forward planning); inevitable winners and losers; adegree of consolidation and fall-out; subsequent transitionto a more stable, mature and sustainable market.A consumer more pre-disposed to eating out and the needfor retail locations to offer a more rounded, experientialproposition are the two gilt edged opportunities. Thespeculators are the growing masses of F&B operators, whichinclude long-established domestic players, new upstarts andfledgling brands/concepts, plus fresh entrants from overseas.The gold rush itself started a few years ago now and is stillongoing. However, the final two acts still have to play out.The chase for space has been a frenetic one. In a bid toremain competitive, operators have often put on the blinkersin their pursuit of sites and potentially lost sight of the biggerpicture. As was the case with retailers when they were ingold rush mode in previous retail booms, there has also beensomething of a herding mentality – A3 operators will inevitablygravitate to locations where their peer group, and indeedcompetitors, have already ventured.This approach has inevitably given rise to a very polarisedF&B market. What were previously leisure hotspots have,in some instances, tipped over to become over-supplied inF&B – in simple terms, there is not sufficient consumerdemand to justify the number of eateries that are in sometowns and locations. In others, rents have also skyrocketedand the desire amongst operators to trade there hasoverridden their financial modelling. However good theselocations are, rents have become unsustainable for operatorsto maintain a profit.Nor is rent the only cost pressure in many locations.F&B hotspots are also very exposed to aggressive businessrate revaluations. Even allowing for Transitional Reliefs, manyrestaurants in Central London particularly have been subjectedto a 42% business rate hike in April this year (and, as thingsstand a further 32% in 2018 and 49% in 2019). Throw theincrease in The National Living Wage into the mix, margins foroperators will inevitably come under severe pressure.ISSUE 5Some over-supplied markets will undoubtedly see a shake-out.Conversely, at the other end of the spectrum, there are stillplenty of towns and locations that do not have an adequateF&B offer. In the rush to acquire sites and keep with the herd,many locations have slipped under the radar and there arestill plenty of back-fill opportunities for operators.Well served markets – overheating?Which towns fall into which category? There are no setparameters or metrics to determine the optimum level ofF&B provision, but there are various methodologies whichcan be applied to provide a useful high-level steer.The table on page 14 provides counts of F&B outlets bycentre from Experian’s GOAD classification. As there arenuances of definition e.g. whether a bar is just that, a pubor indeed a hybrid restaurant, we have included five F&Bsub-categories and provided the Top 20 centres by aggregatedcounts. CACI’s overall Retail Ranking for that centre has alsobeen appended, as an indicator of where that centre sits in theoverall national hierarchy.To a certain degree, the Top 20 leisure locations throws upfew surprises in that London and major regional cities predominate – it’s logical that the largest locations will have thehighest proportion of F&B options. Major regional cities suchas Manchester, Leeds, Glasgow, Birmingham and Liverpool allfeature in both Top 10 lists, with the odd change in order e.g.Glasgow ranks a place above Manchester in CACI’s list, butone below in the leisure list.But cross-comparisons between the centres do reveal someinteresting variations. For example, Birmingham emerges asvery light on pubs relative to its peers, with just 28. Combiningpubs and bars/wine bars to iron out any nuances of definitionexpands this number to 85 – this is still less than half theequivalent figures for both Glasgow (177) and Manchester (183).If any of the Top 10 centres were light on the F&B side, thistop-line analysis would sugges
under-served and over-supplied markets - 1 - retail news key takeaways leisure is big business. spend totalled . stephen springham, partner, head of retail research leisure spend 1985-2016 source: ons, knight frank . greene king leisure spend tracker, january 2017 gym membership live sports events theatre/cinema