Transcription
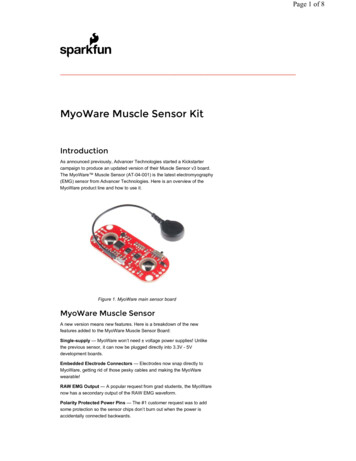
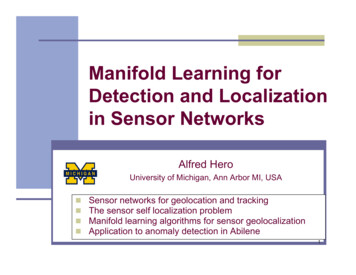
ththICUC9 - 9 International Conference on Urban Climate jointly with 12 Symposium on the Urban EnvironmentA Mobile Sensor Network to Map CO2in Urban EnvironmentsLee, J.K1, Christen, A.1,2, Nesic, Z.1,2, Ketler, R.11 Department of Geography, University of British Columbia,1984 West Mall, Vancouver, BC, Canada,joseph.lee@geog.ubc.ca2 Biometeorology, Faculty of Land and Food Systems, University of British Columbia,MacMillan 137, 2357 Main Mall, Vancouver, BC, Canada,dated : 15 June 2015IntroductionThere are a variety of models and methods that can characterize and quantify the global increase in carbon dioxide(CO2) mixing ratios in the atmosphere and their links to anthropogenic emissions and terrestrial and oceanic sinks(Marland et al., 2009). However, quantifying, mapping, visualizing and monitoring CO2 emissions and sequestrationat policy relevant scales - the local to urban scale - remains a challenge (Christen, 2014). Emerging modular opensource technologies are allowing for the miniaturization, mobilization and increasing accessibility of sensor systemsthat may be a promising way to observe and map CO2 mixing ratios across heterogenous and complex landscapes,including urban environments (Snik et al., 2014). These measurements can serve as input for inverse modelling ofemissions and as input data for the visualization of urban emissions in the context of science-communication topublic. We present a system for monitoring CO2 mixing ratios in cities using a network of mobile CO2 sensorsdeployable on vehicles and bikes combined with geo-spatial analysis and visualization tools.Methods & ResultsDesign & TestingComponents from the Arduino platform (Arduino CC, Ivrea, Italy), an opensource programmable microcontroller,were coupled with Li-Cor's Li-820 infrared gas analyzer (IRGA) (Licor Inc., Lincoln, NB, USA) to prototype a portableCO2 analyzer for possible future CO2 monitoring, and pollution mapping in general. With low cost compactcomponents, open code base, and flexible hardware interfacing, the Arduino platform provided a lightweight andmodular prototyping environment capable of communicating digitally with the Li-820 IRGA, a GPS (Adafruit UltimateGPS Logger Shield with GPS Module, Manhattan, New York, USA) unit, and digital temperature thermometers(Maxim Integrated One Wire Digital Temperature Sensor - DS18B20, San Jose, CA, USA). The system requires 12volts of power which can be supplied by battery or via car cigarette lighter socket and measures CO2 mixing ratios,geoposition (latitude/longitude, speed, altitude, and satellite strength), and internal and external air temperaturewhich are logged onto a micro SD card at 1-second intervals. Air is drawn into the system through a 3m long inlettube (6.35mm diameter, Dekron Bendable Tubing, Mt. Pleasant, Texas, USA) using a small KNF gas pump (KNFNeuberger, Inc., Trenton, NJ, USA) at 700 cc/min as recommended by Licor. The system is 35.8cm x 27.8cm x11.8cm, weighs 2.6 kg and is contained in a weather-proof case.
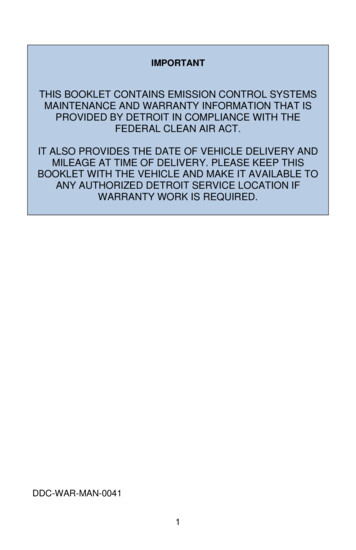
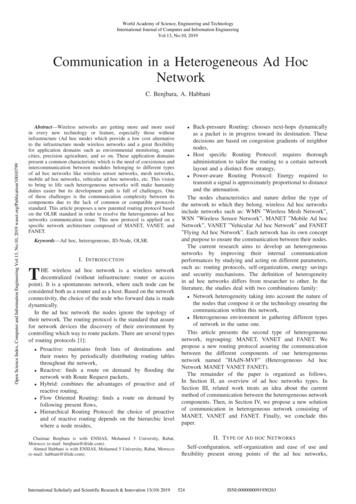
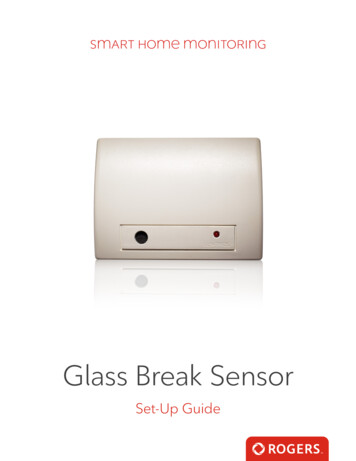
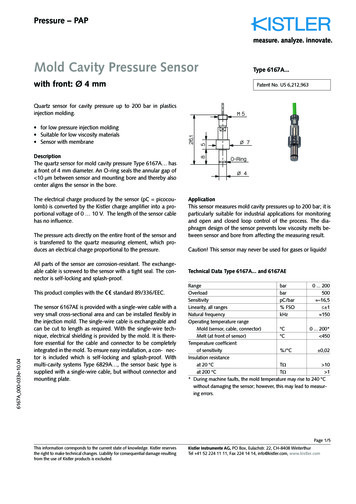
ththICUC9 - 9 International Conference on Urban Climate jointly with 12 Symposium on the Urban EnvironmentFigure 1: Mobile CO2 System including (1) Licor Li-820 Infrared gas analyzer, (2) Adafruit GPS, OneWire digital, (3)Arduino Mega Microcontroller, temperature thermometer (not shown).Several key system specifications were evaluated, namely: precision, accuracy, drift, and total delayed responsetime. To test for system precision, a 6-point calibration was performed using six tanks of known mixing ratios of CO2calibrated against CDML / NOAA standard tanks. This test showed a strong linearity and a root mean square error2(RMSE) of 1.1 ppm for the six different CO2 mixing ratios at a R of 0.99.Figure 2: Multipoint Calibration of Sensor System showing observed values versus known concentrations.Sensor accuracy and drift were tested over the course of 7 days in the lab, each sensor drawing in air from the samepoint outdoors. The accuracy between the sensors, determined by the RMSE, was /- 3ppm, while the drift was up to /- 4 ppm over the seven days from the average of the 5 measurements.
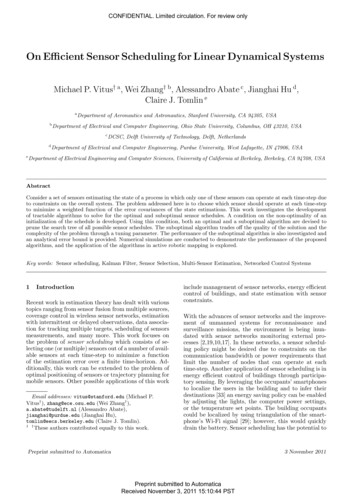
ththICUC9 - 9 International Conference on Urban Climate jointly with 12 Symposium on the Urban EnvironmentFigure 3: Testing for sensor drift of the five mobile sensors over a seven-day measurement period. Each linecorresponds to one of the five mobile CO2 sensors.In order to properly geotag the measured CO2 mixing ratios when traveling on a vehicle, the total delayed responsetime was calculated based on the cumulative elapsed time between when a sample of air enters the system's 3 mlong inlet tube until 50% of the time it takes for the instrument’s cell to be filled with the gas and measured by thesystem itself at a flow rate of 700cc/min. To test this, a solenoid switch was used to pass nitrogen gas ("zero gas")into the sample tube inlet while simultaneously logging the exact second in which the solenoid was triggered. Thetotal delayed response time of the system using a 3 m inlet tube was determined to be 13 seconds; this value is usedto offset the measured CO2 mixing ratios.Measurement CampaignA total of 5 mobile prototype sensors were built. This pilot ‘fleet’ of sensors were tested in a measurement campaignin the city of Vancouver, BC, Canada. In this focused measurement campaign, the goal was to determine thevariability of CO2 in the urban canopy layer, across a range of urban land use types and densities within a short timeframe (3.5 hours). The dataset is used to showcase the potential of such measurements to aid in point- and linesource mapping. The measurement campaign was designed such that nearly all grid cells sized 100m by 100m2within a 12 km transect used in previous research for detailed emissions mapping (Environmental Prediction inCanadian Cities (EPICC) transect from Van der Laan, 2009) would be traversed at least once by one of the sensorsduring a 3.5 hour measurement period between 10:30 to 14:00. Both cars and bike with sample inlet tubes raised to2 m height were used to cover the street and lane grid and to traverse paths inaccessible by car.Figure 4: Environmental Prediction in Canadian Cities (EPiCC) Transect and streets sampled in measurementcampaign
ththICUC9 - 9 International Conference on Urban Climate jointly with 12 Symposium on the Urban EnvironmentFigure 5: Sensor installation on (a) vehicle and (b) bike. The sample tubes reach approximately 2m height.The results of the measurement campaign showed CO2 mixing ratios ranging from 390 ppm, most likely related toareas with high density of photosynthesizing vegetation such as in parks, to 906 ppm in CO2 plumes from vehicleexhaust. In general, the grid cells covering major arterial roads and downtown core of Vancouver showed the highestmaximum, minimum, median and mean of CO2 mixing ratios (see table 1: “Downtown & Arterial Roads). Conversely,the grid cells covering residential streets and forested trails of Stanley Park in general exhibited the lowest CO2mixing ratios for the same summary statistics (see table 1: “Stanley Park (forested) & Residential”). Over 85% of thecells had a positive skewness, implying that, in general, there are intra-grid CO2 spikes occurring regularly across thecity regardless of land use type and density.Land UseStanley Park(forested)& ResidentialDowntown &ArterialRoadsMean(ppm)475 – 513Median(ppm)462– 505Minimum(ppm)390 - 401Maximum(ppm)713 – 906394 – 412394– 407422 - 427395 - 440Table 1: Summary statistics for land uses exhibiting similar CO2 mixing ratios for the observed time period. The tablesummarizes the mean, median, minimum, and maximum range of values for the forested trails of Stanley Park andthe residential roads and laneways and the dense urban downtown core and arterial roads.
ththICUC9 - 9 International Conference on Urban Climate jointly with 12 Symposium on the Urban EnvironmentFigure 6: Median CO2 aggregated to a 100 m x 100 m grid. Images show general land cover for the given areas.Stanley Park is forested, The Downtown core is high density urban, Mt. Pleasant is mixed commercial/residential,and Vancouver-Sunset and Riley Park/Kensington-Cedar Cottage are mostly residential with some commercial areasalong the major arterial roads. The images shown were taken by a camera attached to the vehicle dashboard andbike helmet during the sensor deployment.Vancouver’s vehicle count data (Vancouver Open Data Catalogue) for the duration of the measurement period isused to quantify the relationship between the vehicle traffic and measured CO2 mixing ratios, using known vehicleemission factors as a method of correlating vehicle count to the observed measurements.
ththICUC9 - 9 International Conference on Urban Climate jointly with 12 Symposium on the Urban EnvironmentFigure 7: Visual comparison of (a) Vancouver’s traffic count data and (b) measured CO2 mixing ratios aggregated to100m x 100m grid cells shows generally good agreement.Visualization ToolsThe measured data is processed and then visualized in an interactive web-based mapping application. The tool, builton open source web technologies, allows users to explore various spatio-temporal dimensions of the data in the webbrowser, including filtering by space and time, calculating basic grid statistics (e.g. minimum, maximum, range,average, etc.) and comparing additional contextual layers such as traffic counts and population density. The webapplication also allows for further investigation with its open data application programming interface (API) whichallows users to download the data or interface with the data in other applications. The tool is aimed to help increaseaccess of urban climate research for research purposes, but also to the informed public, citizen scientists, and urbanplanners and policy makers. With an open code base and API, the technology stack can be reused and remixed tovisualize other types of mobile measurements, such as air pollutants or temperature for urban heat island studies.Summary & Future DirectionsThis project goal was to design and test a mobile sensor system to characterize CO2 mixing ratios across a complexurban environment. The study shows that such a mobile sensing system is capable of measuring at a resolution of /- 1ppm at an accuracy of up to /- 7ppm depending on sensor calibration and drift and resolve variations at a scale2of 100 m at 3.5 km per hour. The result of the measurement campaign indicates that a mobile CO2 system can bea viable method of monitoring canopy layer CO2 mixing ratios in complex urban environments, but considerationsshould be made with respect to sampling density, bias towards roadways, and instrument calibration. Additionalanalysis relating traffic count and building emissions will be conducted to examine possible correlations betweeninventory data and measured near-field CO2 enrichment. Furthermore, long-term seasonal and diurnalmeasurements could be done to examine temporal variability on the observed patterns. By collaborating with existingmobility providers, it may be possible to achieve extensive and intensive measurements across city on pollution andgreenhouse gases in real-time.AcknowledgementsFunding and support by an NSERC Discovery Grant ‘Direct measurement of greenhouse gas exchange in urbanecosystems’ (Christen), NSERC CREATE/Terrestrial Research on Ecosystems and World Wide Education andBroadcast (TerreWEB) and the Canada Foundation for Innovation CFI (Christen) and BCKDF.ReferencesChristen, A., 2014, Atmospheric measurement techniques to quantify greenhouse gas emissions from cities, UrbanClimate, Volume 10, Part 2, Pages 241-260,Marland, G., le Quéré., C., Raupach, M., Canadell, J., 2009, Trends in the sources and sinks of carbon dioxide.,Nature Geoscience., 2(12), 831–836.Snik F., J.H.H. Rietjens, A. Apituley, H. Volten, B. Mijling, A. Di Noia, S. Heikamp, R.C. Heinsbroek, O.P. Hasekamp,J.M. Smit, J. Vonk, D.M. Stam, G. van Harten, J. de Boer, C.U. Keller, 3187 iSPEX citizen scientists, 2014: Mappingatmospheric aerosols with a citizen science network of smartphone spectropolarimeters. Geophys. Res. Lett., 41, 18.
Components from the Arduino platform (Arduino CC, Ivrea, Italy), an opensource programmable microcontroller, were coupled with Li-Cor's Li-820 infrared gas analyzer (IRGA) (Licor Inc., Lincoln, NB, USA) to prototype a portable CO 2 analyzer for possible future CO 2 monitoring, and pollution mapping in general. With low cost compact