Transcription
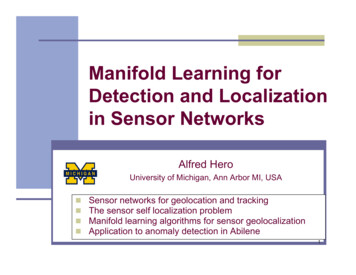
Manifold Learning forDetection and Localizationin Sensor NetworksAlfred HeroUniversity of Michigan, Ann Arbor MI, USA Sensor networks for geolocation and trackingThe sensor self localization problemManifold learning algorithms for sensor geolocalizationApplication to anomaly detection in Abilene1
Wireless Sensor Applications InventoryManagement Logistics EnvironmentalMonitoringUCLA Oct. 17, 2005 2005 Alfred HeroSlide 2
SN Collaborators and Students N. Patwari, UMichD. Blatt, UMichJ. Costa, CalTechC. Kreucher, GD-AISK. Kastella, GD-AISS. Kyperountas, MotorolaN. Correal, MotorolaR. Moses, OSUJ. Ash, OSUR. Nowak, UWiscM. Rabat, UWiscUCLA Oct. 17, 2005 2005 Alfred HeroSlide 3
Main Issues Stress points for this talk: Accurate self-localization essential for SN applications Algorithms robust to unknown channel characteristics Principled approach required for performanceassessment and uncertainty management Distributed numerical optimization algorithms Information theoretic measures of performance Adaptation by active sensing and manifold learning Non-stress points for this talk Communications issues MAC Multi-user interference Multi-hop network routing Mathematical details of algorithms and bounds (refs)UCLA Oct. 17, 2005 2005 Alfred HeroSlide 4
Sensor Network Source Localization Network Geometry Loglikelihood surfaceEnvironmental monitoring: common statistics measuredSource location: information captured by range measurements UCLA Oct. 17, 2005 . 2005 Alfred HeroBlatt&Hero:TSP05Slide 5
Network Source Localization: G and IG recursionsRef: Rabat&Nowak:ICASSP04UCLA Oct. 17, 2005 2005 Alfred HeroSlide 6
Acceleration: POCS Network Geometry Each likelihood component is annular Gaussianwith ridge along circular feasible region UCLA Oct. 17, 2005 . Loglikelihood surface 2005 Alfred HeroBlatt&Hero:TSP05Slide 7
POCS Method (Blatt&Hero:TSP2005)Ref: Blatt&Hero:TSP05UCLA Oct. 17, 2005 2005 Alfred HeroSlide 8
Acceleration: Incremental Aggregated Gradient (IAG) Standard POCS/IG require vanishing step size for convergence: thisleads to slow convergence, e.g. for IG: Simple solution: Incremental Aggregated Gradient (IAG)(Blatt&Hero&Gauchman:SIOPT05) Properties Faster convergence for large class of Lipshitz functionsNetwork-implementable with distributed updates, like IG, POCSApplicable to many different problems Distributed source localization in sensor networks – SIOPT05Distributed boosting of weak classifiers (Logitboost) – SIOPT05Accelerated iterative image reconstruction algos for CT - TMI05UCLA Oct. 17, 2005 2005 Alfred HeroSlide 9
Example: source localizationUCLA Oct. 17, 2005 2005 Alfred HeroSlide 10
Source Tracking with Sensor Swarms Available: large number (100’s or 1000’s)of (cheap, low performance) sensors Model problem: An unknown number of moving groundtargets Sensors are to determine the number oftargets and states of each (position andvelocity) through repeated interrogation ofthe ground Sensors “hover” at a fixed height and staredirectly down Sensorsinsensor planeSensor detects targets w/ probability PdThe sensor (falsely) detects targets inempty regions with probability PfThe sensor management problem in thissetting is to recursively determine the bestmotion for each sensor (so as to changethe ground patch it views)Targetsintarget planeMain ingredients of solution: Bayesian with particle filteringInformation theoretic path planningMust tradeoff tracking existing targets formaintaining adequate coverage to detectnew targets.UCLA Oct. 17, 2005Kreucher&Kastella&Hero:SPIE05 2005 Alfred HeroSlide 11
Information Gain Criterion “Information state” determines variance of predicted reward IG policy: choose actions that improve information statek 1k 2k 3k 4 Information gain captures concentration of info stateUCLA Oct. 17, 2005 2005 Alfred HeroSlide 12
Molecular Fluid Path Planning ModelObjectivesAccurately detect and track targetsMaintain coverage of surveillance areaFocus resources on target locations––Non-linear fluid dynamics approach:Sensors exert attractive and repulsive forceson each other following a molecular BMmodel–01.pueRonislmfroyrbanesorsnseiAttraction to distant sensors–Atto i tractinfo verm forcatio esn g dueradientCandidate target locations extert attractiveforces in proportion to gradient of IGUCLA Oct. 17, 2005 2005 Alfred HeroSlide 13
LJ IG Fluid Dynamical Model Total attractive force on i-th sensor at time t The acceleration of a unit mass object obeys the Langevin equation Can integrate this to determine the sensor position versus time – howeverin general no closed form solution exists Discretization via Verlet BM algorithm yields an update to the position andvelocity of sensor i given byKreucher&Kastella&Hero:SPIE05UCLA Oct. 17, 2005 2005 Alfred HeroSlide 14
SimulationAt initialization, theinformation surface isuniform (lots of uncertainty)and so sensor behavior isdictated by the LennardJones forces : The sensorsspread out uniformlythrough the regionAfter some time, targets aredetected and sensors tend toclump over target locations;however, the Lennard-Jonesforce ensures sensors stillcover the region to addressthe possibility of new targetarrivalUCLA Oct. 17, 2005 2005 Alfred HeroSlide 15
DemoUCLA Oct. 17, 2005Kreucher&Kastella&Hero:Birkhauser05 2005 Alfred HeroSlide 16
Monte Carlo Results This plot shows the performance of the Info-based AP method (compared to apurely AP method) at detecting and tracking 10 targets Two ways of comparing : The number of true targets successfully detected andthe filter estimate of target number Coupling to information surface results in factor of 5 to 10 improvement in numberof sensors required to meet a performance criteriaKreucher&Kastella&Hero:Birkhauser05UCLA Oct. 17, 2005 2005 Alfred HeroSlide 17
On the Choice of β, the Mixing Parameterβ .01β .02β .04UCLA Oct. 17, 2005β .08 2005 Alfred HeroSlide 18
Sensor self-localization problem MeasurementS4S1Active (telemetry) Passive (correlation) S3S2S8S5S6 CommunicationWired or Wireless Limited UCLA Oct. 17, 2005S7 2005 Alfred HeroS9Slide 19
GPS / LPS Won’t Fill Needs LPS: Local Positioning Systems Triangulation / Trilateration9C1DatalinkcentralcomputerBAWireless SensorsKnown LocationUnknown Location67583 Cons: Sensorsneed long-range TX421UCLA Oct. 17, 2005 2005 Alfred HeroSlide 20
Cooperative Localization Additionally, use measurements madebetween pairs of unknown-location devices9C1BAcentralcomputerWireless SensorsKnown LocationUnknown Location6Datalink7583421UCLA Oct. 17, 2005 2005 Alfred HeroSlide 21
What Pair-wise Measurements? Time-of-Arrival (TOA) Received Signal Strength (RSS) Connectivity (Proximity) Quantized RSS (QRSS) Angle-of-Arrival (AOA) Media: RF / Light / AcousticUCLA Oct. 17, 2005 2005 Alfred HeroSlide 22
TOA and RSS Localization ExperimentsCredit to collaborators at Motorola Labs,Plantation, FL: Matt Perkins, Neiyer Correal,Yanwei WangUCLA Oct. 17, 2005 2005 Alfred HeroSlide 23
Measurement Exp II: EnvironmentNode locationsmeasuredCubiclePartitions Typical (Dilbert) office environment13 by 15 m area, and 44 devices (0.2 / m2)Multipoint-to-multipoint: 44 x 43 x 5 9460 measurementsData set available online:http://www.eecs.umich.edu/ hero/localizeUCLA Oct. 17, 2005 2005 Alfred HeroSlide 24
Measurement Exp II: EquipmentSigtek 515 TransmitterPT 10 mW RC 40 MHz10 MHz IN Ext Trigger10 MHz OUT 1 PPS OUTDatum ExacTimeGPS & Rubidium Osc. Wideband Measurement System DS-SS Tx and Rx, fC 2443 MHz Sleeve Dipole Antennas, Height 1 m Power Delay Profiles (PDP) TOA estimated (template-matching) RSS estimated (sum multipath powers)Sigtek 515 Receiver Averaging Time Reciprocal ChannelRS 120 MHz10 MHz IN Ext Trigger10 MHz OUT 1 PPS OUTDatum ExacTimeGPS & Rubidium Osc.Block Diagram ofMeasurement SystemUCLA Oct. 17, 2005SigTek Receiver 2005 Alfred HeroSlide 25
Model for Received Signal StrengthFigure 2.8: Measured Path Gainvs Path Length.XMeasured Power,with np 2.30 Log-log RSS residual,, isapproximately Gaussian with σdB 3.9 dBUCLA Oct. 17, 2005 2005 Alfred HeroSlide 26
Model for Time-of-Arrival Positive bias due to multipath Resulting TOA statistic is Gaussian withpositive mean: Measurements: µ 10.9 ns, σT 6.1 nsGood model for short path lengthsUCLA Oct. 17, 2005 2005 Alfred HeroSlide 27
Distributions of Measured DataRSS errors (dBm) Quantile-Quantile: compare distributions to GaussianTOA errors (ns)(a)2010 Both TOA andRSS (in dB)are comparedto Normal CDF Measured datashows heaviertails mixturemodels?0 10 20 4 2024402510 5 20 4(b)UCLA Oct. 17, 2005 202Theoretical Normal N(0,1) Quantile 2005 Alfred Hero4Slide 28
Connectivity isn’t Deterministic Devices which can communicate are connected:Connectivity is not solely determined by geometry!Architectural blueprint“in-range” of“out-of-range” ofDistance at whichP(“in-range”) 1/2UCLA Oct. 17, 2005 2005 Alfred HeroSlide 29
Model for Connectivity: QRSS Approximation: RSS Threshold Power: Devices ‘in-range’ RSS Threshold Power: Devices ‘out-of-range’ Connectivity is a binary quantization of RSS Arbitrary K-level Quantized RSS (QRSS) is possible In reality, RSS must be sampled Automatic Gain Control (AGC) changed in steps Considered in [3][3]N. Patwari and A.O. Hero, “Using Proximity and Quantized RSS for Sensor Localization in WirelessNetworks”, 2nd ACM Wireless Sensor Nets. and Apps. (WSNA), San Diego, CA, Sept. 19, 2003.UCLA Oct. 17, 2005 2005 Alfred HeroSlide 30
Benchmarking achievable performance Design QuestionsWhat measurement method should be used? What is a good density / placement strategyfor known-location sensors? How do channel parameters / nuisanceparameters impact performance? What configurations of a sensor networkprovide acceptable performance? To answer these questions in an algorithm-independent manner a benchmark is requiredUCLA Oct. 17, 2005 2005 Alfred HeroSlide 31
Design tool: Information Theory Average curvature (FIM) of log-likelihood gives lowerbound on variance of any unbiased estimator Results for TOA/AOA, RSS, QRSS, connectivity [4,5] Rate distortion theory for quantized measurements[4]R. L. Moses, D. Krishnamurthy, R. Patterson, “An auto-calibration method for unattendedground sensors,” ICASSP, May 2002.[5]N. Patwari, A.O. Hero, M. Perkins, N. S. Correal, R. J. O'Dea, “Relative Location Estimation inWireless Sensor Networks”, IEEE Transactions on Signal Processing, vol. 51, no. 8, Aug. 2003.R. Gupta, A.O. Hero, “High rate vector quantization for detection”, IEEE Transactions onInformation Theory, vol. 49, No. 8, pp. 1951-1969, Aug. 2003.[6]UCLA Oct. 17, 2005 2005 Alfred HeroSlide 32
Key Intuition Obtained From CRB As we scale the diameter of networkTOA bounds remain constant AOA, RSS bounds increase proportionally Proportionality to channel parametersTOA variance prop. to AOA variance prop. to RSS, QRSS, Connectivity prop. to Effect of RSS Quantization Connectivity best case:UCLA Oct. 17, 2005 2005 Alfred HeroSlide 33
CRB GUI Localization CRB when measuring RSS, QRSS,Connectivity CRB code available online(all modes) GUI: Collaboration with J.Ash at OSU [7]Figure 3.2: GUI for calculation ofcooperative localization CRB andsimulation of maximum likelihoodestimator (MLE) performance Measurement data available on our website[7]N. Patwari, J. Ash, S. Kyperountas, A. O. Hero, R. M. Moses, N. S. Correal, “Locating the Nodes”,IEEE Signal Processing, July 2005.UCLA Oct. 17, 2005 2005 Alfred HeroSlide 34
Model Free Approach: Manifold Learning Extract low-dim structure from high-dim data Data may lie on curved (but locally linear)subspace[8]J.B. Tenenbaum, V. de Silva, J.C. Langford “A Global Geometric Framework for NonlinearDimensionality Reduction” Science, 22 Dec 2000.[9] Sam T. Roweis and Lawrence K. Saul, “Nonlinear dimensionality reduction by local linearembedding,” Science, Dec 2000.[10] David L. Donoho and Carrie Grimes, “Hessian eigenmaps: New locally linear embeddingtechniques for highdimensional data,” Tech. Rep. TR2003-08, Dept. of Statistics, StanfordUniversity, March 2003.UCLA Oct. 17, 2005 2005 Alfred HeroSlide 35
Simple version: MDS/PCA for TOA Key property for geolocation of planar sensor networks Matrixsensor locations Pairwise measurements (TOA, RSS, QRSS) are related to physicalgeometryIn the case of TOA this relation is linear and MDS is applicableIn other cases, the relation is non-linear or not known precisely UCLA Oct. 17, 2005of pairwise distances is linearly related to 2005 Alfred HeroSlide 36
Manifold Learning: Preserve Neighbors Preserve local structure (nearest neighbors) Isomap: Preserve shortest path distances in nearestneighbor graphDistributed weighted multi-dimensional scaling (dwMDS):Preserve weighted distances (weight 0 for non-neighbors)Laplacian eigenmaps (LE): Preserve similarity, i.e., inversedistance, which is zero for non-neighbors. UCLA Oct. 17, 2005Locally Linear Embedding (LLE), Hessian-based LLE 2005 Alfred HeroSlide 37
Two Perspectives on one Solution Equivalent Problems:Find coordinates for sensor’s data Find location of sensor CameraLowFigure 4.6: The intrinsic geometric structure(represented using Isomap K 6) ofa sequence of 64x64 pixel imagesof a face rendered with differentposes and lighting directions.High[8]RightUCLA Oct. 17, 2005CameraJ.B. Tenenbaum, V. de Silva, J.C.Langford “A Global GeometricFramework for NonlinearDimensionality Reduction” Science,22 Dec 2000.Left 2005 Alfred HeroSlide 38
Compare Manifold Learning AlgorithmsDistance orSimilarity?MDS-MAP [11]or IsomapdwMDS [12]LaplacianEigenmap erative, e to largerange errorsCan incorporateprior infoNatural forconnectivityCost toMinimizeAlgorithmBasisNotes[11] Y. Shang, W. Ruml, Y. Zhang, M.P.J. Fromherz, “Localization from mere connectivity,” in Mobihoc’03, June 2003, pp. 201–212.[12] J. Costa, N. Patwari, A.O. Hero III “Distributed Weighted Multidimensional Scaling for NodeLocalization in Sensor Networks”, IEEE/ACM Trans. Sensor Networks, to appear Dec. 2005.[13] N. Patwari, A.O. Hero III “Adaptive neighborhoods for manifold learning-based sensor localization”,IEEE SPAWC 2005, June 2005.UCLA Oct. 17, 2005 2005 Alfred HeroSlide 39
Example: 7 by 7 Grid of Devicesy 4 known-location devices 45 unknown-locationKnown-loc DeviceUnknown-loc Deviceddevices Run 100 trials perestimator to find meanand covariance Compare estimatorcovariance to CRBd 1mFigure: Actual device locations in the 7 by 7grid exampleUCLA Oct. 17, 2005 2005 Alfred HeroSlide 40
Iterative self-localization algorithmUCLA Oct. 17, 2005 2005 Alfred HeroSlide 41
Simulation of dwMDS: RSSUCLA Oct. 17, 2005 2005 Alfred HeroSlide 42
Simulation of Isomap: Connectivity Measure Connectivity Use Isomap / MDS-MAP [11]1MDS-Map with R 0.50.750.5Key:0.251-σ uncertainty ellipsesCRBEstimator0Actual LocationEstimator MeanReference Device00.250.50.751[11]Y. Shang, W. Ruml, Y. Zhang, M.P.J. Fromherz, “Localization from mereconnectivity,” in Mobihoc ’03, June 2003, pp. 201–212.UCLA Oct. 17, 2005 2005 Alfred HeroSlide 43
Comparison to LE: Connectivity[13] N. Patwari, A.O. Hero, “Adaptive Neighborhoodsfor Manifold Learning-based Sensor 2005 Alfred HeroUCLA Oct. 17, 2005Slide 44Localization,” IEEE Signal Processing & Wireless Commun. Conf. (SPAWC), June 2005.
Application: Adaptive Internet Anomaly Detection Spatio-temporal measurement TLAdayHSTNtemperatureSNVAtemperatureSTTLdayUCLA Oct. 17, 2005 2005 Alfred HeroSlide 45
Internet anomaly detection Anomalies: Worm outbreaks, DoS attacks,Intrusion activity (scans) Monitor: Collect set from sensors (routers) inspace and time Hypothesis: Anomalies will changedistribution of traffic across sensors ‘Distribution’: traffic by src/dst port, IP addresses;packet sizes, etc. Problem: How do you find ‘anomalous’relationships across space?[14] N. Patwari, A. O. Hero, A. Pacholski, “Manifold Learning Visualization of NetworkTraffic Data”, ACM Wksp on Mining Net. Data (MineNet’05), Aug 2005.UCLA Oct. 17, 2005 2005 Alfred HeroSlide 46
Router Map: High-Dim. Traffic Vectors Sensors at routers measure # flows per source IP address 07-Jan-2005 during 15:45-15:50 UTDPackets are sampled 1/100Last 11 bits zeroed for privacy - data are 221–length (sparse) vectors NYCM measures:SRC 158.42.128.0UCLA Oct. 17, 2005Flows1992545873713264920311817168315601513 WASH measures: ATLA measures:SRC 128.112.136.02009099656772276627001578152315091428 2005 Alfred HeroSRC 29.48.0Flows159712101076897888728716714705Slide 47
Data Vector Localization Algorithm Place Routers on a map so that Euclideandistancesbetween vectors is preservedTraffic histograms (normalized so sum 1) Example from previous slide ATLA0.138UCLA Oct. 17, 2005NYCM0.0640.132WASH 2005 Alfred HeroSlide 48
Results: Sensor Map Example Typical router map, 18-Jan 17:00 UTD Sensors (routers) aspositioned bydwMDS Coordinates arenormalized (flows)so are unitless Lines show physicalAbilene links Small dots (- - -)show distance from4-week mean coordUCLA Oct. 17, 2005 2005 Alfred HeroSlide 49
Maps Respond to Anomalous Traffic19 Jan 05 at 00:4500:50 Wed. 19-Jan 2005,3STTL2Y Coordinate0:00-1:00 UTD At 0:30, 0:35: largenetwork scan 22,000 anomalousflows observed atSTTL, DNVR,KSCY, IPLS, ATLA 60-byte, TCP From a few Miss.State U. IPs, SrcPort 1024 To range ofMicrosoft IPs, DestPort RSNVAKSCYKSCYNYCMKSCYKSCYKSCY SNVASNVASNVAIPLSSNVADNVRKSCYLOSA HSTN ATLAATLAATLALOSALOSA HSTNLOSAATLALOSAHSTNHSTNLOSALOSA HSTNHSTNHSTNATLA10 1 2ATLA 3 3UCLA Oct. 17, 2005 2 2005 Alfred Hero 101X Coordinate23Slide 50
Pure Time Series: Small Change Abilene7NetworkScan65Total FlowsBackboneTotal Flows,by router 18-19 Jan5x 10432100UCLA Oct. 17, 200561218243036Hours after 0:00 UTD 18 Jan 2005 Alfred Hero4248Slide 51
Automatic Detection Algorithm Multivariate t-test comparing the current coords to ahistory ofNetworkcoordinates20Scan3 Declare2: 45kflow port scanfrom .tw to .dk3: 46kflow port scanfrom .tw to .plUCLA Oct. 17, 200516214t valuealarm when tvalueexceedsthreshold Eg: 18-19Jan-05181210864061218243036Hours after 0:00 UTD 18 Jan 2005 Alfred Hero42Slide 5248
Conclusions Approach grounded in optimization andinformation theory Parametric model gives useful performancebounds Algorithms too strongly coupled to models arebrittle. Need for model-free algorithms that arecapable of learning the important statistics Future work:Decentralized decisionmaking Communication bandwidth constraints Joint target tracking and self-localization UCLA Oct. 17, 2005 2005 Alfred HeroSlide 53
Publications (available onhttp://www.eecs.umich.edu/ hero) Journal articles D. Blatt and A. O. Hero, "Energy based sensor network source localization viaprojection onto convex sets (POCS)", (submitted) IEEE Trans. on Signalprocessing, Feb. 2005. D. Blatt, A. O. Hero and H. Gauchman, "A convergent incremental gradientalgorithm with a constant stepsize", (submitted) SIAM Journal on Optimization,Sept. 2004.J. A. Costa, N. Patwari, A. O. Hero, “Distributed Weighted Multidimensional Scalingfor Node Localization in Sensor Networks”, (to appear) ACM/IEEE Journal onSensor Networks.N. Patwari, J. Ash, S. Kyperountas, A. O. Hero, R. M. Moses, N. S. Correal,“Locating the Nodes” IEEE Signal Processing, July 2005.N. Patwari, A. O. Hero, M. Perkins, N. S. Correal, R. J. O'Dea, “Relative LocationEstimation in Wireless Sensor Networks”, IEEE Trans. Signal Processing, Aug.2003. ACM conference papers N. Patwari, A. O. Hero, A. Pacholski, “Manifold Learning Visualization of NetworkTraffic Data”, ACM Wksp on Mining Net. Data (MineNet’05), Aug 2005.N. Patwari, A. O. Hero, “Using Proximity and Quantized RSS for SensorLocalization in Wireless Networks”, ACM Wksp. on Wireless Sensor Nets. andAppl. (WSNA’03), Sept. 2003.UCLA Oct. 17, 2005 2005 Alfred HeroSlide 54
Publications IEEE conference papers D. Blatt and A.O. Hero, "APOCS: a convergent source localization algorithm forsensor networks," IEEE Workshop on Statistical Signal Processing (SSP),Bordeaux, July 2005.C. Kreucher, K. Kastella, and A. Hero. Multiplatform Information-based SensorManagement. The Proceedings of the SPIE Defense Transformation and NetworkCentric Systems Symposium, volume 5820, pages 141-151, March 28 - April 12005N. Patwari, A. O. Hero, “Adaptive Neighborhoods for Manifold Learning-basedSensor Localization,” IEEE Signal Processing & Wireless Commun. Conf.(SPAWC), June 2005.J. A. Costa, N. Patwari, A. O. Hero, “Achieving High-Accuracy DistributedLocalization in Sensor Networks”, IEEE Int. Conf. on Acoustics, Speech, & SignalProcessing (ICASSP), March, 2005. (Student Paper Contest Finalist)N. Patwari, A. O. Hero, “Manifold Learning Algorithms for Localization in WirelessSensor Networks”, IEEE Int. Conf. on Acoustics, Speech, & Signal Processing(ICASSP), May 2004.N. Patwari, A. O. Hero, B. Sadler, “Hierarchical Censoring Sensors for ChangeDetection”, IEEE Wksp on Statistical Signal Processing (SSP), Sept. 2003.N. Patwari, A. O. Hero, “Hierarchical Censoring for Distributed Detection inWireless Sensor Networks”, IEEE Int. Conf. on Acoustics, Speech, & SignalProcessing (ICASSP), April 2003.N. Patwari, A. O. Hero, “Location Estimation Accuracy in Wireless SensorNetworks”, 2002 IEEE Asilomar Conf. on Signals & Systems, Nov. 2002.N. Patwari, Y. Wang, R. J. O'Dea, “The Importance of the Multipoint-to-MultipointIndoor Radio Channel in Ad Hoc Networks”, IEEE Wireless Commun. & Netw.Conf. (WCNC), March 2002.UCLA Oct. 17, 2005 2005 Alfred HeroSlide 55
1 Manifold Learning for Detection and Localization in Sensor Networks Sensor networks for geolocation and tracking The sensor self localization problem Manifold learning algorithms for sensor geolocalization Application to anomaly detection in Abilene Alfred Hero University of Michigan, Ann Arbor MI, USA