Transcription
MAPAN-Journalof Metrology Society of GINAL PAPERSODAR Based Meteorological Sensor Network for Air PollutionMonitoring in Northern IndiaP. Chourey1,2, N. J. Singh1, K. Soni2*and R. Agarwal11Thapar Institute of Engineering and Technology, Patiala, India2CSIR-National Physical Laboratory, New Delhi, IndiaReceived: 19 August 2021 / Accepted: 27 April 2022Ó Metrology Society of India 2022Abstract: The atmospheric boundary layer (ABL) plays a significant role in defining the air-quality index of an environment. It determines the environmental capacity for the diffusion of atmospheric pollutants. The air-quality in adesignated area is influenced by the local air pollution as well as the transported pollutants from remote locations.Estimation of mixing-height helps to determine the volume space in which the emitted pollutants are dispersed. Thecontinuous and effective monitoring of mixing-height in real-time is a major concern for the research community. SonicDetection and Ranging (sodar) is crucial for real-time and continuous determination of mixing-height. This paper proposesa novel Sodar-based meteorological sensor network (SMSN) with the Internet of Things (IoT) capability. In the SMSN, thetemperature, relative humidity, and wind sensors are integrated with sodar and deployed to seven locations in NorthernIndia. The sensors with IoT work as sensor nodes and provide accessibility to users for air-quality monitoring in real-time.The IoT-enabled SMSN displayed impressive standard uncertainty for data packet losses across all the sites and parameters. Additionally, correlation analysis is performed between the SMSN parameters and key air-pollutants of each sensornode. The correlation analysis shows good relevance between the regional parameters and Delhi’s parameters. Theintegration of IoT with sodar and meteorological parameters is important for improving the overall decision-making andplanning of Delhi’s air quality.Keywords: Amazon web services (AWS); Internet of Things; Meteorological-sensors network; Mixing-height;Atmospheric boundary layer; Sensor node; SODAR1. IntroductionThe atmospheric boundary layer (ABL) is the lowest partof the atmosphere ranging from 100 to 2000 m above theground’s surface. The ABL-height estimation determinesthe environmental capacity to disperse the atmosphericpollutants. The behavior and properties of atmosphericpollutants are directly influenced by the topography of theearth’s surface. It significantly carries a higher amount ofair pollutants than the rest of the atmosphere. The evolutionof the ABL structure has significant impacts on the diffusion, transmission, and disappearance of pollutants in thelower atmosphere [1]. The diurnal variation in temperatureand humidity affects dispersion and diffusion in theatmosphere. The earth’s surface cools faster than theatmosphere due to emitting long-wave radiation at night;therefore, the temperature increases with height. The nocturnal stable boundary layer is the technical term for thistemperature inversion, which lowers the surface-to-atmosphere turbulence. Temperature stratification discontinuities between the upper and lower layers of the atmospherecause discontinuous turbulence, which results in the formation of a mixing layer. The atmospheric mixing layer isa significant meteorological parameter. The criticaladvantage of studying the height of the mixing-layer, alsoreferred to as mixing-height is its capability to present thetransition time characteristics of the day. It defines thecharacteristics of the large pollutants variability along withambient temperature and humidity values between thewell-mixed boundary layer and the stable free troposphere[2]. It affects the vertical diffusion of environmental pollutants and water vapor concentrations. It impacts theformation and dissipation of air pollutants [3]. The real-*Corresponding author, E-mail: 2006.kirti@gmail.com123
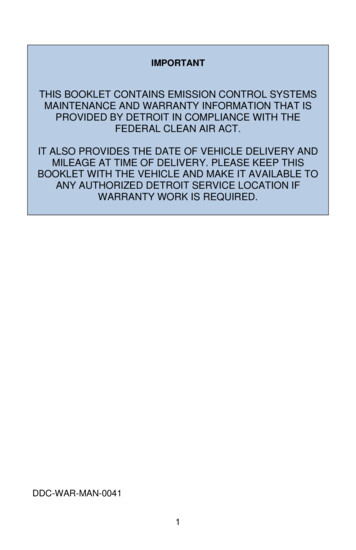
P. Chourey et al.time observation of mixing-height is beneficial forimproving the parameterizations and optimizing the airpollution models.The primary methods for the estimation of mixingheight are meteorological radiosondes, airplane surveys,and ground-based remote sensing techniques. The radiosonde is the most convenient method to determine qualitymixing-height data. However, the discrete nature ofobservations at a higher cost makes radiosonde unable toprovide sufficient temporal resolution of the evolution ofmixing-height in real-time. Therefore the radiosondetechnique is less preferable for air pollution monitoring [2].As an alternative, airplane surveys are excellent at providing high-resolution mixing-height data and accurateweather and pollutant profiles. The significant constraintswith airplane surveys are air-traffic control, weather conditions, and observation costs. These constraints limit airplane surveys for shorter periods only [4]. Therefore, theground-based remote sensing technique is the mostadvanced and reliable method to acquire continuousobservations with a high spatial and temporal resolution ofmixing-height.Acoustic sounder (sodar), light detection and ranging(lidar), and radio detection and ranging (radar) devices arethe three popular ground-based remote sensing methods toestimate mixing-height [2]. Doppler wind radar obtainsvariations of the wind vectors at different altitudes. Itidentifies the mixing-height through wind shear data. Thelimitation with the wind radar is its lower limit of heightdetection, which is usually above 200 m, and the verticalresolution is limited to 50 250 m. This limitation makesthe interpretation of wind radar data less faithful.Similarly, the lidar obtains the vertical profile of theaerosol concentration and discerns the atmospheric mixingheight by calculating the height at which sudden changes inthe profile occur. The high cost of lidar technology makesit less preferable. The sodar has the best refractive indexfor the backscattered signals and more sensitivity towardsthe atmospheric echoes. Sodar is a very economicallyviable option as well. It makes sodar a more suitable andpreferred choice for the continuous measurement of mixing-height [5].The continuous measurement of mixing-height data andsome meteorological parameters is one of the criticalchallenges for the regulatory authorities in the regionallevel monitoring of air pollution. The air pollutants’transportation and dispersion take place on a wide range ofgeographical scales. International organizations deal withglobal issues such as climate change, stratospheric ozonedepletion, and inter-continent transport. Similarly, a nationis responsible for planning and controlling all the stakeholders and regulatory authorities with a regional vision[6]. In India, the Central Pollution Control Board (CPCB)123provides the ambient air quality information through theNational Air Quality Monitoring Programme (NAMP)[7, 8]. The NAMP determines the violated air qualitystandards of all Indian cities and takes corrective measures.The local pollution is observed by estimating the differentpollutants, such as Carbon Monoxide ðCOÞ, SulphurDioxide ðSO2 Þ, Nitrogen Dioxide ðNO2 Þ, Ozone ðO2 Þ,Ammonia ðNH3 Þ, and Particulate Matter 2:5 ðPM2:5Þ [9].However, effective air pollution monitoring is onlyachievable when the measurement is not limited to thelocal pollutants.Northern India, especially Delhi, is the epicenter of airpollution and is listed among the top polluted cities in theworld. The literature study gives an insight into themegacities like Delhi that the air pollution in big citiesprimarily relies on the transported aerosols from the surrounding atmosphere [10]. The literature study also statesthat the local and transported pollutants are equallyresponsible for the poor air quality in Delhi [11]. Especially agriculture residue burning is one of the significantsources of black carbon, aerosol, trace gases, and otherpollutants in Delhi. Therefore, it is essential to measure thedispersion and diffusion process of the whole region for airpollution monitoring in the city. Several meteorologicalparameters impact the air pollution dispersion process. Themixing-height, wind profile, ambient temperature, andrelative humidity are significant parameters for monitoringthe dispersion [12]. A single platform network solution formonitoring all the critical parameters is crucial to improvedecision-making in real-time.In the last decade, the Internet of Things (IoT) describesthe capacity of the Internet to touch people’s everyday livesthrough a wireless network of uniquely identifiable objects[13]. The IoT technique improves the decision-making ofthe controlling authorities to predict and promote the entireprocess and planning of air pollution monitoring for sustainable growth [14]. This paper focuses on the IoTapplication in the new generation of air pollution informatics by integrating meteorological parameters such asmixing-height, wind profile, ambient temperature, andrelative humidity with local air pollutants and provides anew paradigm for environmental monitoring and management in the future. The basic block diagram of the integrated sodar and meteorological sensor system is shown inFig. 1.2. Related WorkThe COVID-19 outbreak and nationwide lockdown acrossthe world slowed down the speed of air pollution, whichgave some time to regulatory authorities, the scientificcommunity, and the public to re-examine the environment
SODAR Based Meteorological Sensor Network for Air Pollution Monitoring in Northern IndiaFig. 1 Block diagram of sodar and meteorological sensor networkmonitoring approach [15]. Integration of air pollutionmonitoring and management methods based on IoT is animperative and active topic for all stakeholders. IoT-basedmonitoring network covers various issues and involvesmultiple computer and information science technologies[16].2.1. Air Pollution Monitoring SystemsThe key contributing factors to atmospheric pollutioncomprises burning fossil fuels, mining processes, industrialactivities, transportation systems, and agricultural activities. The air quality of an atmosphere is decided by themeasurement of NOx; SO2 ; O3 ; CO; and particulate mattersðPM2:5 & PM10Þ [17, 18]. The significant environmentalparameters affecting atmospheric pollutants are temperature, humidity, altitude, wind speed, and pressure [19].Therefore, an effective monitoring system to combat allthese factors is necessary for accurate measurement. Sinceenvironmental pollution is dependent on the atmosphericdispersion and diffusion process and its distribution is notuniform, the source of location and its vigilant selectionbecomes critical for measurement [20]. In order to cover alldimensions of a defined area, multiple sensors and multiplesensing nodes with advanced networking techniques arerequired [21, 22].The conventional monitoring stations consist of local airpollutants measuring sensors to observe the contaminatedair. These stations are very consistent, precise, and capableof counting a widespread group of impurities throughanalytical instruments, like gas chromatograph-massspectrometers [23]. Although the established monitoringsystems use different approaches, the overall goal andgeneral architecture of these systems are similar and continuous monitoring of transported pollutants is still missingfrom the system [24]. The fundamental process of airmonitoring systems comprises three main processes, i.e.,sensing, analyzing, and decision-making [25]. The latersection discusses the significant advancements in the conventional air pollution monitoring systems’ hardware,software, and communication protocols.There is vast literature on the hardware and softwaretools for air pollution monitoring systems. The Arduinoboard has been widely used as a sensor node for thisapplication. Lobur et al. used the Atmel 8-bit AVRmicrocontroller to measure essential pollutants such as CO,PM 2.5, CO2, temperature, and humidity in real-time [26].Dhingra et al. [27] proposed the gas sensor kit along withArduino and Wi-Fi module to monitor the air pollution onthe IoT networks. In this, the Arduino module fetches thesensor data and transmits it to the cloud via a Wi-Fimodule.Similarly, Guanochanga et al. [28] and Malhotra et al.[29] also utilized the Arduino as data acquisition andtransmission controller. While Guanochanga et al. [28] andKiruthika [30] added the Raspberry Pi with an air monitoring system as an IoT Gateway for data communicationto the cloud. Singh et al. deployed the Raspberry pi 3 andArduino UNO as sensing nodes. They used the ThingSpeakIoT application for real-time data monitoring of the sensornetwork. Generally, Arduino, GSM module, Raspberry Pi,and other micro-controller boards have been utilized as anIoT gateway.The software and cloud services for user applicationdevelopment and data management include LabVIEW,MATLAB, Android, Structured Query Language (SQL),123
P. Chourey et al.DBMS (database-management), AWS (Amazon web services), ThingSpeak, etcetera. The communication protocolis critical for the sensor network [31]. Generally, two different communication protocols are required in any sensornetwork, first, for the local networking between the sensorsdone by a wireless sensor network and second for the datacommunication between sensor nodes to monitoring stations done by IoT gateways [32]. The protocols such asZig-Bee and Bluetooth are widely used for short-distancedata communications, whereas Wi-Fi, General PacketRadio Service (GPRS), Long Term Evolution (LTE) Network, GSM (General System Mobile), and radiofrequencycommunication protocols are used for long-distance datacommunication [33]. Additionally, the data communicationover the web is done by the HyperText Transfer Protocol(HTTP) and Message Queue Telemetry Transport (MQTT)protocols [23].Moreover, low measurement accuracy is the mainobstruction to the reliable deployment of the meteorological sensors network. Several researchers found the errorsources after testing and analyzing the sensor and signalsover the years and categorized errors into two main categories internal and external. Internal errors include theworking mechanism of sensors which depend on thedynamic boundaries such as systematic errors, nonlinearresponse, and signal drift [34]. While the significant sources of external errors are environmental circumstances thatdepend on the site selection. The calibration of the sensorsfrom authentic organizations before installation becomesextremely important in order to form a trust-worthy sensornetwork [35, 36].2.2. Application of Acoustic Sounder in Air PollutionThe atmospheric boundary layer is considered a circulatorysystem of the biosphere. It lies in the boundary layer wherephotosynthesis and respiration activity of the plants andanimals takes place. It also helps to remove the wasteproduct and thus to cleanse the atmosphere using photochemical reactions. This layer disperses the heat andmoisture gathered at the earth’s surface horizontally andvertically. This process effectively improves the air-qualityof the biosphere and provides a conduit for the propagationof weather systems on all scales [1]. An acoustic sounder isa proven technology for estimating the ABL structures.This section briefly discusses the application of acousticsounder/sodar in air pollution estimation and modeling[37].In the examining process of mixing-height estimated bysodar during turbulent stable boundary layer, it has beennoted that the sodar measured mixing-height is in the lowerrange than the height required for the air pollution modeling by Koracin and Berkowicz [38]. The main reason for123the sodar measured mixing-height depends on the velocityfluctuations in the nocturnal stable boundary layer forpollutants dispersion. In contrast, the monostatic sodar issensitive to the temperature coefficient only. The magnitude of the temperature fluctuations decreases much fasterwith height than the velocity fluctuations. Nevertheless, thelack of other reliable techniques for continuous mixingheight measurement makes the sodar the best option tomeasure mixing-height for the study of the turbulentstable boundary layer. Likewise, Caughey [39] had alsoreported the importance of qualitative pictorial representation of the turbulent stable boundary layer from theacoustic sounder.The direct determination of the day time mixing-heightis limited to heights within the sodar probing range. Incontrast, the mixing height is higher than the probing rangefor most sites. Singal and his associates [40] studied thestable layer structure of sodar to determine mixing height.On the basis of the Holzworth model [41] using radiosondedata of Delhi, the studies of the convective boundary layerheight have been established. The mixing-height isobtained on a daily basis from radiosonde and comparedwith the corresponding sodar measured depth of the thermal plumes. These comparison results have been used todevelop an empirical relation to determine the mixingheight from the sodar observed thermal plumes height [1],as shown in Eq. (1).y ¼ 4:24x þ 95ð1ÞHere y is the estimated mixing-height as per theHolzworth model, and x is the sodar measured thermalplumes height.Gera and Singal [42] proposed a technique to determinethe dispersion coefficient using the monostatic sodar. Theechogram structures from sodar installed at the sounder atChittorgarh (India) have been used to observe the verticaldispersion when the plume is actually passing over thesounder. Similarly, Coulter and Underwood [43] have alsoobserved the potential application of sodar while takingmeasurements of temperature structure parameters andestimated the relative dispersion coefficients of the coolingtower plume. In this research, the linear relation betweenthe width of the cooling tower plume and the distance fromthe tower is demonstrated. Sodar is able to measure ABLand is used to determine related dispersion parameters andis therefore considered as a high potential technique tonow-cast the hazardous events related to air pollution. Inthe following, the efforts to estimate the pollution concentration at a place under different stability conditionsusing monostatic sodar are discussed.Jensen and Petersen [44] proposed a simple box modelbased on the mixing-height measured by sodar to calculateSO2 concentrations in Gladsaxe, Denmark. Moulsley and
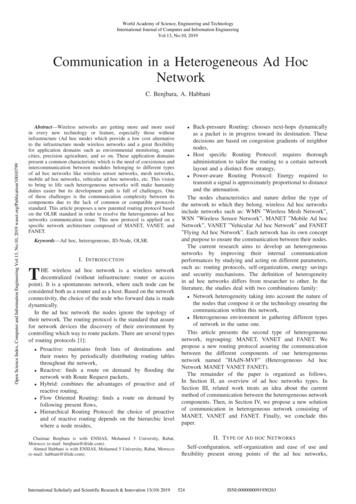
SODAR Based Meteorological Sensor Network for Air Pollution Monitoring in Northern IndiaCole explored the acoustic sounder application to measuremethane plumes in the air and provide information aboutits size, behavior, and concentration structure [45, 46]. Italso helps to measure the wind velocity structure parameters of the methane plume from acoustic scattering measurements. These measurements showed a goodrelationship between the plume dimensions derived fromsounder measurements and predictions of simple diffusiontheory. Brusasca et al. [47] observed the improvement inthe simple Gaussian model by including the remote sensingsystem has the potential to benefit the more complexatmospheric diffusion model. Gera et al. [48] studied theconvective conditions air pollution dispersion model in apower station located area. Using acoustic-sounding datafor a preferred dispersion model is essential for understanding the convection at complex substandard locations.Singal and his associates [37] developed a sodar basedmodel to predict pollution concentration due to emissionsources in the National Physical Laboratory, Delhi, India.They have proposed to adopt the normal Gaussian dispersion model for estimating the downwind pollution concentration. The particulate matter concentration withrespect to distance from the cement factory located atNimbahera (Chittorgarh) in Rajasthan, India, has beencomputed by Singal et al. [1] to observe the dust contribution of the cement factory in that area. The predictionmodel calculated values have been found in a similar rangeto the observed particulate matter values. Additionally, thediurnal variations of the computed particulate matter datacorrelate with the sodar determined mixing-height value.As expected, a high rise in particulate matter is observedduring the fumigation period.The linkage between the concentration of the pollutantsand locally measured mixing-height in Moscow, Russia, isdemonstrated by Pekour and Kallistratova [49]. In thisresearch work, the pollutants variations in time are measured using sodar, and a correlation with the observed airpollutants has been estimated. This positive correlationelucidates the practical use of the sodar determinedparameters such as mixing height and stratification of theatmospheric boundary layer for air pollution meteorology.The acoustic-sounding technique has been extensivelyadvanced since the initial work of McAllister [50] andLittle [51]. It evolved as a valuable tool for remotelyprobing the information of the atmospheric boundary layer.Beside the many qualitative studies of the atmosphericphenomena like inversions, thermal plumes, mixing height,fog, and sea breeze, it provides quantitative information onmany important atmospheric pollutants and their dispersionand diffusion coefficient in the atmosphere.An IoT-based sodar network for air-shed managementand planning was previously established by Chourey [52].Six sodars were placed throughout Northern India andinterconnected via the Internet of Things (IoT) to conductthis study. The integration of sodar with a meteorologicalsensor is also essential in order to analyze and studyenvironmental pollution, which was not included in thepresented research.2.3. Motivation of ResearchIt has been observed from the review of related work thatthere has been significant development of the sodar technology and meteorological sensor network for the air pollution monitoring and management system. However, theadvancement in sodar and integrated meteorological sensornetworks and their applications have some apparentshortcomings. Firstly, multi-sources of data and information are constantly expanding. Multi-sensors data frommultiple locations require effective acquisition and processing. Secondly, practical database management is necessary to tackle a large amount of data from the integratedmeteorological sensor networks in real-time for remotelymonitoring the environmental parameters. Thirdly, theinfluential association and fusion between multi-sensorsand their real-time data acquisition is another importanttopic that has been rarely studied in the existing literature.Lastly, adapting multidimensional and multi-scale applications under different tasks and cloud services is anotherchallenge with the next generation integrated sensor network system [53, 54].Accordingly, the development of integrated, smart, andsustainable network systems for practices in air pollution,environment, and sustainable engineering based on IoT isimperative for the near future. Based on this, a novel IoTbased integrated sensor network consisting of sodar andmeteorological sensors such as wind, temperature, andhumidity is proposed on a single platform for regional airpollution monitoring and management system. The IoTbased single platform solution has been installed andcommissioned in seven different Northern India locationsto improve the decision-making of the air pollution monitoring system for Delhi.3. Proposed SystemIn the last decade, the increasing trend in IoT technologieshas laid the foundation for integrating multiple sensors forair pollution monitoring systems. In this manuscript, anovel single platform solution to create SMSN is proposedfor regional air pollution monitoring based on the framework of IoT. The proposed methodology consists of foursteps: (1) design and development, (2) calibration andtesting, (3) installation and real-time data acquisition, and(4) monitoring, as shown in Fig. 2. A detailed discussion of123
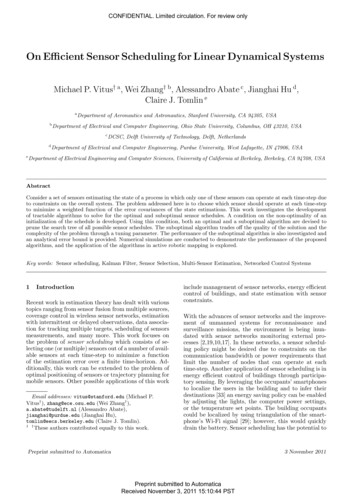
P. Chourey et al.the proposed methodology has been presented in the following subsections.3.1. Design and DevelopmentThe designing and development of digital signal processingsoftware for IoT networking is a critically important segment of the system. The first part focuses on designing adigital signal processing for sodar and then integrating itwith meteorological sensors data for local data acquisitionand monitoring of the sensor data, whereas the second partis dedicated to transmitting the processed data into thecloud for remote sensor data access.3.2. Digital Signal ProcessingThe wind, temperature, and humidity sensors along withthe data acquisition (DAQ) card are procured from ScheltTechnology, Noida, India. DAQ digitally processes thesensor’s signal, and the local server monitors the processeddata using the local-monitoring interface. The sensor, DAQcard, and monitoring interface for the meteorological sensors are shown in Fig. 3.The sodar system used in this work is designed anddeveloped in the CSIR-NPL, Delhi. Sodar’s digital signalprocessing consists of analog to digital conversion (ADC),filtering, data processing, and noise cancellation stages.The preamplifier and data logger is powered by a 12-V DCpower supply. The high-powered acoustic pulse of130–140 dB intensity and 2.25 kHz frequency is transmitted in the atmosphere using an acoustic transducer.Sodar receives the backscattered signal every 10 s (Pulserepetition cycle 10 s). In order to capture the completedepth of the temporal ABL structure, a fast DSP is requiredwith a high sampling-rate ADC of 44.5 kHz. The advantage of a higher sampling rate is significant data points.Fig. 2 SMSN architecture123However, it further increases the demand for digital filtering and data processing to extract the crucial informationfrom the signal. Therefore, the signal is passed from thedigital FIR bandpass filter of 50 Hz bandwidth to eliminatethe unwanted frequency component from the signal. Thesefiltered data points are divided into small packets andprocessed using the peak detection method to expel theundesired peaks. The standard mean is calculated of datapoints from each small and stored in the one dimension(1D) array. Similar operations have been performed onevery packet of data and appended to the 1D array. Thesedata represent the height of the received signal in a singleoperating cycle. In order to eliminate environmental noise,atmospheric echoes have been recorded from the sodartransducer before every operating cycle. The blank atmospheric echoes are the environmental noise directly subtracted from the original signal. The DSP system of theproposed design integrated the sodar and meteorologicalsensor data and stores the combined SMSN data in a singlefile. These data are monitored using the LabVIEW-basedsoftware in the local server room. The combined digitalsignal processing of sodar and meteorological sensors isshown in Fig. 4.3.3. IoT ArchitectureThe IoT architecture of the SMSN comprises four components: applications and analytics, infrastructure, integration, and security, as shown in Fig. 5. The applicationsand analytics layer process and display the collectedinformation via IoT-based SMSN. It includes data analysistools and visualization capabilities. The LabVIEW-baseddata acquisition software has been used for data processingand representation. The infrastructure layer consists ofphysical devices such as sensors, communication networks,servers/controllers, and cloud storage. The sodar, windsensor (MeteoWind-2), temperature, and relative humiditysensor (MeteoTemp ? RH) has been used as primarysensing device. A wired connection has been establishedbetween the sensors and the local server. The combinedsensors and local server system are known as a singlesensor node. Another communication network is requiredfor connecting each sensor node and remote server viacloud services. The high-end computer of the 9th Generation Intel Core i5-9400 Processor with 4 GB of randomaccess memory has been used as a local and remote server,whereas the AWS-S3 cloud services have been used forcloud storage. The flowchart of the complete datauploading and real-time acquisition from the AWS S3bucket using LabView is shown in Fig. 6. The entire process is segregated into two stages. In the first stage, theAWS S3 bucket is created, and puts the data from thesensor node into the bucket using a local gateway (Wi-Fi).
SODAR Based Meteorological Sensor Network for Air Pollution Monitoring in Northern IndiaFig. 3 Data acquisition system of meteorological sensorsFig. 4 Digital signal processingof SMSNThen, the data are fetched from the S3 bucket using CloudToolkit for AWS by NI-LabView in the second stage.The data acquisition software based on LabVIEW hasbeen designed to represent and store the data on the localserver. It also established the data communication betweenthe sensor node and cloud through Wi-Fi. The AWS-S3built-in functions such as create the bucket, put-objectbucket, identity, access management (IAM), and anapplication program interface (API) are utilized in thesoftware for IoT networking. The AWS create-bucketfunction creates a dedicated storage location in the AWSS3. The put-object function stores the data in that locationwith unique vital credentials. The AWS-IAM manages theamazon S3 resources, and finally, the API ensures theobject’s storage and retrieval from the bucket. The LabVIEW-based data-acquisition software also fetched theFig. 5 IoT architecture ofproposed SMSN123
P. Chourey et al.Fig. 6 AWS S3 data communication flow chart using LabViewtimestamps value along with the sensors s data. It transmitted it over the IoT network to update the data instantaneously in the database. The complete process of datatransmission using AWS-S3 is presented in Fig. 7.The proposed IoT-based SMSN consists of each sensornode transmitting the data into the cloud and simultaneously monitoring all location data from a remote monitoring station equipped with a high-end server, Wi-Fi, andmultiple
The atmospheric boundary layer (ABL) is the lowest part of the atmosphere ranging from 100 to 2000m above the ground's surface. The ABL-height estimation determines the environmental capacity to disperse the atmospheric pollutants. The behavior and properties of atmospheric pollutants are directly influenced by the topography of the earth's surface. It significantly carries a higher .