Transcription
SoDAR Verification TestTriton SoDAR at Test Site Lelystad16.06.2015– 10.09.2015- Confidential –
SoDAR Verification TestTriton SoDAR II at Test Site Lelystad16.06.2015– 10.09.2015- Confidential –Project number:WIEWT15389Author:Federico Montealegre23/09/2015Reviewer:Anthony Crockford28/09/2015Approval:Erik Holtslag30/09/2015Filename20151203 REP Triton SoDAR II VER MM01 Draft for client reviewACrEHoFinal Ecofys WTTS 2015 by order of: Vaisala Inc.ECOFYS WTTS B.V.Kanaalweg 15G 3526 KL Utrecht T 31 (0)30 662-3827 E info@ecofyswtts.com I www.ecofyswtts.comChamber of Commerce 24468357
SummaryOn request of Vaisala Inc., Ecofys Wind Turbine Testing Services (WTTS) carried out a verification of aTriton SoDAR (Triton SoDAR II, Serial number 609) against the reference met mast TSL-MM01 at theWTTS Test Site Lelystad (further referred to as TSL).The 120 m TSL-MM01 is fully IEC and MEASNET compliant and equipped with high quality cupanemometers at 40, 80, 100 and 120 m. In addition, wind vanes for wind direction measurements arelocated at 40 and 118 m. The SoDAR was collecting wind data at four common heights with the metmast. The SoDAR verification campaign lasted from 16/06/2015 to 10/09/2015.All measured data was filtered to ensure entirely valid datasets. The verification analysis is based onthe IEC standard 61400-12-1 (ed 2, draft [2]). The Triton SoDAR 609 verification test covers a fullthree months of collocated measurements during summer and autumn 2015, and has permitted thecollection of over 5,000 concurrent valid data points. This resulting dataset is significantly larger thanthe minimum required, providing a robust basis for uncertainty calculations in each of the 0.5m/s windspeed bins, with the exception of a few points at high wind speeds (15 and 16m/s) at the lower heights.Due to the typical summer wind climate, filling a total of three points at every high wind speed bin wasnot possible. Nevertheless, all bins are filled at the top measurement heights and the very good overalldata availability is considered sufficient for the analysis.Linear regression between the overall SoDAR and met mast recordings showed consistent, highlycorrelated measurements with slopes near unity. The calculated uncertainty in the SoDAR wind speedmeasurements is low, in line with first-class anemometry for the majority of the wind speed bins. Thecalculated uncertainty tables (in Appendix C) can be used directly in wind resource assessments,together with the classification uncertainty and site-specific uncertainty components.Sensitivity tests of the wind speed deviation revealed that the wind speed deviation shows no significantlinear correlation to external conditions: vertical wind speed, horizontal wind speed, turbulenceintensity or rain. This indicates that the SoDAR is insensitive to these factors.The SODAR measurements were also validated against NORSEWiND criteria for LiDAR remote sensors[3] and meets the Ecofys WTTS acceptance thresholds for field measurements. There is scatter in theindividual recordings, which is partly due to the distance between the SoDAR and mast during the test.The overall high correlations and very good linear regression fit indicate that the SoDAR is functioningproperly with high accuracy.As a result of this test, Ecofys WTTS judges that the SoDAR Triton 609 is suitable for fieldmeasurements. The SODAR will measure the long-term mean wind speeds with accuracy comparableto cup anemometry in flat terrain. However, when analysing Triton data sets, due consideration shouldbe made for the standard deviation of 10-minute values characteristic to the system.ECOFYS WTTS B.V.Kanaalweg 15G 3526 KL Utrecht T 31 (0)30 662-3827 E info@ecofyswtts.com I www.ecofyswtts.comChamber of Commerce 24468357
Table of contents12345Introduction51.1Scope of the study51.2IEC 61400-12-1 (ed 2)51.3NORSEWInD verification criteria61.4Structure of the Report7Verification Campaign82.1Site description82.2Reference IEC-compliant Met Mast description “MM01”92.3SoDAR Location102.4SoDAR Orientation and Time Synchronization112.5Valid wind direction sectors13SoDAR Verification Procedure163.1Met Mast Data Filtering163.2SoDAR Data Filtering163.3Statistical tests17Results & Discussion204.1Data coverage204.2Wind speed verification224.3Wind direction verification244.4Sensitivity tests274.5Verification uncertainty analysis284.6NORSEWInD criteria validation31Conclusions32Appendix A Anemometer calibration certificates34Appendix B Uncertainty analysis38Appendix C Detailed uncertainty analysis42ECOFYS WTTS B.V.Kanaalweg 15G 3526 KL Utrecht T 31 (0)30 662-3827 E info@ecofyswtts.com I www.ecofyswtts.comChamber of Commerce 24468357
1 IntroductionEcofys WTTS verified the operation of the Triton SoDAR with serial number 609, prior to its applicationin a wind measurement campaign. The Triton SoDAR 609 is verified against a fully IEC- and MEASNETcompliant met mast (120 m) at the Ecofys Test Site Lelystad (TSL). A complete and detailedassessment of the SoDAR verification process is presented with special attention to sensitivity testsand uncertainty.1.1 Scope of the studyThis study verifies the accuracy of the Triton SoDAR with serial number 609, and determines whetherit operates as specified by the manufacturer to ensure that the SoDAR measurements from this unitare traceable to international standards for use in wind resource assessments. The verificationprocedure evaluates the accuracy of the SODAR measurements based on two international windindustry standards: IEC 61400-12-1 verification procedure and uncertainty evaluation [1] [2] NORSEWInD SoDAR validation criteria [3]1.2IEC 61400-12-1 (ed 2)IEC 61400-12-1 (ed 1 [1]) is the definitive industry-wide standard for high-quality wind measurementcampaigns using standard anemometry. The second edition (IEC 61400-12-1 (ed 2)*) also specifiesthe use of SoDAR, with a detailed procedure (Annex L) that ensures the traceability of themeasurements and evaluates associated uncertainty components, which can be applied in windresource assessments:“This test is a comparison of the remote sensing device measurements to those from calibrated cupanemometers mounted on a mast spanning a significant portion of the height range of interest. Thepurpose of this test is to convey traceability to international standards to this particular device, in theform of an uncertainty. A second result of the verification test is an assessment of the random noise ofthe device.” [2]The systematic uncertainties in the SoDAR measurements are evaluated for each 0.5 m/s wind speedbin from 4-16 m/s: “The standard uncertainty of the reference sensor”; “The mean deviation of the remote sensing device measurements and the reference sensormeasurements”; “The standard deviation of the measurement of the RS device calculated as the standarddeviation of the measurements divided by the square root of the number of data per bin”;* “Uncertainty of the remote sensing device due to mounting effects”; and “Uncertainty of the remote sensing device due to non-homogenous flow.” [2]Since the second edition is not yet published, the analysis is based on a Committee Draft [2]WIEWT15389 – Triton SoDAR 609 Verification5
The wind speed dataset should include at least 3 pairs of valid measurements in each wind speed binbetween 4 m/s and 16 m/s, and the total amount of valid data should be minimum 180 hours. Forpractical reasons, Ecofys WTTS normally limits the verification campaign to a period of 8 weeks, whichshould be sufficient to meet these criteria.Wind direction measurements are validated in 5 degree bins by means of regression analysis betweenSoDAR and met mast wind vane measurements.1.3NORSEWInD verification criteriaThe IEC procedure does not establish thresholds for the accuracy of the SoDAR measurements; for thisreason, Ecofys WTTS also applies the validation criteria from the EU NORSEWInD project. Even thoughthese criteria were designed for LiDAR, it is used in this analysis as a reference, as these criteria areused throughout the wind industry. These criteria can also be evaluated with a shorter campaign sothe SoDAR can be re-validated prior to each measurement campaign – with a comparison to theseresults.NORSEWInD has defined validation criteria to evaluate the absolute error and the quality of the linearregression between Remote Sensors and anemometry: “Absolute error – difference in reported wind speed between the reference and test instrumentbased on 10-minute averages”; “Linear regression gradient – this is based on a single variant regression, with the regressionanalysis constrained to pass through origin (y mx b; b 0)”; and “Linear regression R-squared values – is the quality of fit value returned from the analysisperformed to assess the linear regression gradient value.” [3]The NORSEWInD criteria recommends at least 600 valid data points. As noted above, Ecofys WTTSlimited the verification campaign to a period of 12 weeks max., which was sufficient to gather these600 valid data points. If necessary, the analysis may be based on a smaller sample; to maintain anaccurate comparison, a minimum of 200 valid data points is needed.The validation criteria are shown in Table 1. The primary comparison will be between measurementsat the top measurement height of the met mast.If sufficient valid data is collected within the measurement period, the data will also be compared intwo wind speed ranges. This can help to identify non-linearities.Table 1: NORSEWInD Criteria [2]CriteriaNORSEWInD ThresholdAbsolute error 0.5m/sNot more than 10% of data to exceed this valueLinear regression slopeBetween 0.98 and 1.01Linear regression R² 0.98WIEWT15389 – Triton SoDAR 609 Verification6
If the SODAR is compliant with the NORSEWInD thresholds, Ecofys WTTS will deem that the unit canbe used for field measurements as a replacement to a met mast, while maintaining a similar level ofaccuracy to IEC-compliant cup anemometry.Ecofys WTTS recognises that there can be a wide range of other purposes for wind measurements withremote-sensing devices, and also that the NORSEWInD criteria were designed for LiDAR evaluations,where the device can be located directly at the mast base, which is not possible for SoDARs. Thus,Ecofys WTTS considers modified thresholds to determine if the unit is suitable in general for fieldmeasurements. These thresholds consider only the overall linear regression and allow for a slightlywider tolerance. The threshold levels are shown in Table 2. The primary comparison will be betweenmeasurements at the top measurement height of the met mast.Table 2: Ecofys WTTS Acceptance Thresholds, based on NORSEWInD criteria [2]NORSEWInD AcceptanceThreshold for Replacementof IEC-compliant CupAnemomeryCriterionCategory4-8m/s 200Number of valid data points8-12 m/s 200ALL 600Percentage of data points thatexceed 0.5 m/s absolute errorLinear regression slopeLinear regression – R2Ecofys WTTSAcceptanceThreshold for FieldMeasurementsALL 10%n/a4-8m/s0.98-1.01n/a8-12 m/s0.98-1.01n/aVariationin slope 0.015n/aALL0.98-1.010.98-1.024-8m/s 0.98n/a8-12 m/s 0.98n/aALL 0.98 0.951.4 Structure of the ReportFirst, TSL is described in detail including its surroundings, wind turbines, met masts, obstacles andorography. Moreover, the SoDAR verification process is designed based on the met mast layout,instrumentation, valid wind sectors and time synchronisation.Subsequently, the verification procedure is described. Data filtering and data quality are defined andsummarised and statistical methods are explained. Results for wind speed and wind direction arepresented in the ‘Results and discussion’ chapter including a small discussion subsection per variable.This chapter also covers on data filtering, NORSEWInD verification criteria and Ecofys WTTS’ SoDARthresholds, a sensitivity analysis and an uncertainty analysis. Finally, conclusions are drawn.WIEWT15389 – Triton SoDAR 609 Verification7
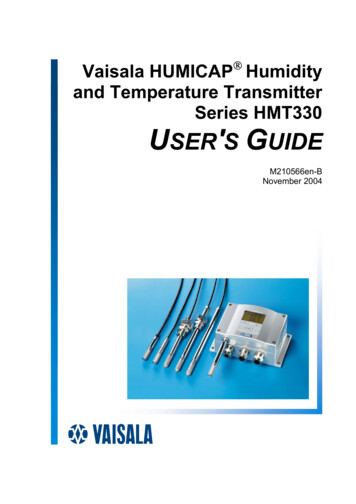
2 Verification Campaign2.1 Site descriptionTSL is located in a flat, open landscape in the centre of the Netherlands with meadows, scatteredhouses and several wind turbines nearby. Within a 4 km radius of the site, the terrain does not varymore than 1.6 m (from 2.9 to 4.5 m below sea level [4]). Including the water level in the canals, whichis about 2 m lower than surrounding land, the slope in the region never exceeds 2% and all positionsat TSL are fully compliant with the IEC 61400-12-1 Terrain Assessment [1].Figure 1: Terrain at TSL. TSL-MM01 is located to the northwest of wind turbine WTG01 (it is shown as a red triangle).WIEWT15389 – Triton SoDAR 609 Verification8
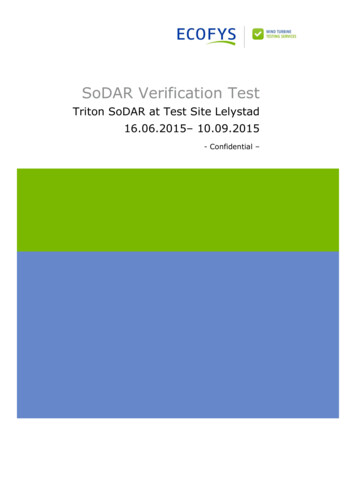
2.2 Reference IEC-compliant Met Mast description “MM01”The verification is carried out against the fully IEC compliant instruments on the TSL-MM01 met mast,whose location is specified in Table 3.Table 3: Coordinates of met mast TSL-MM01Easting [RD]Northing [RD]168,522504,345Met mast TSL-MM01The instrumentation used for this verification is specified in Table 4.Table 4: Partial sensor list of met mast ensor 20TopanemometerN/AThies TFCadv.06092421436778AnemometerA2100Double boom349 Thies TFCadv.06091531436791AnemometerA380Double boom169 Thies TFCadv.04088751436775AnemometerA440Single boom169 Thies TFCadv.04088701436774Wind VaneWF1118Single boom351 Thies TFC06131639/Wind VaneWF240Single boom349 Thies TFC08141535/One top anemometer is installed at 120 m next to a lighting protection rod. The lightning rod is about5 m tall at a distance of 1.3 m from the top-anemometer, as shown in the drawing below. The supportboom of the lightning rod is oriented towards 150 . This design of the lightning detector ensures limitedflow distortion of the top-anemometer recordings according to specifications in [1].Figure 2: Top-section of TSL-MM01 with top anemometer, wind vane and the lightning rod.Serial numbers are used as reference to the calibration certificates from Deutsche Windguard, shown inAppendix A.*WIEWT15389 – Triton SoDAR 609 Verification9
The lower anemometers and wind vanes are mounted on booms that are designed according to the IECstandard 61400-12-1 (edition 1) such that flow distortion is minimised [1].The mast and some of the instruments (WF1) were installed on MM01 on 18/07/2013. In January andFebruary 2015, this met mast was equipped with a parallel measurement system with additionalinstruments. On 24/02/2015, the refurbished MM01 was commissioned. All new anemometers werecalibrated at the wind tunnel facility of Deutsche WindGuard, Germany in November 2014. Allcalibration certificates can be found in Appendix A. The uncertainty in wind measurements is minimisedthrough the selection of high-quality, calibrated instruments.For the current test, the wind direction recordings from both the wind vane at 118m and 40m wereused and assigned to the closest measurement height of the cup-anemometers. Other instrumentsinclude a rain sensor, temperature sensor, humidity sensor and a barometer.2.3 SoDAR LocationThe SODAR was installed by personnel from Vaisala Inc. at a test position at a distance of approximately142 m to the WNW of the TSL-MM01 met mast, as specified in Table 6 and shown in Figure 3. Detailsof the installation are presented in a separate report by Ecofys WTTS. The SoDAR was configured torecord wind speeds at 30, 40, 50, 60, 80, 100, 120, 140, 160, 180, and 200 m (above ground level),which match the measurement heights of the met mast, as well as a number of other heights (notincluded in this verification analysis).The mean horizontal wind speed, mean wind direction were provided for each 10 min period at eachheight. Moreover, the mean vertical wind speed and a quality column within a 10 min time interval foreach height were also recorded and provided.Table 5: Details of the SODAR during verification campaignParametersTriton SoDAR 609Test IDTriton SoDAR IISystem serial number609Measurement range40-200 m above ground levelBeam angles11.5 Timestamp interval10 minTimestampUTCData period16/06/2015 to 10/09/2015Data columns recordeddirection, Mean vertical wind speed, TI Quality,Mean horizontal wind speed, Mean windQualityWIEWT15389 – Triton SoDAR 609 Verification10
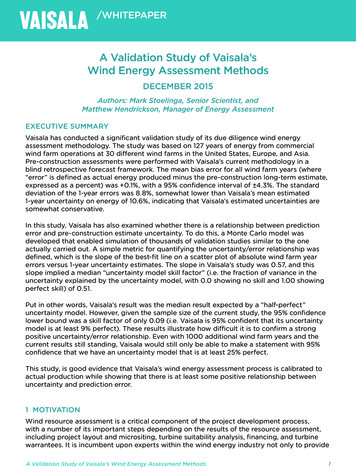
Table 6: Coordinates of Triton SoDAR 609 measurement positionSODAR ng[RD]Triton 60952.527061 E5.584502 N168,390504,397Figure 3: Triton SoDAR 609 deployed at Ecofys WTTS test site on 13.06.2015 142.5m away from TSL-MM01.2.4 SoDAR Orientation and Time SynchronizationThe Triton SoDAR 609 was oriented towards the North (shown in Figure 5), so no offset was applied inpost-processing. It is synchronised to the Coordinated Universal Time (UTC) every day via GPS clockand the timestamps correspond to the end of the ten-minute average. In the met mast data acquisitionsystem, the system clock is synchronised with a NTP time server 5 minutes before every hour. In thisway, the Triton SoDAR’s time series and the mast data’s time series can be examined and adjusted toline up correctly and ensure that time offset between the SoDAR and met mast is always within 6seconds, in agreement with IEC standards.WIEWT15389 – Triton SoDAR 609 Verification11
Figure 4: View from the SoDAR 609’s position towards the east and to TSL-MM01.WIEWT15389 – Triton SoDAR 609 Verification12
Figure 5: Looking North over the Triton SoDAR’s position during its deployment. It was installed with 0 offset to themagnetic north.2.5 Valid wind direction sectorsEcofys WTTS performed a Site Assessment investigation and internal report for the Triton’s SoDARposition in reference with the met mast TSL-MM01 at TSL, in accordance with the requirements of IEC61400-12-1 regarding power performance measurements [1]. This analysis was done before the startof the measurements to ensure that the location could provide adequate conditions for the test:provision of a sufficiently large sector with predominant winds, and away from obstacles that couldinterfere with the SoDAR measurement techniques.The Obstacle Assessment has shown that some wind direction sectors must be excluded due to theinfluence of neighbouring wind turbines. Three TSL wind turbines are operational to the southeast ofthe met mast (WTG 1, 3 & 4), so the south-eastern sector is excluded. A row of wind turbines to thenorth (partly TSL, partly commercial) results in a large excluded sector as well. The excluded sectorsare shown in the figure below.WIEWT15389 – Triton SoDAR 609 Verification13
1713 425297417305409313401321393329385337377345369 353361Figure 6: Excluded Sectors for TSL-MM01 and co-located SoDAR position, due to surrounding wind turbines (no othersignificant obstacles); each colour represents a different wind turbineBased on this Obstacle Assessment, the primary remaining valid sector for IEC-compliant windmeasurements is from the south-west and a smaller sector to the west, as shown in Figure 7.Table 7: Excluded wind sectors for Triton SoDAR 609 Verification at test positionObstacles at TSLSector minimum [ ]Neighbouring wind turbinesForests, building or powerpylonsSector maximum [ ]Width of excluded sector [ ]0717110618983286.536073.5000Mast shadowing of anemometryThe top anemometer (120 m) will not be affected by mast shadow, but is influenced by the lightningrod. By comparison of wind speed measurements at lower heights, it was determined that the lightningrod affected wind sectors from 140-180 . The boom-mounted anemometers will experience mastshadowing for southerly winds. A comparison of wind speed ratios found influenced wind sectors from160-190 (and 330-10 for V3).Wakes of reference met mast on the measurements of the SoDARAn additional data filter is applied to exclude more sectors influenced by the wakes of the met mast orthe neighbouring wind turbines. The potential influence of the wakes is investigated by plotting theratios of the met mast and the SoDAR measurements as a function of wind direction, as proposed in[2]. Wind direction sectors with a median ratio of 1.05 or 0.95 are excluded. In this case, no sectorswere excluded due to this filter.Final valid wind sectorsThe remaining valid sectors for the verification of the SoDAR against met mast TSL-MM01 are shownin the figure and table below.WIEWT15389 – Triton SoDAR 609 Verification14
Figure 7: Valid Sectors for SoDAR position in reference to TSL-MM01 at TSL.The selection of this SoDAR position enabled the use of the sectors showed above, while keeping thedistance to the closest nearby turbines more equal and more than 330 m away. The distance to Mastwas calculated to be of 142.5 meters, which supported the informal practical criteria “SoDAR distance height of the mast 20 m”.Table 8: Valid Wind Direction Sectors for SoDAR Verification Measurement for TSL-MM01SectorSectorminimum [ ]maximum [ ]Width of Sector [ ]E7110635S-NW189286.597.5WIEWT15389 – Triton SoDAR 609 Verification15
3 SoDAR Verification ProcedureThe SoDAR data will be compared to the met mast data on the basis of 10 minute averages.To increase the accuracy and repeatability of the verification test, the datasets are filtered accordingto the criteria described below. The filtering is carried out in Windographer using flag rules to disabledata.The filtered data forms the basis for the data analysis, based on the IEC 61400-12-1 verificationprocedure and uncertainty evaluation [1] [2] and NORSEWInD SoDAR validation criteria [3]. All dataanalyses techniques are described in Section 3.3, and are performed in Excel.3.1 Met Mast Data FilteringThe met mast dataset is filtered according to the following protocols:3.1.1 System non-availabilityThis category covers power outages, maintenance and other external issues. During these periods, nodata is recorded, so data does not need to be flagged or disabled. This category is defined to explainany missing data due to external issues.3.1.2 Wind direction recordingsWind direction measurements are not available at all heights. Therefore, Wind Vane WF1 (at 118 m) islinked to wind speeds of 80, 100 and 120 m. Wind Vane WF2 (at 40 m) is linked to wind speeds at 40m.3.1.3 Icing of instrumentsDuring sub-zero temperatures, all met mast instruments including cup-anemometer data will bechecked for icing by inter-comparison with other heights and checks for constant output during frost.In case suspicion of icing exists, all data will be disabled and flagged as ‘Outside operational envelope’.3.1.4 Excluded wind sectorsAll excluded sectors are filtered out, according to the valid sectors identified in Section 2.5. Thiscategory combines mast shadowing of mast instrumentation and disturbed sectors. All wind data isdisabled if either wind vane is within an excluded sector, and flagged as ‘Excluded sectors.’3.2 SoDAR Data FilteringThe SoDAR dataset is filtered according to the following protocols:3.2.1 System non-availabilityThis category covers power outages, maintenance and other external issues. During these periods, nodata is recorded, so data does not need to be flagged or disabled. This category is defined to explainany missing data due to external issues.WIEWT15389 – Triton SoDAR 609 Verification16
3.2.2 Excluded wind sectorsAll wind data is disable and flagged as ‘Excluded Sectors’ for any time stamp where either met mastwind direction is within excluded sectors.3.2.3 Conditions outside operational envelopeA SODAR can be disturbed by strong noise or weather conditions such as heavy snow. These periodswould be marked as “outside operational envelope”. The client provided vertical wind speed criteria toaccount for invalid points due to precipitation, which was assigned to this filter.3.2.4Wind Quality Factor - Low signal to noise conditionsThe wind quality factor is embedded in the acquisition of the SoDAR measurement data and is a functionof the signal to noise ratio and the number of valid samples collected for every 10 minute interval. Itis used to filter noisy wind data and as per manufacturer’s recommendation all timestamps where thequality factor values are less than 90% were filtered out.3.2.5 Turbulence Intensity Quality FactorSince the vector wind speed is inversely proportional to the turbulence intensity estimation, high TIvalues are produced at low wind speeds. In the Triton SoDAR 609 a turbulence quality factor wasdefined to eliminate invalid turbulence measurements from the data set in low wind speed conditionse.g. 3.5m/s. As per manufacturer’s recommendation, this column and all TI Quality values 90%were filtered out.3.2.6 Vertical wind speed filter criteriaDuring rain, the Triton SoDAR 609 can interpret the falling raindrops or snowflakes as a strong verticalwind and, as a result, the measured wind speed can be incorrect. Filtering vertical wind speeds /1.5 m/s removes any data affected by precipitation. This is summarised together with SNR filters, inthe data coverage Table 15.3.2.7 Data processing issuesData is disabled in the event the data processing software fails to remove erroneous data.3.3 Statistical testsA number of statistical methods are applied to the filtered datasets, based on the requirements of IEC61400-12-1 [2].3.3.1 Scatter plotThe measurements of the SoDAR are plotted against the measurements of the reference anemometer,also showing the deviations between the SoDAR and reference anemometer. The wind speed deviationis defined as the deviation between SoDAR and met mast mean wind speeds at the same height. Themean deviation and standard deviation of deviations is also calculated.3.3.2 Bin averaged analysisA bin averaging procedure is used to compare the SoDAR measurements and the referenceanemometers, using wind speed bins of 0.5 m/s between 4-16 m/s. The bin-wise deviation betweenWIEWT15389 – Triton SoDAR 609 Verification17
the SoDAR and reference measurements is the key result. Each wind speed bin should contain at least3 valid pairs of data to ensure a representative SoDAR verification [2].Linear regression analysis is applied in order to evaluate the relationship in terms of horizontal meanwind speed and mean wind direction with zero and non-zero constants at each height. Also thecoefficient of determination (R²) of the linear regression is given. Below, the formulae are given foreach parameter that is analysed.Two-parameter linear regressionThe two-parameter Ordinary Least Squares regression equation is:y C kxCoefficient of determinationThe coefficient of determination (R²) of the linear regression is calculated as:R 2 1 SS errSS totSS err yi f i 2iSS tot yi y 2ifwhere i is the modelled value andyis the mean of the observed data.Wind speed deviationThe mean and standard deviation of the wind speed deviation is also calculated for each wind speedbin of 0.5 m/s.3.3.3 Wind directionSimilarly, a bin averaging procedure is used to compare the SoDAR wind direction measurements andthe reference wind vanes, using wind direction bins of 10 (based on the test uncertainty shown inSection 2.2). A two-parameter Ordinary Least Squares linear regression is used, in order to identifyany offset from zero.3.3.4 Sensitivity testsSeveral sensitivity tests are run to find any possible relationship with external conditions, includingSoDAR vertical wind speed, met mast mean wind speed, turbulence intensity and precipitation.3.3.5 Uncertainty analysisAfter all sensitivity tests and statistical analyses, Ecofys analyses the uncertainty of the windmeasurements of this SoDAR. The uncertainty calculations are based on IEC 61400-12-1 (ed 2) whichis still in draft [2]. If information is absent in the draft, formulae and definitions were taken from thefirst edition [1].The uncertainty resulting from the SoDAR verification test is divided into 5 separate uncertainties, assummarised below:WIEWT15389 – Triton SoDAR 609 Verification18
1. Reference uncertainty (in anemometry)a.Wind tunnel calibrationb.Cup anemometer effects according to the anemometer classificationc.Cup anemometer mounting effectsi. Mast shadowingii. Boom distortioniii. Lightning rod distortiond.Uncertainty of any applied mast correction2. Mean deviation of the SoDAR measurements and the reference anemometry measurements3. Standard deviation of the measurement of the SoDAR4. Uncertainty in mounting effects during the verification test5. Uncertainty of the SoDAR due to non-homogeneous flow within the measurement volume,during the verification testThe uncertainties are combined as the square root of the sum of squares:𝑈𝑡𝑜𝑡𝑎𝑙 𝑈12 𝑈22 𝑈32 𝑈42 𝑈52The calculated uncertainty refers to the uncertainty in the performance verification test. The totaluncertainty for future wind measurement campaigns will also include components relating to sitespecific mounting and flow condition on-site, and uncertainty resulting from the classification of theSoDAR (sensitivity to environmental variables). These uncertainties should be assessed as part of thewind resource assessments.3.3.6 NORSEWInD criteriaSome additional statistical tests are performed to compare with the NORSEWInD criteria [3].The linear regression, including coefficient of determination, is re-calculated for three different windspeed ranges without any bin-averaging. First, all wind data is used, then two smaller ranges arefiltered for 4-8 m/s and 8-12 m/s. The slopes of the linear regression fit are compared for the twosmaller ranges, in order to identify non-linearity in the system performance.Also, the wind speed deviation is assessed in terms of absolute error.Single-parameter linear regressionThe NORSEWInD crit
2.3 SoDAR Location 10 2.4 SoDAR Orientation and Time Synchronization 11 2.5 Valid wind direction sectors 13 3 SoDAR Verification Procedure 16 3.1 Met Mast Data Filtering 16 3.2 SoDAR Data Filtering 16 3.3 Statistical tests 17 4 Results & Discussion 20 4.1 Data coverage 20 4.2 Wind speed verification 22


![Humidity101 HumidityTheory.pptx [Read-Only] - Vaisala](/img/46/humidity101-humiditytheorytermsdefinitions.jpg)