Transcription
2021Revit to Power BI (Arch)Rev 6
Power BI Export tool – How does it work?.3Visualize your data in 2D and 3D .3What is Power BI? .3Getting Started .3Revit Architectural Building Example .4Power BI Export – How does it work? .4Initial 2D or 3D View Setup .4Settings .4Check boxes:.5Selection .5Visual .5Website.5Export .5Export for Power BI Consumption.5Power BI Desktop .6Get Data.6Import 3D Visual .7Pin 3D Visual .83D Model Example .9Add Fields .9Add Table . 10Sort Column . 10Highlight Elements. 11Additional Table Data. 11Save . 122D/3D Room Data Example . 12Power BI Desktop . 13Get Data. 13888 451 9980MG -AEC.COMPage 1
Import 3D Visual . 14Pin 3D Visual . 153D Model Example . 16Add 3D Visual . 16Add Fields . 17Add 2D Visual . 17Add Fields . 18Add Filter . 18Add Table . 18Sort Column . 18Highlight Elements. 19Additional Donut Visual for Area Percentage . 20Add Slicer for Level Filter . 20Save . 21888 451 9980MG -AEC.COMPage 2
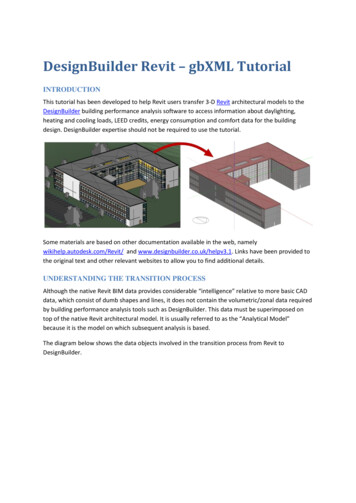
Power BI Export tool – How does it work?Visualize your data in 2D and 3DWhat is Power BI?Power BI is a data visualization platform developed by Microsoft. It allows you to unify data from manysources to create interactive, immersive dashboards and reports that help you gain deeper data insight intoyour project.With the Power BI Export tool, which is part of the MG toolkit, you can now use Revit data for creatingtables, graphs, and visual representations of a BIM model. Once exported, it allows you to efficiently reviewand manipulate the data without needing to open the Revit file. Perfect for meetings, creating reports orquick reviews.Getting StartedCheck to make sure you are at least on this version Power BI or higher. If not, stop and update Power BI toa newer version before continuing.888 451 9980MG -AEC.COMPage 3
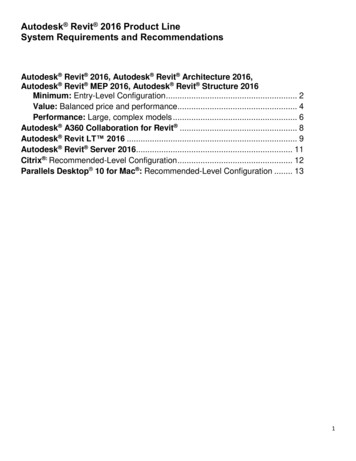
Revit Architectural Building ExampleWe suggest starting with a small model like the example that comes by default with Revit called“rac basic sample project.rvt.” You can get to it but using the below method.Power BI Export – How does it work?Power BI Export is a new tool added to the MG toolkit for Revit that allows you to export and analyze databased on your selection or an active view.Initial 2D or 3D View SetupYou will need to setup a 2D or 3D view before starting the tool. The view needs to be set so it is showingonly the elements that need to be exported to Power BI. The reason for this is because of the performanceof the tool when exporting to the Excel Spreadsheet.In our testing of large models, being 300MB or larger, we saw the export process to be up to 5 minutes inlength. We must convert the geometry and the detail level of that geometry to make it work in Power BI.That is the reason for the LOD option in our tool, if the export performance degrades then try changing theLOD value to 250 and try again.Click on the MG.aec tab - Go to Analysis Panel - Select Power BI Export toolSettingsActive View is the default, and recommended, but you can select elements before starting the tool.888 451 9980MG -AEC.COMPage 4
Strip Units: Exports dimensions without units (recommended for working with Power BI).Export 3D Mesh: Exports 3D mesh geometry (if the geometry is too complex, it will export bounding box)LOD (Level of Detail): Select level of detail in values from 100 to 500, helps with Export PerformanceSelectionSelect families and elements you want to export by checking boxes in front of the elements use toolbar to: Deselect all nodesInvert checked nodesCollapse all nodesExpand all nodesVisualOpens a folder location of Power BI visuals (2D and 3D). Remember this path or Copy it to the clipboard touse later in Power BI desktop. (C:\ProgramData\KobiLabs\Toolkit for Power BI).WebsiteOpens website to show instructions, this PDF goes into greater detail.ExportSelect Export and save it as Excel (recommended) or CSV file.Export for Power BI ConsumptionFor the next step let’s export an Excel Spread Sheet with these settings. This will take up to 1 minute togenerate the spread sheet so be patience. Choosing only a few categories will speed up the processing. Bepatience on this tool when opening and exporting with large models. Open the Default {3D} View from the Project Browser Start Export to Power BI tool Check Mark Strip Units, Check Mark Export 3D Mesh, and LOD set to 500 All Categories check marked and Export888 451 9980MG -AEC.COMPage 5
Power BI DesktopOpen Power BI Desktop and select Get data.Depending on the exported data type from Revit, select Excel or Text/CSV format and select Connect.888 451 9980MG -AEC.COMPage 6
Now select the spread sheet that exported earlier.When the Navigator dialog window opens, select Kobi Toolkit for Power BI and click Load.In the left side of Power BI Desktop app is the Visualization panel. Click on three dots ( ) and select ‘Importa visual from a file’.888 451 9980MG -AEC.COMPage 7
Find the location of KobiLabs Power BI Visuals or paste in the path you copied earlier from Revit (Example:C:\ProgramData\KobiLabs\Toolkit for Power BI). For this first example select the 3D version.By opening this file, you can now create custom visualizations of Revit data in 3D.Visualize your data in 3DPin 3D VisualRight-click on icon to pin the visual so it is with the other visuals the next time you open Power BI.888 451 9980MG -AEC.COMPage 8
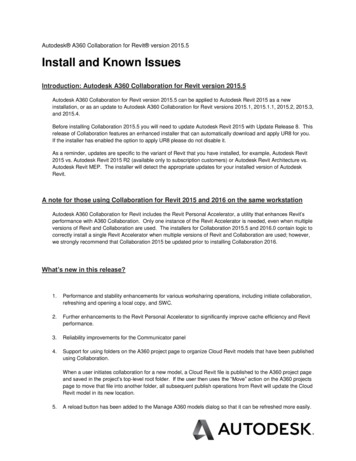
3D Model ExampleSelect 3D visualizationup 2/3 of the dashboard.and that a visual is now on the dashboard. Select the corner to enlarge it so it takesAdd FieldsIn Fields palette select these data fields: ID, Name, Area, and Pbi3DGeometry. Insert the data by dragging anddropping in selected rows: ID, Caption, Values, and Geometry.888 451 9980MG -AEC.COMPage 9
To put some additional meaning to the visual we will add a table to filter through the different types that arein the model. Select the Table visual and enlarge it if needed. Add these (2) fields to the values row: Categoryand Type. Drag and drop to add and sort them, top is most left in the table.Sort ColumnPick the Category column header to sort A to Z.888 451 9980MG -AEC.COMPage 10
Use the CTRL key to select the Floors in the table and notice the 3D model updates showing those Floortypes. Pick the floors again to unhighlight them in the model.Remember, all the parameter data that you see in the Properties window in Revit are available in Power BI. Itcomes down to how do you want to visualize that data with a 2D or 3D model.Additional Table DataWe add the data field from Revit called Length to see how much total length of each type of wall is in themodel. On the Fields palette drag and drop Length and place it below the Type data field. Note the table nowhas an additional column showing the total length for each type of wall in the model.888 451 9980MG -AEC.COMPage 11
Also note that the category has list has been somewhat filtered but let us add a filter, so it only shows theWall category. On the Filter palette select the down arrow to expand the list and check mark the Wallscategory.Save your newly created dashboard showing the types of walls and total lengths of those types.Back in Revit, open the out of the box example Revit model called “rac advanced sample project.rvt.” Openthe default 3D view and use the Pro-Revit tool called Filter to choose the Rooms in the model. Choose thesettings below and export a spread sheet called “rac advanced sample project Default 3D Model Room.”888 451 9980MG -AEC.COMPage 12
Open Power BI Desktop and select Get data .Depending on the exported data type from Revit, select Excel or Text/CSV format and select Connect.888 451 9980MG -AEC.COMPage 13
Now select the spread sheet that exported earlier.When the Navigator dialog window opens, select Kobi Toolkit for Power BI and click Load.In the left side of Power BI Desktop app is the Visualization panel. Click on three dots ( ) and select ‘Importa visual from a file’.888 451 9980MG -AEC.COMPage 14
Find the location of KobiLabs Power BI Visuals or paste in the path you copied earlier from Revit (Example:C:\ProgramData\KobiLabs\Toolkit for Power BI). For this first example select the 3D version.By opening this file, you can now create custom visualizations of Revit data in 3D.Visualize your data in 3DPin 3D VisualRight-click on icon to pin the visual so it is with the other visuals the next time you open Power BI.888 451 9980MG -AEC.COMPage 15
3D Model ExampleSelect 3D visualizationup 2/3 of the dashboard.and that a visual is now on the dashboard. Select the corner to enlarge it so it takesAdd 3D VisualSelect 3D visualizationand that a visual is now on the dashboard. Select the corner to enlarge it so ittakes up 1/2 of the dashboard.888 451 9980MG -AEC.COMPage 16
In Fields palette select these data fields: ID, ID, Name, and Pbi3DGeometry. Insert the data by dragging anddropping in selected rows: ID, Caption, Values, and Geometry.Add 2D VisualSelect 2D visualization888 451 9980and that a visual is now on the dashboard. Arrange it like the image below.MG -AEC.COMPage 17
In Fields palette select these data fields: Level, ID, Name, and Pbi2DGeometry. Insert the data by dragging anddropping in selected rows: ID, Caption, Values, and Geometry.Add FilterNote I added a Filter so it would only show the Level 1 rooms. I then repeated that process to build a 2Dvisual for Level 2 and for Level 3.Add TableTo put some additional meaning to the visual we will add a table to filter through the different types that arein the model. Select the Table visual and enlarge it if needed. Add these (2) fields to the values row: Level,Number, Name, Perimeter, and Area . Drag and drop to add and sort them, top is most left in the table.Sort ColumnPick the Number column header to sort 101 to 328.888 451 9980MG -AEC.COMPage 18
Select the different rooms in the table and notice the 3D and 2D model updates showing those rooms. Pickthe room again to unhighlight them in the model.Remember, all the parameter data that you see in the Properties window in Revit are available in Power BI. Itcomes down to how do you want to visualize that data with a 2D or 3D model.888 451 9980MG -AEC.COMPage 19
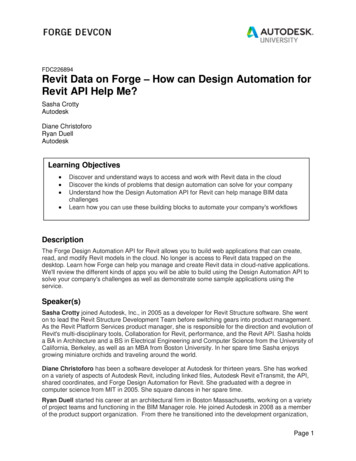
Additional Donut Visual for Area PercentageAdd a Donut visual and add the Fields: Name and Area . You now can analyze which rooms are taking up thelarger percentage of area in the building. By selecting on one of the % on the pie chart highlights it in the modelvisuals.Make sure nothing is selected on the dashboard. On the visualize palette select the Slicer tool.888 451 9980MG -AEC.COMPage 20
Save your newly created dashboard showing the room data in a 2D and 3D visual.888 451 9980MG -AEC.COMPage 21
Back in Revit, open the out of the box example Revit model called "rac_advanced_sample_project.rvt." Open the default 3D view and use the Pro-Revit tool called Filter to choose the Rooms in the model. Choose the settings below and export a spread sheet called "rac_advanced_sample_project_Default 3D_Model_Room."