Transcription
JMP METHODOLOGY2017 UPDATE & SDG BASELINESMarch 2018Nutrition Section, Program DivisionMarch 2017JMP METHODOLOGY: 2017 UPDATE & SDG BASELINES1
ContentsSummary41.Identification of national datasets62.Data extraction, cleaning and pre-processing82.1 Data compilationYear assignmentGeographic scopeWeighting2.2 Technology classificationsStandard classifications: drinking waterStandard classifications: sanitationStandard classifications: handwashing2.3 Service level classifications: waterWithin 30 minutesOn premisesAvailable when neededFree from contamination2.4 Service level classifications: sanitationNot shared with other householdsContainmentEmptying of on-site storage facilitiesTreatment and disposal of excreta from on-site storage facilitiesWastewater transported to treatmentWastewater treated888888991010101010111111111212122.5 Data cleaning and adjustment122.6 Data acceptance123. Producing estimates133.1 National, rural and urban estimates3.2 Primary indicatorsSpecial considerations3.3 RatiosSpecial considerations3.4 Secondary indicators: drinking waterData gaps3.5 Secondary indicators: sanitationData gaps1313151516161617173.6 Secondary indicators: hygiene183.7 Annual Rates of Change183.8 Wealth quintiles193.9 Subnational194. Country consultationJMP METHODOLOGY: 2017 UPDATE & SDG BASELINES202
5. Calculation of regional and global estimates5.1 Population data5.2 Imputations for countries lacking data212121Basic servicesSafely managed services2122JMP Country Files23AnnexCover photo credit: UNICEF/UN073039/PhelpsJMP METHODOLOGY: 2017 UPDATE & SDG BASELINES3
SummaryThe WHO/UNICEF Joint Monitoring Programme for WaterSupply, Sanitation and Hygiene (JMP) was established in1990 and has continuously refined the methods used forglobal monitoring. This document describes the methodsand rules applied in the last JMP report, “Progress ondrinking water, sanitation and hygiene: 2017 update andSDG baselines”1. These methods supersede those used inprevious JMP reports.2345The JMP produces estimates for a total of 26 indicatorsrelated to water, sanitation and hygiene. Estimates areproduced at the country, regional, and the global levels.All estimates are expressed as the proportion of thepopulation which uses a specific type of water, sanitation,or hygiene technology or level of service.Table 1: 26 indicators produced by the JMPWaterW1improved drinking water sourcesW2piped improved drinking water sourcesW3non-piped improved drinking water sourcesW4unimproved drinking water sourcesW5no drinking water facility (surface water)W6improved water sources exceeding 30 minutes collection time (limited drinking water services)W7improved water sources not exceeding 30 minutes collection time (basic drinking water services2)W8improved water sources which are accessible on premisesW9improved water sources which are available when neededW10improved water sources which are free from contaminationW11safely managed drinking water services3SanitationThe proportion of the population that uses.S1improved sanitation facilitiesS2improved sanitation facilities connected to sewersS3improved sanitation facilties connected to septic tanksS4improved pit latrines or other on-site improved facilitiesS5unimproved sanitation facilitiesS6no sanitation facility (open defecation4)S7improved sanitation facilities which are shared (limited sanitation services)S8improved sanitation facilities which are not shared (basic sanitation services2)S9sewer connections where wastes reach treatment plants and are treatedS10on-site sanitation facilities where wastes reach treatment plants and are treatedS11on-site sanitation facilities where wastes are disposed of in situS12safely managed sanitation services5Hygiene1The proportion of the population that uses.The proportion of the population that has.H1a handwashing facility on premisesH2a handwashing facility on premises with soap and water available (basic handwashing facility2,5)H3a handwashing facility on premises lacking soap and/or water (limited handwashing rt-final2 Indicator for SDG target 1.43 Indicator for SDG target 6.14 Additional indicator for SDG target 6.25 Indicator for SDG target 6.2JMP METHODOLOGY: 2017 UPDATE & SDG BASELINES4
Wherever possible, these estimates are disaggregatedby urban and rural location. The JMP is furthermoredeveloping a database of estimates which can also bedisaggregated by wealth quintile, sub-national regionand other relevant stratifiers of inequality. Many of thedatasets used for producing estimates are householdsurveys and censuses which collect water, sanitationand hygiene information at the household level. Suchdata cannot be disaggregated to provide informationon intra-household variability, e.g. differential use ofservices by gender, age, or disability. The JMP seeks tohighlight individual datasets which do allow assessmentof intra-household variability, but these are not numerousenough to integrate into the main indicators estimated inJMP reports.The production of estimates follows a consistent seriesof steps:1. Identification of appropriate national datasets2. Extraction of data from national datasets intoharmonized tables of data inputs3. Use of the data inputs to model country estimates4. Consultation with countries to review theestimates5. Aggregation of country estimates to create regionaland global estimatesThis document describes each of these steps in detail.Changes introduced in the 2017 UpdateThe statistical methods used in the 2017 Update differed from those used in the 2015 update and previousreports in a number of ways: Most obviously, the 2017 Update introduced the newindicators of safely managed drinking water services andsafely managed sanitation services, and developed newmethodologies for calculating these indicators. The 2017 Update further developed the methods used toestimate the handwashing with soap and water indicator.In the 2015 Update, estimates of handwashing for acountry were taken from a single household survey, andlimited to that year. In the 2017 Update, multiple surveyswere used (where available) and standard JMP regressionrules were used to produce estimates for multiple years. New definitions of basic and limited services wereintroduced, which build on the “use of improved facilities”indicators used in the MDG period. While the JMP methodcontinues to produce estimates of “use of improvedfacilities”, the bulk of the analysis is made on the new“basic services” indicators.XXBasic drinking water services are defined as drinkingwater from an improved source, provided collectiontime is not more than 30 minutes for a roundtripincluding queuing.XXLimited drinking water services are defined as drinkingwater from an improved source, where collection timeexceeds 30 minutes for a roundtrip including queuing.JMP METHODOLOGY: 2017 UPDATE & SDG BASELINESXXImproved water sources now include packaged anddelivered water, considering that both can potentiallydeliver safe water.XXBasic sanitation services are defined as use of improvedsanitation facilities which are not shared with otherhouseholds. This is identical to the “improved but notshared” category used in previous reports.XXLimited sanitation services are defined as use ofimproved sanitation facilities which are shared withother households. Previous reports used the term“shared but otherwise improved sanitation facilities”.XXImproved sanitation in the 2017 Update refers only tothe type of facility used, irrespective of whether thefacilities are shared by more than one household. In the2015 Update and earlier reports, improved sanitationwas defined to exclude shared facilities. Many new data sets were added for production of the2017 Update. However, statistical analysis was forthe most part limited to data sets from 2000 or later.Accordingly, estimates in the 2017 Update were onlyproduced for 2000-2015, where data permit. The JMP nolonger produces estimates for years prior to 2000. As for all JMP progress updates, estimates in the mostrecent 2017 report supersede estimates from all previousreports.5
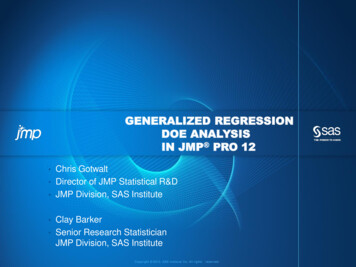
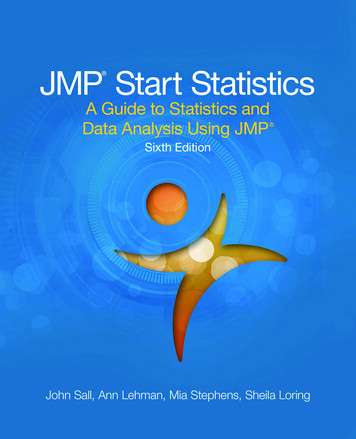
1.Identification of nationaldatasetsThe JMP has been reporting on water sanitation andhygiene since its inception in 1990 and has amasseda large database. Every 1-2 years, the JMP reviewsavailable national datasets, updates the global database,and publishes updated estimates. The data search islargely done by JMP staff members, systematicallyvisiting the websites of national statistical offices, andkey sector institutions such as ministries of water andsanitation, regulators of drinking water and sanitationservices, etc. Other regional and global databases are alsoreviewed for new datasets. UNICEF and WHO regionaland country offices are asked to help identify newlyavailable household surveys, censuses and administrativedatasets, including those submitted via UNICEF’sinternal CRING system (Country Reporting on Indicatorsand Goals).During the Millennium Development Goal (MDG) period,the JMP database included datasets going back to1990 and even earlier. For monitoring the SustainableDevelopment Goals (SDGs), the JMP will restrictanalysis to datasets from 2000 and later, with a fewexceptions in cases where it would be impossible togenerate an estimate without using an earlier datasetfrom 1990-2000. For the 2017 Update, pre-2000 datawere drawn upon from for three countries, areas orterritories.Datasets included in the JMP database include: Censuses, which in principle collect basic data from allpeople living within a country. Censuses are always ledby national statistical offices. Household surveys, which collect data from a subset ofhouseholds. These may target national, rural, or urbanpopulations, or more limited project or sub-nationalareas. An appropriate sample design is necessary forsurvey results to be representative, and surveys areoften led by or reviewed and approved by nationalstatistical organizations. Administrative data, may consist of information collectedby government or non-government entities involved inthe delivery or oversight of services. Examples includeTable 2: Datasets available and used in the JMP 2017 updateYearCensusesHousehold P METHODOLOGY: 2017 UPDATE & SDG BASELINES6
water and sanitation inventories and databases, andreports of regulators. Other datasets may be available such as compilations byinternational or regional initiatives (e.g. IB-NET), studiesconducted by research institutes, or technical advicereceived during country consultations.populations (e.g. the population using piped water suppliesor sewer connections). The JMP will include datasetsin its database when they represent at least 20% of thepopulation of interest. However, not all datasets in thedatabase are used in the production of estimates (seesection 2.6, Data Acceptance).Some datasets reviewed by the JMP are notrepresentative of national, rural or urban populations,or may be representative of only a subset of theseThe JMP database used to produce the 2017 updateincluded 3,653 datasets, of which 2,871 were used togenerate estimates (see Table 2).JMP METHODOLOGY: 2017 UPDATE & SDG BASELINES7
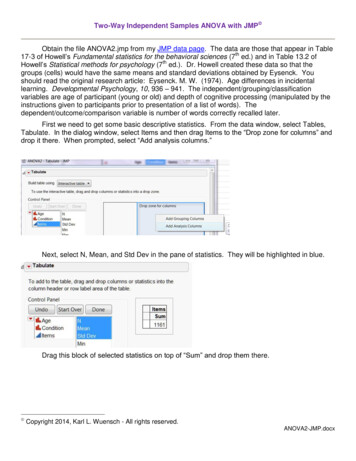
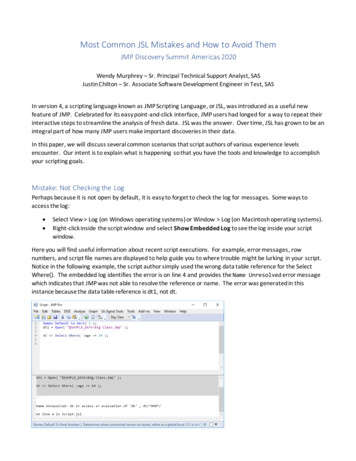
2.Data extraction, cleaning andpre-processingOnce datasets are identified, national data on water,sanitation and hygiene are extracted from the originalsources and recorded in standardized spreadsheets.Data from each country, area, or territory are recordedin individual spreadsheets (the JMP country files),with water, sanitation, and hygiene data recorded onseparate sheets (see Annex 1 for details). The JMPmaintains individual country files for each of the 232countries, areas, and territories which are included in theUN Population Division’s World Population Prospectstables (2015 revision). However, three of these entities(Caribbean Netherlands, Holy See, and Western Sahara)have no available data, and their country files are blank.Country files can be downloaded from the JMP website:www.washdata.org2.1Data compilationThe JMP compiles national data from a wide range ofdifferent data sources. Where possible, the JMP usesoriginal microdata to produce its own tabulations, whichare then transferred to the country files. However, in manycases microdata are not readily accessible so relevant dataare transcribed from reports available in different formats(PDFs, Word files, Excel spreadsheets, etc.).Year assignmentDatasets are assigned a single year in the JMP database,even when data collection and publication span severalyears. The year assigned to a dataset is the last year inwhich data collection was made. Thus a survey conductedfrom 1 October 2010 through 2 January 2011 would beassigned to 2011.Some panel surveys collect multiple rounds within a singleyear, or disaggregate findings temporally (e.g. by rainyand dry season). In this case, where possible, data willbe combined into a single set of statistics representingaverage values for the year.Geographic scopeThe JMP country files include data that are representativeof national populations, as well as data that arerepresentative of urban and rural populations. Wherepossible, data for all three domains are extracted butin some cases data are either unavailable or it is notJMP METHODOLOGY: 2017 UPDATE & SDG BASELINESpossible to disaggregate them for urban and rural areas.Data that are not representative of any of these domainsare generally not extracted into the country files (orare inserted into the country files but flagged as nonrepresentative and not used for generating estimates). TheJMP is currently developing methods for extracting datawhich are representative of sub-national regions and this isexpected to become a standard feature in coming years.WeightingIn order to produce statistics about the proportion ofthe population using a particular service, rather than theproportion of households having that service, the JMPuses population weights for household survey and censusdata. Where microdata do not include population weights,but do include household weights and the number of dejure household residents, these are multiplied together togenerate population weights which are subsequently usedin tabulations. Where microdata do not include populationweights, or where microdata are not available, the JMPwill use statistics that are based on household weighting.The JMP in most cases will not use data that do not haveeither household or population weights, or where dataare not tabulated for the proportion of the population, orhousehold/dwelling.2.2 Technology classificationsThe JMP uses a standard classification system tocategorise populations using different water, sanitationand hygiene technologies. Data extracted from datasetsare matched to the corresponding standard JMPclassifications. The JMP gives priority to data comingfrom population-based sources such as censuses andhousehold surveys which collect information directly fromhousehold members.Standard classifications: drinking waterDrinking water sources are classified into two hierarchicallevels based on technology. Where classification to thesecond level is not possible, classification is made tothe first level only. Each second-level classification isconsidered as either an “improved” or an “unimproved”drinking water source. The use of “improved” drinkingwater sources served as the main MDG indicator on8
drinking water, and forms the foundation of the new SDGindicators on drinking water.Table 4: Classification of sanitation technologiesTable 3: Classification of drinking water technologiesFlush toiletsFirst levelclassificationTap waterSecond levelclassificationPiped water into dwellingPiped water to yard/plotPublic tap, standpipeOtherGround waterTubewell, boreholeProtected wellProtected springUnprotected wellUnprotected springRainwaterCovered cistern/tankUncovered cistern/tankPackaged water* Bottled waterSachet waterDelivered water* Cart with small tank/drumTanker truck providedSurface waterRiverLakeDamPondStreamIrrigation channelOtherOther improvedOther unimprovedDK/MissingImproved UnimprovedXXXXXXXXXXXXXXXXXXXXXXXX*Packaged and delivered water were previously categorised asunimproved for MDG monitoringStandard classifications: sanitationSanitation facilities are classified into two hierarchicallevels based on technology. Where classification to thesecond level is not possible, classification is made to thefirst level. Each second-level classification is consideredas either an “improved” or an “unimproved” type ofsanitation facility.Standard classifications: handwashingThe new global SDG indicator for handwashing is theproportion of population with handwashing facilities withsoap and water at home. Handwashing facilities canconsist of a sink with tap water, but can also include otherdevices that contain, transport or regulate the flow ofwater. Buckets with taps, tippy-taps and portable basinsare all examples of handwashing facilities. Bar soap, liquidsoap, powder detergent and soapy water all count as soapfor monitoring purposes.JMP METHODOLOGY: 2017 UPDATE & SDG BASELINESFirst levelclassificationSecond levelclassificationto piped sewer systemto septic tankto pitto unknown place/notsure/DKto open drainto elsewherePour flush latrines to piped sewer systemto septic tankto pitto unknown place/notsure/DKto elsewhereDry latrinesVentilated Improved PitlatrineComposting toiletsPit latrine with slabPit latrine without slab/open pitHanging toilet/hanginglatrineBucket latrineNo facilityBush, fieldOtherOther improvedOther unimprovedDK/MissingImproved UnimprovedXXXXXXXXXXXXXXXXXXXXXPeople living in households that have a handwashingfacility with soap and water available on premises areclassified as having basic facilities. Households that havea handwashing facility but lack water and/or soap areclassified as having limited facilities. In some cultures,ash, soil, sand or other materials are used as handwashingagents, but these are less effective than soap and aretherefore counted as limited handwashing facilities.The JMP uses data from household surveys in whichthe enumerator observes the handwashing facilityand confirms the presence or absence of soap andwater. Datasets that include self-reported availability ofhandwashing facilities, soap and water may be included inthe JMP database and country files, but in most cases arenot used for making estimates.In some parts of the world (notably Central America)households sometimes do not give permission forsurvey enumerators to enter the premises and observehandwashing facilities. These households are excludedfrom calculations of the proportion of households havinghandwashing facilities.9
2.3 Service level classifications: waterAdditional datasets are used to calculate the proportionof households that use improved drinking water sourceswhich meet different service level criteria. Theseproportions are expressed as ratios (see Section 3.3).The service level criteria derive from the human right tosafe drinking water and include accessibility (within 30minutes, on premises), availability when needed, andquality. Service level information may come either throughpopulation-based or administrative datasets or othernational data sources.Within 30 minutesMany household surveys and some censuses collectdata on the amount of time that is typically required tocollect water. Ideally, the survey question should specifythe amount of time that is required for each round trip(i.e. to get from the dwelling to the water collection point,queue for water, fill containers and return to the dwelling).Time spent socializing (outside of queuing) should not beincluded in the total number of minutes.Most surveys record the number of minutes reported asa number, but others record ranges (e.g. 0-30 minutes).When a number is recorded, households using improvedsources and reporting collection times ranging from 0 to30 minutes (inclusive) are classified as having a drinkingwater source within 30 minutes. When ranges arereported, all ranges having an upper limit of 30 minutes orless are counted.If surveys record the time for a one-way trip to a watersource, this number is multiplied by two. If one-way traveltime is recorded as a range, the JMP uses ranges with anupper limit of 15 minutes.In countries with no information on time to collect but dataon the proportion of the population with a water sourcewithin a maximum distance (e.g. 250 meters) this hasbeen used as a proxy.On premisesA water supply is considered as being “on premises”when water is collected from a point located within thedwelling, plot or yard. Piped water is commonly availableon premises, but other water supply types may also belocated on premises.The JMP classifies households as having water supplieson premises when a survey collects information on thelocation of the water point, either as part of the responsecategory or as a standalone question. Additionally, insurveys that collect data on collection times, householdsreporting a collection time of zero minutes are classified ashaving water on premises.In countries where the majority of the population usespiped water supplies, data on location and collection timeare often not available. In such cases all piped water isconsidered to be located on premises, as well as 50% ofnon-piped improved water supplies.Available when neededThe human right to safe drinking water specifies that watershould be “available continuously and in a sufficient quantityto meet the requirements of drinking and personal hygiene,as well as of further personal and domestic uses, such ascooking and food preparation, dish and laundry washingand cleaning. [ ] Supply needs to be continuous enough toallow for the collection of sufficient amounts to satisfy allneeds, without compromising the quality of water.”6“Availability of water when needed” is complex and isdependent on the quantity of water needed, the quantityof water available, the continuity and reliability of supplies,the capacity for in-home storage. Where available, theJMP uses data from population-based sources anda variety of questions have been included in nationalhousehold surveys to date7. In cases where householdrespondents either report having access to sufficientwater when needed, or having water available at least50% of the time (i.e. at least 12 hours per day or 4 daysper week) then the JMP classifies them as having drinkingwater services which are available when needed.In the absence of data from population-based sources,data from administrative sources have also been used.Piped water systems that provide water for at least 12hours per day or 4 days per week are categorised by theJMP as “available when needed”, although it is recognizedthat this may fall short of full realization of the human right.Free from contaminationFor global monitoring purposes “free from contamination”requires that drinking water should meet microbiologicaland priority chemical water quality standards. Themicrobiological standard applied is that no E. coli shouldbe detected in a 100 mL sample. Thermotolerant coliformcounts are another commonly used faecal indicator, andare considered as an acceptable alternative to E. coli 8.Total coliforms are not considered as suitable indicatorsof faecal contamination, but can be used as indicatorsof treatment efficiency. If countries have data on totalcoliform levels in drinking water but not E. coli or6 United Nations General Assembly, Report of the independent expert on the issue of human rights obligations related to access to safe drinking water and sanitation, Catarina de Albuquerque on 1 July 2010: A/HRC/15/31/Add.1’, http://daccess-ods.un.org/access.nsf/Get?Open&DS A/HRC/15/31/Add.1&Lang E 7 For examples see JMP Thematic Report on Safely Managed Drinking Water Services https://washdata.org/report/jmp-2017-tr-smdw 8Guidelines for Drinking Water Quality (4th edition), WHO, Geneva, 2011.JMP METHODOLOGY: 2017 UPDATE & SDG BASELINES10
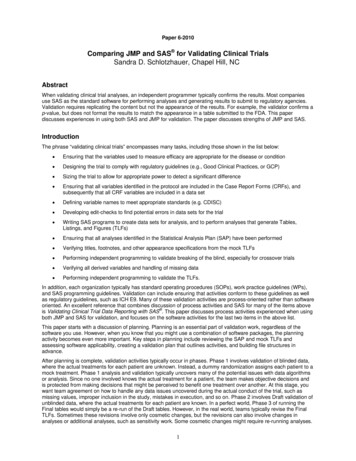
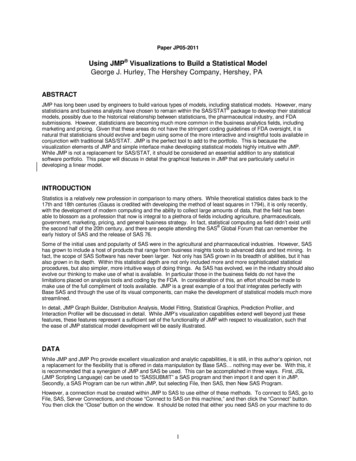
thermotolerant coliform data, the JMP uses compliancewith total coliforms, although this is a more stringentindicator. Data on compliance with residual chlorinestandards, while valuable for operational monitoringand surveillance, are not considered by the JMP asdemonstrating compliance with microbiological standards.These stages are followed separately for wastes flushedinto sewer networks, and for wastes stored in on-sitefacilities such as septic tanks and pit latrines9.At the global level, the priority chemical contaminants arearsenic and fluoride. The JMP collects data on compliancewith relevant national standards, and where possible usescompliance with the WHO guideline values (10 µg/L and1.5 mg/L, respectively).Ideally the points at which water supplies are tested forcompliance should be the location where users collectwater, however in some cases water quality samplesare collected at other locations, for example within thedistribution network of a piped supply. The JMP prefersto use water quality surveillance data that are collectedregularly throughout the year and cover the entirepopulation of interest. A one-time collection of data froma representative sample of the population, such as waterquality testing through household surveys, can also beused, recognising that such data only provide a "snapshot"in time and may therefore under-estimate the proportionof supplies that are contaminated.Frequently water quality data are available only for formalsupplies, or only for piped supplies. Such data are appliedtowards the entire population using improved supplies(in urban and/or rural areas) as long as the population towhich the data relate is at least 80% of the population ofinterest (e.g. the population reporting use of piped water).In countries where information is available formicrobiological contamination as well as for arsenic and/orfluoride, the microbiological and chemical data may comefrom difference sources. Therefore, it may be possibleto state the percentage of population with supplies thatare free from E. coli, or free from arsenic, or free fromfluoride, but it may not be possible to state the percentageof population with supplies that are free from E. coli,arsenic and fluoride. To ensure comparability in suchcases, the minimum value of the available parameters (i.e.supplies free from E. coli, or arsenic, or fluoride) will beused. However, no estimate will be made in the absenceof data on microbiological compliance.2.4 Service level classifications: sanitationThe definition of “safely managed sanitation services” isinformed by the excreta flow diagram concept, in whichfaecal wastes from different types of sanitation facilitiesare tracked through stages of containment, emptying,transport, treatment, and reuse or final disposal (Fig. 1).Figure 1: Excreta flow diagram10Not shared with other householdsMany household surveys ask respondents if the sanitationfacility used by members of the household is sharedwith other households. Public toilets, as well as privatelyowned sanitation facilities which are shared by two ormore families, are classified as shared facilities.ContainmentContainment refers to the extent to which the sanitationfacilities which people use ensure that excreta aresafely separated from human contact at the householdand community level. In cases where data exist onthe proportion of people using improved sanitationsystems which do not effectively contain faeces, (e.g.sewer lines, latrines or septic tanks that leak faeces intothe environment) the JMP adjusts estimates of safelymanaged sanitation accordingly.Emptying of on-site storage facilitiesThe JMP seeks data on the proportion of people using onsite sanitation storage facilities (septic tanks or latrines) whichhave ever been emptied. These data may come either frompopulation-based data sources such as household surveys,or from administrative records. Information on the time sincemost recent emptying, the way excreta were emptied, orthe use of protective equipment to prevent occupationalexposures during emptying may be collected from suchdatasets but have not been used in calculating estimates.Treatment and disposal of excreta from on-sitestorage facilitiesThis refers to the proportion of excreta emptied from onsite storage facilities (septic tanks or latrine pits) whichare either buried on premises or transported, usually bycart, truck or tanker, and delivered to treatment plants9For further information see forthcoming JMP Thematic Report on Safely Managed Sanitation Services and rtJMP METHODOLOGY: 2017 UPDATE & SDG BASELINES11
(regardless of the type of treatment plant) or dischargedinto sewer networks. Some household surveys andadministrative sources collect information on thefrequency and method of emptying on-site sanitationsystems and whether excreta are delivered to treatment orunsafely discharged.Excreta from on-site sanitation facilities may be transportedto wastewater treatment plants or to specially designedfaecal sludge treatment plants. Excreta delivered towastewater treatment plants providing at least secondarytreatment are classified as safely managed. Excreta deliveredto faecal sludge treatment plants are classified as safelymanaged if both the liquid and solid fractions are treated.For the 2017 Update, data on treatment of excreta removedfrom on-site sanitation facilities were only available for twocountries: Japan and Norway.W
2017 Update. However, statistical analysis was for the most part limited to data sets from 2000 or later. Accordingly, estimates in the 2017 Update were only produced for 2000-2015, where data permit. The JMP no longer produces estimates for years prior to 2000. As for all JMP progress updates, estimates in the most