Transcription
CONS UMER FINANCIAL P ROTECTION BUREAU MARCH 2022Credit card late fees
Table of contentsTable of contents * .1Executive Summary .21.Introduction .32.Consumer impact .63.Market reliance .134.Conclusion.16*1Report prepared by Joanna Cohen, Lucas Nathe, László Sándor, Margaret Seikel, and Wei Zhang.CONSUMER FINANCIAL PROTECTION BUREAU
Executive SummaryPrior to the COVID-19 pandemic, consumers had steadily been paying more in credit card latefees each year—peaking at over 14 billion in 2019. Late fees assessed by issuers declined toabout 12 billion in 2020 given record-high payment rates and public and private relief efforts.Even during the pandemic, late fees accounted for over one-tenth of the 120 billion consumerspay in credit card interest and fees annually. In 2021, total late fee volume was on the rise again.CONS UMER I MPACT OF CRE DI T CARD LATE FEESIn 2019, a consumer with a major issuer’s credit card was charged a 26 late fee on average foreach late payment—except for each subsequent late fee within six billing cycles of an earlier latepayment. For those, the average fee rose to over 34. Cardholders with subprime and deepsubprime scores are far more likely to incur repeat late fees in a given year than those in highercredit score tiers. Increased incidence coupled with a more expensive fee for repeat late paymentresulted in the average deep subprime account being charged 138 in late fees in 2019,compared with 11 for the average superprime account.Credit card late fees disproportionately burden consumers in low-income and majority-Blackneighborhoods. Late fees are negatively correlated with indicators of upward economic mobility.Furthermore, these penalty fees can represent a surcharge of 24 percent annualized on top ofassessed interest on unpaid balances—one of multiple financial consequences of a missedpayment.MARKE T RE LIANCE ON CRE DIT CARD LATE FEESLate fees account for 99 percent of penalty fees and over half of the credit card market’s totalconsumer fees. While the degree to which companies rely on late payment for revenue varies,late fees represent a larger share of charges for issuers primarily serving consumers with lowercredit scores than for issuers that extend little to no credit to such consumers.Most smaller banks and credit unions charge a maximum late fee of 25 or less, but almost all ofthe largest credit card issuers contract at or near the higher fee amounts that are specified byregulation. A small but increasing percentage of companies charge no late fees or offer productswith increased flexibility for late payments. Yet, the overall credit card market continues to relyon late fees disproportionately paid by economically vulnerable consumers.2CONSUMER FINANCIAL PROTECTION BUREAU
1. IntroductionWhen a consumer does not make at least their minimum payment by a statement due date, acredit card issuer typically assesses a late fee. 1 These penalties represent both a substantialfinancial burden for consumers and a major source of revenue for companies.ME THODOLOGYThis report leverages three major data sources to explore both the consumer impact of andindustry reliance on credit card late fees:1. De-identified information that the Federal Reserve Board (Board) collects as part of its“Y-14M” (Y-14) data collection: the Board collects these account-level data monthly frombank holding companies that have total consolidated assets exceeding 50 billion. 2 Thissample accounted for just under 70 percent of outstanding balances on consumer creditcards as of year-end 2020. 32. Data provided in response to a series of data filing orders from a diverse group ofspecialized issuers: these summary data allow for a broader or more detailed perspectiveinto certain facets of the market and, where these data supplement Y-14 data, arecollectively called “Y-14 .”3. The CFPB’s Credit Card Agreement Database: this is an online database available to thepublic that contains most credit card agreements available to consumers. 41A minimum payment is the minimum dollar amount that must be paid each month on a credit card. CFPBpreviously found that minimum payment formulae varied widely across issuers, both in terms of the amount of thepayment itself as well as the complexity in its calculation and description. See CFPB, The Consumer Credit CardMarket, at 130 to 132 (Dec. 2015) (2015 Report), http://files.consumerfinance.gov/f/201512 cfpb report-theconsumer-credit-card-market.pdf. A credit card late fee cannot exceed the value of the minimum payment. 12 C.F.R.§ 1026.52(b)(2)(i)(A); Comment 52(b)(2)(i)-1.2See Bd. of Governors. of the Fed. Rsrv. Sys., Report Forms FR rms/reportdetail.aspx?sOoYJ 5BzDYnbIw U9pk a3sMtCMopzoV(last visited Jan. 11, 2022) (for more information on the Y-14M collection).3This study reports only aggregate measures and reveals no information about any specific issuer. These issuersrepresent a large portion of the market but are not necessarily representative of the portion of the market notcovered by the data the Bureau receives. Results reported from Y-14 data throughout this report should beinterpreted accordingly. See CFPB, The Consumer Credit Card Market, 16 (Sep. 2021) (2021 nts/cfpb consumer-credit-card-market-report 2021.pdf.4CFPB, Credit Card Agreement Database (Database), ents.Agreements in 2020 and 2021 may include omissions due to the Bureau’s previous COVID-19 regulatory flexibilitystatement; see CFPB, Statement on Supervisory and Enforcement Practices Regarding Bureau InformationCollections for Credit Card and Prepaid Account Issuers (Mar. 26, s/cfpb data-collection-statement covid-19 2020-03.pdf.3CONSUMER FINANCIAL PROTECTION BUREAU
DE FI NITIONSThe Credit Card Accountability, Responsibility, and Disclosure Act of 2009 (“CARD Act”)required late fees be “reasonable and proportional” and the implementing regulation(Regulation Z) sets a “safe harbor” for specific fee amounts, which the CFPB adjusts for inflationannually. 5 The implementing regulation initially established a safe harbor of 25 for a first latepayment and 35 for each subsequent violation within the next six billing cycles. Repeat latefees are defined as any late fee within six billing cycles of an earlier late fee; first-time late feesare instances that are not repeat fees.Y-14 and Y-14 data include commercially-available credit scores which are then grouped intofive tiers: superprime (720 or greater), prime (660 to 719), near-prime (620 to 659), subprime(580 to 619), and deep subprime (579 or less). 6References to “COVID-19” or “pandemic” are used as shorthand for the period of economic crisisand broad social disruption beginning in 2020. As of this report writing, it remains too soon todetermine the effects of the pandemic on consumer behavior. As such, after discussing unusualtrends in the overall late fee landscape in this section, this report primarily focuses on 2019 data.LATE FEE LANDSCAPELate fees represent over one-tenth of the consumer cost of credit paid to issuers in interest andfees. This has been true since at least 2015 and remained true in 2020 despite a year-over-yeardecline in the total volume of late fees. 7TABLE 1:TOTAL COST OF CREDIT CARDS TO CONSUMERS (Y-14 )YEARLATE FEESTOTAL INTEREST AND FEESLATE FEES SHARE2018 13 B 119 B11%2019 14 B 128 B11%2020 12 B 117 B10%515 U.S.C. § 1665d(a) (2012); 12 C.F.R. § 1026.52(b). Regulation Z requires the Bureau to annually adjust the safeharbors to reflect changes in the Consumer Price Index. 12 C.F.R. § 1026.52(b)(1)(ii)(D).6A little more than half of (credit visible) Americans were in the superprime segment by the end of 2019. A sixth weredeep subprime or prime each, and around 7% were in both the subprime and the near subprime categories.7Y-14 4CONSUMER FINANCIAL PROTECTION BUREAU
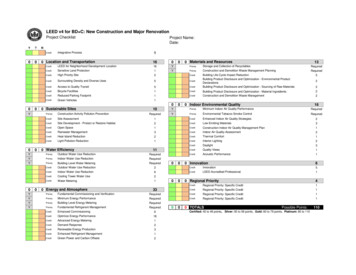
Monthly late fee volume in May 2020 plummeted over 33 percent from its January high, inparallel with the unprecedented decline in credit card debt from Q4 2019 to Q2 2020. 8Economic Impact Payments (EIPs) coincided with the initial decline in late fees across all creditscore tiers, as did the initial issuance of industry fee waivers. 9 However, late fee volume did nothit its lowest point in recent years until April 2021, in conjunction with the distribution of thethird EIP, after most issuers’ COVID-19 relief programs ended. 10FIGURE 1:INDEXED MONTHLY LATE FEE VOLUME BY CREDIT SCORE TIER (Y-14) 11140120100806040Mar 2017Mar 2018SuperprimeSubprimeMar 2019Mar 2020PrimeDeep subprimeMar 2021Near-primeOverallThe decline in overall late fee volume in early 2021 was largely driven by a steep decline amongaccounts with below-prime scores. Between February 2020 and April 2021 late fee volume foraccounts associated with deep subprime and subprime scores fell 59 percent and 49 percentrespectively, whereas late fee volume for prime and superprime accounts fell by 30 percent and23 percent. This pattern suggests that changes in payment behavior for consumers with lowercredit scores explain much of the significant reduction in late fee volume. 12 However, from thistrough in April to the most recent data from October 2021, late fee volume rose for all creditscore tiers. 138 See92021 Report at 27, supra note 3.See 2021 Report, supra note 3.10IRS, Third Economic Impact Payment, act-payment (lastaccessed Feb. 14, 2022). See also 2021 Report, Section 5.5, supra note 3.11Indexed to late fee vol12See 2021 Report, supra note 3, at Sections 2 and 3 for more information on payment rates during 2020.13See 2021 Report at 19, supra note 3.5CONSUMER FINANCIAL PROTECTION BUREAU
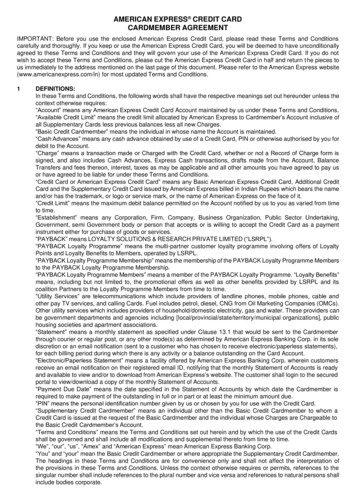
2. Consumer impactThe burden of late fees varies across the United States. In 2019, the average late fee in the creditcard market was 31, but this value differs by card type, credit score, location, and income. 14Notably, the cost of late fees to impacted consumers is higher than the estimations below, as thissection analyzes late fees per account, not per person. 15LATE FEES BY CARD TYPE AND CREDIT S COREFor both general purpose and private label credit card accounts issued by major banks, repeatlate fees are higher than first-time late fees. 16 In 2019, first-time late fees for general purposecards averaged 26, while repeat fees were 36 percent higher at 35 on average. Private labelcards had a slightly higher average first-time late fee of 27 while repeat fees were 28 percenthigher, averaging 34. As of 2019, the safe harbor values were 28 and 39, respectively. 17FIGURE 2:AVERAGE FIRST-TIME AND REPEAT LATE FEE BY CARD TYPE IN 2019 (Y-14) 35 35 30 25 34 27 26 20 15 10 5 0General purposePrivate labelFirst timeRepeatA small share of accounts in low credit score tiers incur a high proportion of late fees. Subprimeand deep subprime accounts incurred 42 percent of all late fees in 2019 even though only 121415See 2021 Report, supra note 3, at 55.For the share of consumers with at least one credit card, the average number of accounts held is between 2 and 5,depending on credit score tier. See CFPB, The Consumer Credit Card Market, at 35 (Aug. 2019) (2019 nts/cfpb consumer-credit-card-market-report 2019.pdf.Additionally, some analyses in this section likely underestimate the burden of late fees for accounts with belowprime scores, as Y-14 data do not include tradelines from subprime specialist issuers with a higher average late feeof 32 in Y-14 .16This report generally refers to “general purpose credit cards” that can transact over a network accepted by a widevariety of merchants and “private label credit cards” that can only be used at one or few specific merchants.17612 C.F.R. § 1026.52(b)(1)(ii); Comment 52(b)(1)(ii)-2.i.H; 83 FR 43503 (Aug. 27, 2018).CONSUMER FINANCIAL PROTECTION BUREAU
percent of accounts fell into those categories. Meanwhile, the 59 percent of accounts that areconsidered superprime incurred only 20 percent of the total late fee volume.FIGURE 3:SHARE OF ACCOUNTS AND SHARE OF LATE FEE VOLUME IN 2019 (Y-14 )59%60%40%20%27%20% 21%20%10%0%SuperprimePrime17%15%Near-primeShare of accounts6%6%SubprimeDeep subprimeShare of late fee volumeAccounts in lower credit tiers are significantly more likely to be charged multiple late fees in ayear than accounts in higher tiers. In 2019, 48 percent of deep subprime and 28 percent ofsubprime accounts were charged three or more late fees, compared with only 3 percent ofsuperprime accounts. Conversely, superprime accounts were far more likely to incur no latefees: 85 percent of superprime accounts were charged no late fees in 2019, compared with only30 percent of deep subprime accounts.FIGURE 4:SHARE OF LATE FEE INCIDENCE BY CREDIT SCORE TIER IN 2019 47Deep subprime0%10%1120%30%None40%911150%111910153073 3284860%270%3 80%90%100%Both late fees and interest incurred in 2019 as a share of cycle ending balances increase as creditscores decrease. However, the rise of total annual late fees as a share of balances from aboveprime to below-prime credit score tiers was much higher than that of interest. The average deepsubprime account incurred late fees averaging 11 percent of balances on top of annual interest7CONSUMER FINANCIAL PROTECTION BUREAU
equaling 21 percent of balances. By contrast, late fees for superprime and prime accounts eachaveraged 0.8 percent and 1.3 percent of balances, while the incurred interest in 2019 averaged10 percent and 17 percent of balances accordingly.FIGURE 5:AVERAGE ANNUAL LATE FEE VOLUME AND INTEREST AS A SHARE OF AVERAGE CYCLEENDING BALANCES BY CREDIT SCORE TIER IN 2019 (Y-14 eLate fees3%Near-prime6%SubprimeDeep subprimeInterestLate fees are in addition to the finance charges incurred for carrying a balance. Around half oflate fees in the superprime segment in 2019 were assessed to customers who were not rollingover their balances in the month before or after. 18 Inasmuch as their late fee was unexpected or acostly mistake to pay for using the cards, the coinciding finance charge is a similar burden. Inthe subprime or deep subprime segments, almost all late fees are incurred by regularly revolvingcustomers who missed a payment. 19 For them, a finance charge will be owed in any case and themain financial consequence of a missed payment is the late fee.Overall, the average deep subprime account was charged 138 in late fees in 2019, comparedwith 11 for the average superprime account. 20 The higher incidence of late fees for accounts inlower tiers, combined with higher average charges for repeat fees, drives this disparity. Notably,these figures alone underplay the significant burden of late fees for consumers, as this sectionexamines average late fees per account, not per person. Cardholders in the deep subprime scoretier hold, on average, at least two credit cards. 21 If a typical consumer with a deep subprime18 Y-14.19Y-14.20Y-14 .21See 2019 Report, supra note 15, at 35.8CONSUMER FINANCIAL PROTECTION BUREAU
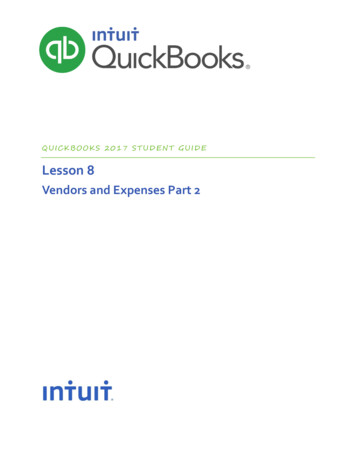
score incurred the average late fee charges on each card, they would have incurred about 300in late fees by the end of the year.LATE FEES BY GE OGRAPHYIn some states, the average credit card accumulated almost 30 in total late fees in 2019, whilein others the average was below 20. Consumers in southern states pay more in average late feesper account. This can stem from a higher share of accounts paying any late fees in a given monthor a greater number of accounts incurring higher repeat late fees. 22FIGURE 6:AVERAGE LATE FEES PER ACCOUNT IN 2019 (Y-14)In 2019 credit card accounts held by consumers living in the United States’ poorestneighborhoods paid twice as much on average in total late fees than those in the richest areas.Yet, cardholders in ZIP codes with the highest income per adult still paid 14 on average in totallate fees in 2019 on each credit card they had open. 2322Correlations presented in this section may be affected by underlying credit score variation by geography.23ZIP-level aggregates on total incomes and number of individuals come from the Statistics of Income of the InternalRevenue Service. Our chart groups ZIP codes into 35 equal-sized bins (having the same number of accounts in theY-14) and plots each bin’s average total amount of late fees per account against the bin’s average income. The linesimply connects these 35 dots, helping with interpolation.9CONSUMER FINANCIAL PROTECTION BUREAU
FIGURE 7:AVERAGE LATE FEE AND PER CAPITA INCOME IN 2019 (Y-14, IRS)Late fee per account 35 30 25 20 15 10 5 0 0 20K 40K 60K 80K 100KLocal annual income per adult 120K 140K 160KWhen we link the ZIP code of a cardholder’s residence to census tracts, we find other signs of theunequal burden of late fees. Cardholders in tracts where a majority identified themselves asBlack in the 2010 census paid more than 25 in total late fees for each account they held withmajor issuers in 2019. 24 Yet it is also notable that the relationship is U-shaped, as cardholders inareas where a small but non-zero share of the population identified as Black paid the least inaverage late fees, less than 20.FIGURE 8:AVERAGE LATE FEE IN 2019 AND SHARE OF POPULATION IDENTIFYING AS BLACK (Y-14,CENSUS)Late fee per account 30 25 20 15 10 5 00%10%20%30%40%50%60%70%Share of local population identifying as Black2480%90%100%Our chart groups the census tracts into 42 equal-sized bins (in terms of number of trade lines in the Y-14) and plotseach bin’s average total amount of late fees per account in 2019 against the bin’s average Black share. The linemerely connects these dots to help with interpolation.10CONSUMER FINANCIAL PROTECTION BUREAU
Disparities in late fees are also related to broader measures of neighborhood functioning andeconomic mobility. In some neighborhoods, more than 30 percent of children born in the early1980s to poor parents (at the 25th percentile of their generation’s income distribution) made it tothe top 20 percent of their own generation by the mid-2010s; cardholders in these areas paid 16 to 17 dollars in average late fees per credit card in 2019. In areas where only five percent ofsimilarly poor children rose to the top 20 percent, average late fees per account were more than 25 per credit card in 2019, indicating lower credit card late fees in locations that foster goodoutcomes for children. 25FIGURE 9:AVERAGE LATE FEE IN 2019 AND INTERGENERATIONAL MOBILITY (Y-14, OPPORTUNITYINSIGHTS)Late fee per account 30 25 20 15 10 5 00%5%10%15%20%25%30%35%40%Share of local children born into 25th percentile reaching the top quintileAs consumers in poorer areas tend to carry smaller balances when they are late on a payment,the late fee they pay on top of a finance charge is typically a larger cost relative to their averagedaily balance. 26 Consumers in the richest areas pay considerably less than one percentage pointmore for this form of credit during months in which they incur a late fee (amounting to 8.525Our chart grouped census tracts into 41 equal-sized bins (in terms of number of accounts in the Y-14) and plots thebin’s average total amount of late fees per account against the bin’s average mobility measure. The line merelyconnects these dots and is supposed to help with visual interpolation. Income ranks for parents and children areboth in terms of household income as observed in IRS tax records. For details on the definition and measurement ofthe mobility measure, see Chetty et al., “The Opportunity Atlas: Mapping the Childhood Roots of Social Mobility,”(Jan. 2020), /2018/10/atlas paper.pdf.26Finance charges are proportional to the average daily balance in the previous cycle, with the annualized APRdetermining the ratio of the charge to the balance. Late fees are fixed amounts but could be expressed in similarratios, comparing this additional cost of credit to the APR. The issuer here is arguably lending the minimumpayment to cardholders who would have revolved the rest of their balance anyway or they are lending the entirebalance to would-be transactors who pay late. For more information on annual late fee volume and interest as apercentage of cycle ending balances by credit score tier, see supra Figure 5.11CONSUMER FINANCIAL PROTECTION BUREAU
percent in APR terms, which are annualized), while consumers in poor areas pay close to twopercent extra during these months, or 24 percent annualized. 27Late fee as a share of balanceFIGURE 10:LATE FEE SHARE OF AVERAGE DAILY BALANCE, BY PER CAPITA INCOME, IN 2019 (Y-14, IRS)2.0%1.5%1.0%0.5%0.0% 0 50K 100KLocal annual income per adult27 150K 200KOur chart bins ZIP codes into 80 equal-sized bins (in terms of number of trade lines in the Y-14) and plots eachbin’s weighted average of the ratio of the total amount of late fees over balances per account against the bin’saverage total income per adult. The line merely connects these dots to help with visual interpolation. ZIP-levelaggregates on total incomes and number of individuals come from the Statistics of Income of the Internal RevenueService.12CONSUMER FINANCIAL PROTECTION BUREAU
3. Market relianceEven though late fees account for over 10 percent of total fees and interest collected annuallyindustry-wide, individual issuers’ revenue from credit card late fees varies. In the wake of theCARD Act, late fees represent 99 percent of penalty fee volume on credit cards, as overlimit feesare now practically nonexistent and fees for returned payments account for a negligible share. 28For general purpose cards, late fees represented 45 percent of total consumer fees assessed in2019 and seven percent of total interest and fees; 29 for private label cards in that same year, latefees made up the overwhelming majority—91 percent—of all consumer fees and 25 percent oftotal interest and fees. 30 Interchange fees paid by merchants are not included in the calculationof total consumer fees, although they may indirectly affect consumers.While private label and subprime specialist issuers represent a minority of accounts in the creditcard market, these issuers collect a disproportionate share of total late fee volume. Reliance onlate fees varies by the type of credit cards offered to consumers.FIGURE 11:60%SHARE OF ACCOUNTS AND SHARE OF LATE FEE VOLUME BY ISSUER TYPE IN 2019 (Y-14 ) 3163%46%43%40%33%20%4%0%General purpose mass marketShare of accountsPrivate label12%Subprime specialistShare of late fee volume28 Y-14 ; Credit Card Accountability Responsibility and Disclosure Act of 2009,Public Law 111-24, 123 Stat. 1734(2009); CFPB, The Consumer Credit Card Market, at 96 and 97 (Dec. 2017) (2017 nts/cfpb consumer-credit-card-market-report 2017.pdf.29Total consumer fees include late fees, overlimit fees, non-sufficient funds (NSF) fees, cash advance fees, annualfees, debt suspension fees, balance transfer fees, and other fees.3031See 2021 report, supra note 3, at 53.Y-14 data provided in response to a series of data filing orders from a diverse group of specialized issuerssupplement the Y-14 for general purpose and private label accounts. All subprime specialist data are from these datafiling orders and do not include accounts represented in the Y-14.13CONSUMER FINANCIAL PROTECTION BUREAU
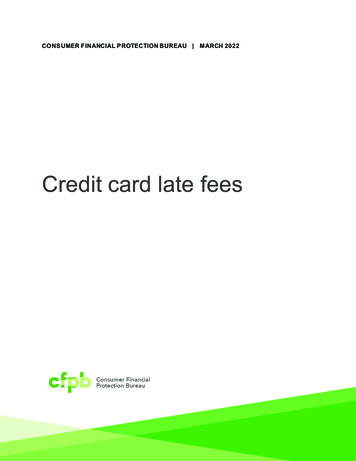
The share of late fees for individual issuers ranged from a minimum of four percent to amaximum of 31 percent of total consumer charges in 2019. Among issuers there is a strongcorrelation between reliance on late fees and concentration of subprime accounts. Late feesaccount for a greater share of charges for issuers who service a higher percentage of subprimeaccounts at almost 20 percent of total interest and fees. Conversely, late fees account for asmaller share of about seven percent of total interest and fees for issuers whose cardholdershave higher average credit scores. Yet, the industry as a whole continues to rely on late fees as asource of revenue.TABLE 2:DISTRIBUTION OF ISSUERS IN Y-14 SAMPLE BY SUBPRIME CONCENTRATION AND LATE FEECHARGES (Y-14 ) 32BELOW AVERAGE SHARE OFABOVE AVERAGE SHARE OFSUBPRIME ACCOUNTSSUBPRIME ACCOUNTSBELOW AVERAGE SHARE OFLATE FEE CHARGESABOVE AVERAGE SHARE OFLATE FEE CHARGES56%6%0%38%All but two of the top 20 issuers by outstanding balances contracted a maximum late fee at ornear the safe harbor amount of 40 in 2020. 33 However, the most common maximum late feecharged in agreements submitted to the CFPB was 25, as driven by the practices of smallerbanks and credit unions not in the top 20 issuers by asset size. 3432Average share of late fee charges is 10 percent of total interest and fees. Average share of subprime accounts is 10percent of total accounts.33This analysis only represents the maximum late fee found in all agreement submissions by a given issuer. Due tolimitations with the credit card agreement database, the CFPB cannot report what percentage of products orconsumers are covered by the late fee provisions submitted by a given issuer. Additionally, as many issuers employlanguage in their agreements listing that fees for late payments are “up to” a given value, this analysis does notexplore variation in the first-time late fee. For listings of top credit card issuers by credit card loans, see Rica DelaCruz and Ronamil Portes, “Banks see credit card loans rise YOY in Q3 as spending further accelerates,” S&P GlobalMark et Intelligence (Nov. 2021), erates-67760858.34This analysis does not capture variation in issuer penalty pricing for first-time late payment and excludes practiceswhere an issuer may choose to waive a late fee for a given consumer. See e.g., Discover, “Discover Launches GameChanging New ‘It’ Credit Card” (Jan. 2013), px.14CONSUMER FINANCIAL PROTECTION BUREAU
FIGURE 12:MAXIMUM LATE FEES IN CREDIT CARD AGREEMENTS BY ISSUER TYPE IN Q4 2020 (QCCA)2322001501005008 0- 53042547480462 6- 10 11- 15 16- 20 21- 25 26- 30 31- 35 36- 40 Over 40Banks (excluding top 20 issuers)Credit unionsTop 20 issuersA handful of issuers currently offer credit card products with no late fees. For example, Citibankhas offered the Citi Simplicity card since 2011. 35 A newer entrant, the Petal 2 “Cash Back, NoFees” card, first issued in 2018, does not charge late fees and is marketed to consumers with noor limited credit. 36 Starting in 2019, consumers with an iPhone could apply for the no-fee Applecard, issued by Goldman Sachs, and many did. 37 As of 2020, the product had over six-millionusers, and Goldman Sachs’ credit card loans exceeded 6 billion in Q3 2021. 38 Together, theseexamples may indicate a small but growing trend towards issuers offering products with no orlimited fees for late payment; yet, credit cards without late fees remain the exception, not therule.35Citigroup, “Citi Simplicity Says Goodbye to Frustration of Late Fees in New Advertising Campaign” (May 514a.htm#: :text Fees.36Petal, “Petal 2,” https://www.petalcard.com/petal-2 (last accessed Feb. 2022); PYMNTS, “Petal Debuts No-FeeCredit Card for Underserved” (Oct. 2018), etal-no-feecredit-card-startup/.37Apple, “Introducing Apple Card, a new k ind of credit card created by Apple” (Mar. ducing-apple-card-a-new-k ind-of-credit-card-created-by-apple/.38 Ron Shevlin, “Apple Card Grows to 6.4Million Cardholders Thanks to Women,” Forbes (May thanks-towomen/?sh 1131c55b2f57; Dela Cruz and Portes, supra note 33.15CONSUMER FINANCIAL PROTECTION BUREAU
4. ConclusionThis report shows the credit card market continues to rely on late fees that negatively affectmillions of consumers. For some households, late fees are a costly mistake for payments thatmay only be a day or two late; for others, they are a significant added hardship during a time offinancial precarity. For credit card companies, especially private label and subprime specialistissuers, late fees continue to bolster their bottom line.During the pandemic, many families received a temporary reprieve from the burden of creditcard late fees. Yet in spring 2022, as widespread public and private relief efforts have largelyended, late fee volume is on a path to return to 2019 levels. This report documents that most ofthe largest issuers set penalty fees at or near the maximum level eligible for safe harbortreatment under current regulation, a limit annually adjusted for inflation. As limits increase,late fees’ impact on consumers will likely remain substantial unless something
pay in credit card interest and fees annually. In 2021, total late fee volume was on the rise again. CONSUMER IMPACT OF CREDIT CARD LATE FEES . In 2019, a consumer with a major issuer's credit card was charged a 26 late fee on average for each late payment —except for each subsequent late fee within six billing cycles of an earlier late