Transcription
The correct bibliographic citation for this manual is as follows: John Sall, Ann Lehman, MiaStephens, and Sheila Loring. JMP Start Statistics: A Guide to Statistics and Data Analysis UsingJMP , Sixth Edition. Cary, NC: SAS Institute Inc.JMP Start Statistics: A Guide to Statistics and Data Analysis Using JMP , Sixth EditionCopyright 2017, SAS Institute Inc., Cary, NC, USAISBN 978-1-62960-875-4 (Hardcopy)ISBN 978-1-62960-876-1 (EPUB)ISBN 978-1-62960-877-8 (MOBI)ISBN 978-1-62960-878-5 (Web PDF)All rights reserved. Produced in the United States of America.For a hard-copy book: No part of this publication may be reproduced, stored in a retrievalsystem, or transmitted, in any form or by any means, electronic, mechanical, photocopying, orotherwise, without the prior written permission of the publisher, SAS Institute Inc.For a Web download or e-book: Your use of this publication shall be governed by the termsestablished by the vendor at the time you acquire this publication.The scanning, uploading, and distribution of this book via the Internet or any other meanswithout the permission of the publisher is illegal and punishable by law. Please purchase onlyauthorized electronic editions and do not participate in or encourage electronic piracy ofcopyrighted materials. Your support of others’ rights is appreciated.U.S. Government Restricted Rights Notice: The Software and its documentation iscommercial computer software developed at private expense and is provided withRESTRICTED RIGHTS to the United States Government. Use, duplication or disclosure of theSoftware by the United States Government is subject to the license terms of this Agreementpursuant to, as applicable, FAR 12.212, DFAR 227.7202-1(a), DFAR 227.7202-3(a) and DFAR227.7202-4 and, to the extent required under U.S. federal law, the minimum restricted rights asset out in FAR 52.227-19 (DEC 2007). If FAR 52.227-19 is applicable, this provision serves asnotice under clause (c) thereof and no other notice is required to be affixed to the Software ordocumentation. The Government’s rights in Software and documentation shall be only thoseset forth in this Agreement.SAS Institute Inc., SAS Campus Drive, Cary, North Carolina 27513-2414February 2017SAS and all other SAS Institute Inc. product or service names are registered trademarks ortrademarks of SAS Institute Inc. in the USA and other countries. indicates USA registration.Other brand and product names are trademarks of their respective companies.
SAS software may be provided with certain third-party software, including but notlimited to open-source software, which is licensed under its applicable third-partysoftware license agreement. For license information about third-party softwaredistributed with SAS software, refer to http://support.sas.com/thirdpartylicenses.
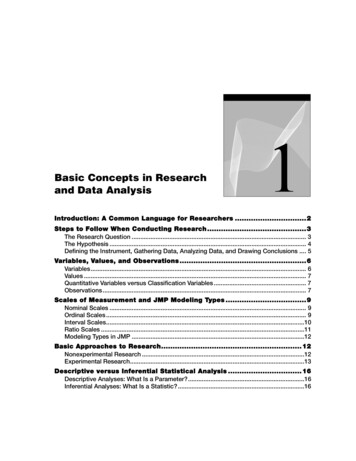
JMP Start Statistics: A Guide to Statistics and DataAnalysis Using JMP , Sixth Edition. Full book availablefor purchase here.PrefaceTable of ContentsxvThe Software xvHow to Get JMP xviJMP Start Statistics, Sixth EditionSAS xviiJMP versus JMP Pro xviiiThis Book xviii1Preliminariesxvii1What You Need to Know1 about statistics 1Learning about JMP1 on your own with JMP Help 1 hands-on examples 2 using Tutorials 2 reading about JMP 2Chapter Organization 3Typographical Conventions25Getting Started with JMPHello! 7First Session79Tip of the Day 9The JMP Starter (Macintosh) 9The JMP Home Window (Windows) 10Open a JMP Data Table 12Launch an Analysis Platform 14Interact with the Report Surface 15Special Tools 18Customize JMP 19Modeling Type 21Analyze and Graph 22Navigating Platforms and Building ContextContexts for a Histogram 2322
ivTable of ContentsContexts for the t-Test 23Contexts for a Scatterplot 24Contexts for Nonparametric StatisticsThe Personality of JMP32425Data Tables, Reports, and Scripts 27Overview 27The Ins and Outs of a JMP Data Table29Selecting and Deselecting Rows and Columns 30Mousing around a Data Table: Cursor Forms 30Creating a New JMP Table32Define Rows and Columns 33Enter Data 35The New Column Command 36Plot the Data 37Importing Data39Importing Text Files 41Importing Other File Types 44Copy, Paste, and Drag Data 46Moving Data Out of JMP 47Saving Graphs and Reports 48Copy and Paste 48Drag Report Elements 49Save JMP Reports and Graphs 49Create Interactive Web Reports 49Pop-up Menu Commands 50Juggling Data Tables51Data Management 51Give New Shape to a Table: Stack Columns 52Creating Summary Statistics55Create Summary Statistics with the Summary Command 55Create Summary Statistics with Tabulate 58Working with Scripts60Creating Scripts 60Running Data Table Scripts 60Opening and Running Stand-alone Scripts 614Formula Editor 63Overview 63The Formula Editor Window65The Formula Editor and the JMP Scripting LanguageA Quick Example: Standardizing Data 6766
Table of ContentsMaking a New Formula Column 69Using Popular Formula Functions71Writing Conditional Expressions 72Summarizing Data with the Formula Editor 77Generating Random Data 82Local Variables and Table Variables 87Working with Dates 89Tips on Building Formulas90Examining Expression Values 90Cutting, Dragging, and Pasting FormulasSelecting Expressions 91Exercises59091What Are Statistics?95Overview 95Ponderings 97The Business of Statistics 97The Yin and Yang of Statistics 97The Faces of Statistics 98Don’t Panic 99Preparations101Three Levels of Uncertainty 101Probability and Randomness 102Assumptions 102Data Mining? 103Statistical Terms6Simulations104109Overview 109Rolling Dice 111Rolling Several Dice 114Flipping Coins, Sampling Candy, or Drawing Marbles 114Probability of Making a Triangle 115Confidence Intervals 120Data Table-Based Simulations 121Other JMP Simulators 122Exercises 1237Univariate Distributions: One Variable, One Sample 125Overview 125Looking at Distributions128v
viTable of ContentsProbability Distributions 130True Distribution Function or Real-World Sample Distribution 131The Normal Distribution 133Describing Distributions of Values134Generating Random Data 134Histograms 135Stem-and-Leaf Plots 137Dot Plots 138Outlier and Quantile Box Plots 139Mean and Standard Deviation 141Median and Other Quantiles 142Mean versus Median 142Other Summary Statistics: Skewness and Kurtosis 143Extremes, Tail Detail 143Statistical Inference on the Mean144Standard Error of the Mean 144Confidence Intervals for the Mean 144Testing Hypotheses: Terminology 147The Normal z-Test for the Mean 149Case Study: The Earth’s Ecliptic 150Student’s t-Test 152Comparing the Normal and Student’s t Distributions 153Testing the Mean 154The p-Value Animation 155Power of the t-Test 157Practical Significance versus Statistical SignificanceExamining for Normality 161159Normal Quantile Plots 162Statistical Tests for Normality 165Special Topic: Practical Difference 167Special Topic: Simulating the Central Limit TheoremSeeing Kernel Density Estimates 172Exercises 1738The Difference Between Two MeansOverview 177Two Independent Groups179When the Difference Isn’t Significant 179Check the Data 180Launch the Fit Y by X Platform 181Examine the Plot 182Display and Compare the Means 183Inside the Student’s t-Test 184170177
Table of ContentsEqual or Unequal Variances? 185One-Sided Version of the Test 187Analysis of Variance and the All-Purpose F-Test 188How Sensitive Is the Test?How Many More Observations Are Needed? 190When the Difference Is Significant 192Normality and Normal Quantile Plots 194Testing Means for Matched Pairs 196Thermometer Tests 197Look at the Data 198Look at the Distribution of the Difference 199Student’s t-Test 199The Matched Pairs Platform for a Paired t-Test 200Optional Topic:An Equivalent Test for Stacked Data 203Two Extremes of Neglecting the Pairing Situation: A DramatizationA Nonparametric Approach 211Introduction to Nonparametric Methods 211Paired Means: The Wilcoxon Signed-Rank Test 211Independent Means: The Wilcoxon Rank Sum Test 213Exercises9214Comparing Many Means: One-Way Analysis ofVariance 217Overview 217What Is a One-Way Layout? 219Comparing and Testing Means 221Means Diamonds: A Graphical Description of Group MeansStatistical Tests to Compare Means 223Means Comparisons for Balanced Data 226Means Comparisons for Unbalanced Data 227222Adjusting for Multiple Comparisons 232Are the Variances Equal across the Groups? 235Testing Means with Unequal Variances 238Nonparametric Methods 239Review of Rank-Based Nonparametric Methods 239The Three Rank Tests in JMP 240Exercises24210 Fitting Curves through Points: RegressionOverview 245Regression 247245205vii
viiiTable of ContentsLeast Squares 247Seeing Least Squares 248Fitting a Line and Testing the Slope 250Testing the Slope By Comparing Models 252The Distribution of the Parameter Estimates 255Confidence Intervals on the Estimates 256Examine Residuals 258Exclusion of Rows 258Time to Clean Up 260Polynomial Models260Look at the Residuals 261Higher-Order Polynomials 261Distribution of Residuals 262Transformed FitsSpline Fit263265Are Graphics Important? 266Why It’s Called Regression 269What Happens When X and Y Are Switched?Curiosities 274271Sometimes It’s the Picture That Fools You 274High-Order Polynomial Pitfall 275The Pappus Mystery on the Obliquity of the Ecliptic 276Exercises27711 Categorical Distributions 281Overview 281Categorical Situations 283Categorical Responses and Count Data: Two OutlooksA Simulated Categorical Response 286Simulating Some Categorical Response Data 287Variability in the Estimates 288Larger Sample Sizes 290Monte Carlo Simulations for the Estimators 291Distribution of the Estimates 292The X2 Pearson Chi-Square Test StatisticTheG2293Likelihood-Ratio Chi-Square Test StatisticLikelihood Ratio Tests 295The G2 Likelihood Ratio Chi-Square TestUnivariate Categorical Chi-Square TestsComparing Univariate DistributionsCharting to Compare Results 299297296296294283
Table of ContentsExercises30112 Categorical Models303Overview 303Fitting Categorical Responses to Categorical Factors: Contingency Tables22Testing with G and X Statistic 305Looking at Survey Data 306Car Brand by Marital Status 310Car Brand by Size of Vehicle 311Two-Way Tables: Entering Count Data312Expected Values under Independence 313Entering Two-Way Data into JMP 314Testing for Independence 314If You Have a Perfect Fit 316Special Topic: Correspondence Analysis— Looking at Data with ManyLevels 318Continuous Factors with Categorical Responses: Logistic Regression 321Fitting a Logistic Model 321Degrees of Fit 325A Discriminant Alternative 326Inverse Prediction 327Polytomous (Multinomial) Responses: More Than Two Levels 330Ordinal Responses: Cumulative Ordinal Logistic Regression 331Surprise: Simpson’s Paradox: Aggregate Data versus Grouped DataGeneralized Linear Models 337Exercises 34213 Multiple Regression345Overview 345Parts of a Regression Model 347Regression Definitions 347A Multiple Regression Example 348Residuals and Predicted Values 351The Analysis of Variance Table 354The Whole Model F-Test 354Whole-Model Leverage Plot 355Details on Effect Tests 356Effect Leverage Plots 356Collinearity358Exact Collinearity, Singularity, and Linear Dependency 362The Longley Data: An Example of Collinearity 364334305ix
xTable of ContentsThe Case of the Hidden Leverage Point 366Mining Data with Stepwise RegressionExercises 37314 Fitting Linear ModelsOverview 377The General Linear Model369377379Types of Effects in Linear Models 380Coding Scheme to Fit a One-Way ANOVA as a Linear Model 381Regressor Construction 384Interpretation of Parameters 385Predictions Are the Means 385Parameters and Means 385Analysis of Covariance: Continuous and Categorical Terms in the Same Model 386The Prediction Equation 389The Whole-Model Test and Leverage Plot 390Effect Tests and Leverage Plots 391Least Squares Means 393Lack of Fit 394Separate Slopes: When the Covariate Interacts with a Categorical Effect 396Two-Way Analysis of Variance and Interactions 400Optional Topic: Random Effects and Nested Effects 406Nesting 407Repeated Measures 409Method 1: Random Effects-Mixed Model 409Method 2: Reduction to the Experimental Unit 414Method 3: Correlated Measurements-Multivariate Model 416Varieties of Analysis 418Closing Thoughts 418Exercises41915 Design of Experiments421Overview 421Introduction 424Key Concepts 424JMP DOE 425A Simple Design426The Experiment 426Enter the Response and Factors 427Define the Model 429Is the Design Balanced? 432Perform Experiment and Enter Data 432
Table of ContentsAnalyze the Model 433Flour Paste Conclusions 439Details of the Design: Confounding StructureUsing the Custom Designer439440How the Custom Designer Works 440Choices in the Custom Designer 441An Interaction Model: The Reactor Data 442Analyzing the Reactor Data 444Where Do We Go from Here? 450Some Routine Screening Examples452Main Effects Only (a Review) 452All Two-Factor Interactions Involving a Single Factor 453Alias Optimal Designs 455Response Surface Designs456The Odor Experiment 456Response Surface Designs in JMP 456Analyzing the Odor Response Surface Design 458Plotting Surface Effects 461Specifying Response Surface Effects Manually 462The Custom Designer versus the Response Surface Design Platform 463Split-Plot Designs464The Box Corrosion Split-Plot ExperimentDesigning the Experiment 465Analysis of Split-Plot Designs 467Design Strategies 471DOE Glossary of Key TermsExercises 47646547216 Bivariate and Multivariate Relationships479Overview 479Bivariate Distributions 481Density Estimation 481Bivariate Density Estimation 482Mixtures, Modes, and Clusters 484The Elliptical Contours of the Normal DistributionCorrelations and the Bivariate Normal485487Simulating Bivariate Correlations 487Correlations across Many Variables 490Bivariate Outliers 491Outliers in Three and More Dimensions 494Identify Variation with Principal Components AnalysisPrincipal Components for Six Variables499496xi
xiiTable of ContentsHow Many Principal Components?Discriminant Analysis501502Canonical Plot 503Discriminant Scores 504Stepwise Discriminant Variable Selection 507Cluster Analysis508Hierarchical Clustering: How Does It Work?A Real-World Example 511Some Final ThoughtsExercises 51550851417 Exploratory Modeling517Overview 517Recursive Partitioning (Decision Trees)519Growing Trees 521Exploratory Modeling with Partition 528Saving Columns and Formulas 530Neural Nets531A Simple Example 532Modeling with Neural Networks 535Saving Columns 535Profiles in Neural 537Exercises54118 Control Charts and CapabilityOverview 545What Does a Control Chart Look LikeTypes of Control Charts 549545548Variables Charts 550Attributes Charts 551Specialty Charts 551Control Chart Basics 551Control Charts for Variables Data 552Variables Charts Using Control Chart BuilderThe Control Chart Builder Work SpaceControl Chart Builder Examples 554Control Charts for Attributes DataSpecialty Charts 560553553557Presummarize Charts 560Levey-Jennings Charts 561Uniformly Weighted Moving Average (UWMA) Charts 561
Table of ContentsExponentially Weighted Moving Average (EWMA) ChartCapability Analysis563564What Is Process Capability? 564Capability for One Process Measurement 567Capability for Many Process Measurements 569Capability for Time-Ordered Data 572A Few Words about Measurement SystemsExercises 57419 Mechanics of Statistics574577Overview 577Springs for Continuous Responses579Fitting a Mean 579Testing a Hypothesis 580One-Way Layout 581Effect of Sample Size Significance 581Effect of Error Variance on Significance 582Experimental Design’s Effect on Significance 583Simple Regression 584Leverage 585Multiple Regression 586Summary: Significance and Power 586Mechanics of Fit for Categorical Responses586How Do Pressure Cylinders Behave? 587Estimating Probabilities 588One-Way Layout for Categorical Data 589Logistic Regression 591AAnswers to Selected Exercises593Chapter 4, “Formula Editor” 593Chapter 7, “Univariate Distributions: One Variable, One Sample” 596Chapter 8, “The Difference Between Two Means” 600Chapter 9, “Comparing Many Means: One-Way Analysis of Variance” 602Chapter 10, “Fitting Curves through Points: Regression” 606Chapter 11, “Categorical Distributions” 609Chapter 12, “Categorical Models” 610Chapter 13, “Multiple Regression” 612Chapter 14, “Fitting Linear Models” 613Chapter 15, “Design of Experiments” 614Chapter 16, “Bivariate and Multivariate Relationships” 615Chapter 17, “Exploratory Modeling” 617Chapter 18, “Control Charts and Capability” 617xiii
xivTable of ContentsBReferences and Data SourcesTechnology License NoticesIndex627625619
JMP Start Statistics: A Guide to Statistics and DataAnalysis Using JMP , Sixth Edition. Full book availablefor purchase here.PreliminariesWhat You Need to Know about statisticsThis book is designed to help you learn about statistics. Even though JMP has manyadvanced features, you do not need a background of formal statistical training touse it. All analysis platforms include graphical displays with options that help youreview and interpret the results. Each platform also includes access to Help thatoffers general guidance and appropriate statistical details.Learning about JMP on your own with JMP HelpIf you are familiar with Macintosh or Microsoft Windows software, you might wantto proceed on your own. After you install JMP, you can open any of the JMP sampledata files and experiment with analysis tools. Help is available for most menus,options, and reports.There are several ways to access JMP Help: Select JMP Help from the Help menu. You can click the Help button in launch windows whenever you launch ananalysis or graph platform. After you generate a report, click the Help tool ( ) on the Tools menu ortoolbar and click the report surface. Context-sensitive help tells about the itemsthat you click.1
2Chapter 1 Preliminaries hands-on examplesThis book describes JMP features and is reinforced with hands-on examples. Byfollowing these step-by-step examples, you can quickly become familiar with JMPmenus, options, and report windows. Steps for example analyses begin with the mouse symbol in the margin, likethis paragraph. using TutorialsTutorials interactively guide you through some common tasks in JMP and areaccessible from the Help Tutorials menu. We recommend that you complete theBeginners Tutorial as a quick introduction to the report features found in JMP. reading about JMPJMP is accompanied by a series of built-in reference manuals, a menu referencecard and a quick reference card. The newest in the series of guides, DiscoveringJMP, provides a general introduction to JMP. It contains basic examples anddescriptions that give you a feel for JMP and can get you started.Discovering JMP is followed by Using JMP, which helps new users understandJMP data tables and how to perform basic operations. Using JMP is followed byseveral books that document all of the JMP analysis and graph platforms. Inaddition, there are specialty books for design of experiments and the JMPscripting language. These references cover all the commands and options in JMPand have extensive examples of the Analyze, Graph, and DOE platforms.The documentation is available in the following formats: In-product help (Select the Help JMP Help menu.) PDF files (Select the Help Books menu.) e-books (Amazon.com, Google Books, the Apple App Store, or the SASBookstore) Help at http://jmp.com/support/help Print books (Amazon.com or the SAS Bookstore)
Chapter 1 Preliminaries3Chapter OrganizationThe chapters of this book are supported by guided actions that you can take tobecome familiar with JMP.The first five chapters get you quickly started with information about JMP tables,how to use the JMP formula editor, and give an overview of how to obtain resultsfrom the Analyze and Graph menus. Chapter 1, “Preliminaries,” is this introductory material. Chapter 2, “Getting Started with JMP,” tells you how to start and stop JMP,how to open data tables, and takes you on a short guided tour. You areintroduced to the general personality of JMP. You see how data is handled byJMP. There is an overview of all analysis and graph commands; informationabout how to navigate a platform of results; and a description of the tools andoptions available for all analyses. Chapter 3, “Data Tables, Reports, and Scripts,” focuses on using the JMP datatable. It shows how to create tables, subset, sort, and manipulate them withbuilt-in menu commands, and how to get data and results out of JMP andinto a report. Chapter 4, “Formula Editor,” covers the formula editor and quick ways tocreate formulas and derived variables. There is a description of the formulaeditor components and an overview of the extensive functions available forcalculating column values. Chapter 5, “What Are Statistics?,” gives you some things to ponder about thenature and use of statistics. It also attempts to dispel statistical fears andphobias that are prevalent among students and professionals alike.Chapters 6–19 cover the array of analysis techniques offered by JMP. Chaptersbegin with simple-to-use techniques and gradually work toward more complexmethods. Emphasis is on learning to think about these techniques and on how tovisualize data analysis at work. JMP offers a graph for almost every statistic andsupporting tables for every graph. Using highly interactive methods, you canlearn more quickly and discover what your data has to say. Chapter 6, “Simulations,” introduces you to some probability topics by usingthe JMP scripting language. You learn how to open and execute these scriptsand to see other ways of simulating data in JMP.
4Chapter 1 Preliminaries Chapter 7, “Univariate Distributions: One Variable, One Sample,” coversdistributions of continuous and categorical variables and statistics to testunivariate distributions. Chapter 8, “The Difference Between Two Means,” covers t tests ofindependent groups and tells how to handle paired data. The nonparametricapproach to testing related pairs is also shown. Chapter 9, “Comparing Many Means: One-Way Analysis of Variance,” coversone-way analysis of variance, with standard statistics and a variety ofgraphical techniques. Chapter 10, “Fitting Curves through Points: Regression,” shows how to fit aregression model for a single factor. Chapter 11, “Categorical Distributions,” discusses how to think about thevariability in single batches of categorical data. It covers estimating andtesting probabilities in categorical distributions, shows Monte Carlomethods, and introduces the Pearson and Likelihood ratio chi-squarestatistics. Chapter 12, “Categorical Models,” covers fitting categorical responses to amodel, starting with the usual tests of independence in a two-way table, andcontinuing with graphical techniques and logistic regression. Chapter 13, “Multiple Regression,” describes the parts of a linear model withcontinuous factors, talks about fitting models with multiple numeric effects,and shows a variety of examples, including the use of stepwise regression tofind active effects. Chapter 14, “Fitting Linear Models,” is an advanced chapter that continuesthe discussion of Chapter 12. The chapter moves on to categorical effects andcomplex effects, such as interactions and nesting. Chapter 15, “Design of Experiments,” looks at the built-in commands in JMPused to generate specified experimental designs. It also looks at examples ofhow to analyze common screening and response-level designs are covered. Chapter 16, “Bivariate and Multivariate Relationships,” looks at ways toexamine two or more response variables using correlations, scatterplotmatrices, three-dimensional plots, principal components, and othertechniques. Discriminant and Cluster Analysis discuss methods that groupdata into clumps. Outliers are discussed. Chapter 17, “Exploratory Modeling,” illustrates common data miningtechniques—Neural Nets and Recursive Partitioning.
Chapter 1 Preliminaries5 Chapter 18, “Control Charts and Capability,” discusses common types ofcontrol charts for both continuous and attribute data, and introduces processcapability studies. Chapter 19, “Mechanics of Statistics,” is an essay about statistical fitting thatmight prove enlightening to those who enjoy mechanics.Typographical ConventionsThe following conventions help you relate written material in this book toinformation that you see on your screen. Reference to menu names (File menu) or menu items (Save command), andbuttons on windows (OK), appear in the Helvetica bold font. When you are asked to select a command from a submenu, such as File SaveAs, go to the File menu and select the Save As command. Likewise, items on menus in reports are shown in Helvetica bold, but you aregiven a more detailed instruction about where to find the command oroption. For example, you might be asked to select the Show Points optionfrom the red triangle menu on the analysis title bar. You might select the SavePredicted command from the Fitting menu on the scatterplot title bar. Eachmenu is always visible as a small red triangle on the platform or on its outlinetitle bars, as circled below. References to variable names, data table names, and some items in reportsappear in Helvetica but can appear in illustrations in either a plain or boldfacefont. These items show on your screen as you have specified in your JMPPreferences. Words or phrases that are important, new, or have definitions specific to JMPare in italics the first time you see them.
6Chapter 1 Preliminaries When there is an action statement, you can do the example yourself byfollowing the instructions. These statements are preceded by a mouse symbol( ) in the margin. An example of an action statement is: Highlight the Month column by clicking the area above the column name,and then select Cols Column Info. Occasionally, special information is in a boxed side bar in Helvetica to helpdistinguish them from the text flow.
PrefaceJMP is statistical discovery software. JMP helps you explore data, fit models,discover patterns, and discover points that don’t fit patterns. This book is a guide tostatistics using JMP.The SoftwareAs statistical discovery software, JMP emphasizes working interactively with dataand graphics in a progressive structure to make discoveries. With graphics, you are more likely to make discoveries. You are also morelikely to understand the results. With interactivity, you are encouraged to dig deeper and try out more thingsthat might improve your chances of discovering something important. Withinteractivity, one analysis leads to a refinement, and one discovery leads toanother discovery. With a progressive structure, you build a context that maintains a live analysis.You don’t have to redo analyses and plots to make changes in them, so detailscome to attention at the right time.The purpose of JMP software is to create a virtual workplace. The software hasfacilities and platforms where the tools are located and the work is performed. JMPprovides the workplace that we think is best for the job of analyzing data. With theright software workplace, researchers embrace computers and statistics, rather thanavoid them.xv
xviPrefaceJMP aims to present a graph with every statistic. You should always see theanalysis in both ways, with statistical text and graphics, without having to ask forit. The text and graphs stay together.JMP is controlled largely through point-and-click mouse manipulation. If youplace the pointer over a point, JMP identifies it. If you click on a point in a plot,JMP highlights the point in the plot and highlights the point in the data table. Infact, JMP highlights the point everywhere it is represented.JMP has a progressive organization. You begin with a simple report at the top,and as you analyze, more and more depth is revealed. The analysis is alive, and asyou dig deeper into the data, more and more options are offered according to thecontext of the analysis.In JMP, completeness is not measured by the “feature count,” but by the range ofpossible applications, and the orthogonality of the tools. In JMP, you get a feelingof being in more control despite your having less awareness of the control surface.You also get a feeling that statistics is an orderly discipline that makes sense,rather than an unorganized collection of methods.A statistical software application is often the point of entry into the practice ofstatistics. JMP strives to offer fulfillment rather than frustration, empowermentrather than intimidation.If you give someone a large truck, they will find someone to drive it for them. Butif you give them a sports car, they will learn to drive it themselves. We believe thatstatistics can be interesting and reachable so that people will want to drive thatvehicle.How to Get JMPThere are several ways to get JMP: JMP is available through department or campus licenses at most colleges anduniversities and through site licenses in many organizations. See yoursoftware IT administrator for availability and download information. Individual copies of JMP for academic use are also available from http://onthehub.com/jmp. If you would like more information about academiclicensing or would like to request an evaluation copy of JMP for classroomuse, email academic@jmp.com.
Preface xviiIf you do not qualify for an academic license, a trial version of JMP isavailable at http://jmp.com/trial. Read license information at http://jmp.com/buy.JMP Start Statistics, Sixth EditionJMP Start Statistics has been updated and revised to feature JMP 13. Majorenhancements have been made to JMP since the fifth edition, which was based onJMP 10. The new enhancements include DOE (Design Evaluation, new CustomDesign options, and Definitive Screening designs), analysis and modeling(Generalized Regression, Partition enhancements, Model Comparison, andFormula Depot), data preparation (handling missing values and outliers, andmodel validation), and graphics (continued development of the interactive GraphBuilder), most of which are c
The correct bibliographic citation for this manu al is as follows: John Sall, Ann Lehman, Mia Stephens, and Sheila Loring. JMP Start Statistics: A Guide to Statistics and Data Analysis Using JMP , Sixth Editio