Transcription
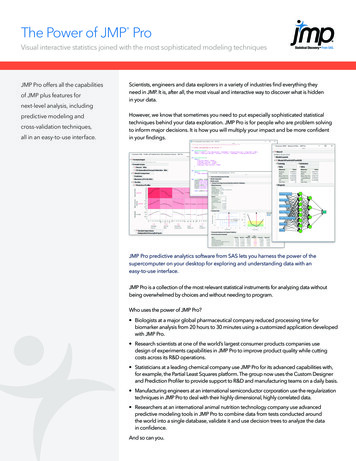
The Power of JMP Pro Visual interactive statistics joined with the most sophisticated modeling techniquesJMP Pro offers all the capabilitiesof JMP plus features fornext-level analysis, includingpredictive modeling andcross-validation techniques,all in an easy-to-use interface.Scientists, engineers and data explorers in a variety of industries find everything theyneed in JMP. It is, after all, the most visual and interactive way to discover what is hiddenin your data.However, we know that sometimes you need to put especially sophisticated statisticaltechniques behind your data exploration. JMP Pro is for people who are problem solvingto inform major decisions. It is how you will multiply your impact and be more confidentin your findings.JMP Pro predictive analytics software from SAS lets you harness the power of thesupercomputer on your desktop for exploring and understanding data with aneasy-to-use interface.JMP Pro is a collection of the most relevant statistical instruments for analyzing data withoutbeing overwhelmed by choices and without needing to program.Who uses the power of JMP Pro? Biologists at a major global pharmaceutical company reduced processing time forbiomarker analysis from 20 hours to 30 minutes using a customized application developedwith JMP Pro. Research scientists at one of the world’s largest consumer products companies usedesign of experiments capabilities in JMP Pro to improve product quality while cuttingcosts across its R&D operations. Statisticians at a leading chemical company use JMP Pro for its advanced capabilities with,for example, the Partial Least Squares platform. The group now uses the Custom Designerand Prediction Profiler to provide support to R&D and manufacturing teams on a daily basis. Manufacturing engineers at an international semiconductor corporation use the regularizationtechniques in JMP Pro to deal with their highly dimensional, highly correlated data. Researchers at an international animal nutrition technology company use advancedpredictive modeling tools in JMP Pro to combine data from tests conducted aroundthe world into a single database, validate it and use decision trees to analyze the datain confidence.And so can you.
JMP Pro has the tools to handle thecomplexity of various types of data. Text ExplorationLet JMP Pro process yourunstructured text data,reduce dimensionalityand generate datathat can be easilyconsumed by the otherpredictive modelingtools. This helps youunderstand and modelthe latent informationpresent in text data suchas engineering reports,surveys or other freetext documents.If you have unstructured text data, TextExplorer organizes and shapes that datainto a usable form for your predictivemodels, and the latent information you’vecollected in the form of repair logs,engineering notes or customer surveyresponse comments is now available toboost the power of your models.Text Explorer in JMP Pro turns thedifficulty of dealing with text data intoa standard data analysis problem.It handles latent class analysis, latentsemantic analysis, topic analysis, andcluster terms and documents. Withthe enhanced capabilities of the TextExplorer platform, text data analysisbecomes attainable, like any otherdata exploration. Functional Data ExplorerKey featuresPredictive modelingAnyone can do a fair job of describing lastyear’s performance. But without the righttools and the most modern techniques,building a model to predict what will happenwith new customers, new processes or newrisks becomes more difficult. Some of themost useful techniques for predictivemodeling are available in JMP Pro: The Partition platform in JMP Pro automates the decision tree-building process. The Bootstrap Forest platform, which usesa random-forest technique, grows dozensof decision trees using random subsets ofthe available data and averages thecomputed influence of each factor inthese trees. The Boosted Tree platform builds manysimple trees, repeatedly fitting any residualvariation from one tree to the next. The advanced Neural platform lets youbuild one- or two-layer neural networkswith your choice of three activationfunctions and automatic modelconstruction using gradient boosting.The platform automatically handlesmissing values and transformation ofcontinuous X’s, which saves time andeffort, includes robust fitting options andguards against overfitting without havingto mentally tune parameters. The Generalized Regression platform letsyou perform variable selection, generalizea response to a number of distribution andperforms regularization using penalizedmethods, forward selection as well as hasa rich set of diagnostics; it’s an all-in-onelinear modeling platform in JMP Pro. K-Nearest Neighbors and Naive Bayesmodels. Support Vector Machine (SVM) classifiers.Each of these platforms in JMP Pro usescross-validation described in the nextsection. In addition, stepwise regression,logistic regression (both nominal andordinal), PLS and discriminant analysis inJMP Pro can take advantage of using avalidation column allowing you to usethese modeling methods in your predictivemodeling workflow.Using diverse types of dataIt’s great when your data is straightforward,with columns of numbers, dates orcategories. But data, in its many formsand from its many sources, isn’t always soclear. When your data gets complicated,Data collected from batch processes andsensor streams require specialized datacleaning and modeling techniques.Functional Data Explorer in JMP Prosimplifies the complex problems ofmanaging and cleaning up this data.Furthermore, with Functional DataExplorer, perform the challenging tasks ofhandling messy data, removing outliers,aligning curves, building surrogatemodels and creating features to betterunderstand data coming from yourstreams or process measures (for use asinputs, outputs or both) from sensorstreams. Streamlined workflows simplifythe process of creating, reshaping andjoining tables, especially for functionalexperiment design (functional DOE).“Data is worthless if we don’thave the right tools to workwith it. So we need to be usingthe newest and most innovativemeans to manage this data.JMP Pro uses the most innovativeand effective methods, andthat’s very important.”Corinne Bergès, PhDAdvanced Automotive AnalogDepartment, NXP
Partial least squaresAre you trying to model data that is widerthan it is tall? Traditional techniques won’twork, but partial least squares (PLS) does.PLS is a powerful modeling technique tohave in your toolbox, especially when youhave more X variables than observations,highly correlated X variables, a largenumber of X variables, or several Y variablesand many X variables. All of these aresituations where ordinary least squareswould produce unsatisfactory results.PLS modeling fits linear models based onfactors, namely linear combinations ofexplanatory variables (the X’s). The factorsare obtained in a way that attempts tomaximize the covariance between the X’sand the response or responses (the Y’s).In JMP Pro, you can build PLS models witheither continuous or categorical responses(PLS-DA), specify curvature terms orinteraction effects and perform missingvalue imputation.Cross-validationFor effective predictive modeling, you needsound ways to validate your model, and witha large model, you can easily get into troubleover-fitting. Large models should always becross-validated, and JMP Pro does thisthrough data partitioning, or holdback. Thecross-validation technique helps you buildmodels that generalize well to tomorrow’sdata – about new customers, new processesor new risks – so you can make data-driveninferences about the future.Dividing the data into training, validation andtest data sets has long been used to avoidover-fitting, ensuring that the models youbuild are not reliant on the properties of thespecific sample used to build them. Thegeneral approach to cross-validation in JMPPro is to use a validation column. You can easilysplit your data into different sets for differentpurposes using the validation column utility(either with a purely random sample stratifiedrandom or using a time cut-point).The training set is used to build the model(s);the validation set is used in the modelbuilding process to help choose howcomplex the model should be. Finally, thetest set is held out completely from themodel-building process and used to assessthe quality of the model(s). For smaller datasets, k-fold cross-validation also can be used.This process helps you build models thatgeneralize to new data effectively.It is important to consider that observationaldata can only take you so far. To trulyunderstand cause and effect, manytimes you may wish to employ design ofexperiments (DOE).JMP provides world-class tools for optimalDOE in a form you can easily use.Structural Equation ModelingWhen you need to examine relationshipsbetween measured variables and latentconstructs, Structural Equation Modeling inJMP Pro is a sound, but flexible, modelingframework that allows specification of avariety of statistical models. You can explorecompeting theories about latent variablesand fit any general linear model, includingconfirmatory factor analysis, path analysisand latent growth curve models. Additionally,you can use a graphical model builder forcreating interrelated models, specify amodel, duplicate it and switch amongseveral models’ results, or use a modelspecification repeatedly with different setsof data. The flexibility of Structural EquationModeling lets you fit models where variablescan be both inputs and outputs at thesame time.Formula Depot is the hub for organizing, comparing, profiling, storing and deploying models built in JMP Pro.You can convert models built in JMP Pro in a single click to score code in SAS, C, Python, JavaScript and/or SQL.
Model comparisonIn the real world, some kinds of models fitwell in certain situations but poorly in others.With JMP Pro, there are many ways to fit,and you need to find out which is mostappropriate in a given situation. A typicalapproach to model building is that you willtry many different models: models withmore or less complexity, models with orwithout certain factors/predictors, modelsbuilt using different kinds of methods oreven averages of multiple models(ensemble models).Each of these models will have commonquality measures that can be used to assessthe model: R2, misclassification rate, ROCcurves, AUC, lift curves, etc.Using model comparison in JMP Pro, youcan compare all the saved predictioncolumns from various fits and pick the bestcombination of goodness of fit, parsimonyand cross-validation. JMP Pro makes thiscomparison automatically. At the same time,you can interact with visual model profilersto see which important factors each modelis picking up. Model comparison in JMP Promakes it easy to compare multiple modelsat the same time, and also to do simplemodel averaging, if desired.Formula Depot and score codeManaging your models doesn’t have to bepainful – the Formula Depot in JMP Proorganizes your work when dealing withmany models. This central repository letsyou store, profile, compare and selectivelygenerate code to aid in deployment ofJMP Pro models to other languages suchas SAS , Python, SQL and JavaScript. Andeven if you don’t choose to deploy modelsoutside of JMP, your data tables are nolonger weighed down with numerous extracolumns of prediction formulas needed toperform model comparison. The scorecode can be saved to the Formula Depotand applied to new data. The result is acentral modeling hub for easy access toyour models and simple deployment toother systems.The bootstrap forest will identify all the potential variables that could be affectingyour responses for further investigation, ideally with design of experiments.A standard decision tree model will not always do this, as shown here.Connect to the richness of SAS As one of the SAS offerings for predictiveanalytics and data mining, JMP Pro easilyconnects to SAS including SAS Viya ,expanding options and giving access to theunparalleled depth of SAS Analytics anddata integration.Modern modelingThe Generalized Regression personality inFit Model is an all-inclusive approach todoing regression.With Generalized Regression, you canbuild models for many kinds of data,including DOE data, observational data,data with categorical responses, messydata, text regression, highly correlateddata and more.In one location, with one tool, you can fitmodels, select variables, handle multicollinearity and investigate diagnostic reports.And it’s only in JMP Pro.Standard estimation techniques breakdown when you have predictors that arestrongly correlated or more predictors thanobservations. And when there are manycorrelated predictors (as is often the case inobservational data), stepwise regressionor other standard techniques can yieldunsatisfactory results. Such models areoften overfit and generalize poorly tonew data. But how do you decide whichvariables to cull before modeling –or, worse, how much time do you losemanually preprocessing data sets inpreparation for modeling?The Generalized Regression personality inFit Model is an all-inclusive approach todoing regression. It’s a complete modelingframework from variable selectionthrough model diagnostics to LS meanscomparisons, inverse prediction andprofiling. And it’s only in JMP Pro.The estimation methods in GeneralizedRegression include basic ones such asstandard least squares, logistic regressionand maximum likelihood (for a multinomialresponse) as well as selection techniqueslike best subset and pruned forwardselection and regularization techniques suchas Lasso, Double Lasso and the DantzigSelector. Harnessing these techniques is aseasy as any other modeling personality inFit Model – simply identify your response,construct model effects and pick thedesired estimation and validation method.JMP automatically fits your data, performs
“JMP continues to amazeme. There are always newmodeling techniques andtools to make my life asa data analyst easier. TheGeneralized Regressionplatform is easy to useand fast. And the abilityto create test/validationvariables on the fly is great.Check it out!”Dick De VeauxC. Carlisle and Margaret TippitProfessor of Statistics,Williams Collegevariable selection when appropriate, andbuilds a predictive model that can begeneralized to new data.Finally, Generalized Regression gives optionsto choose the appropriate distribution forthe response you are modeling, letting youmodel more diverse responses such ascounts, data with many outliers, or skeweddata. And like all the advanced modelingplatforms in JMP Pro, you have your choiceof cross-validation techniques.ReliabilityReliability Block DiagramOften you are faced with analyzing thereliability of a more complex analyticalsystem – a RAID storage array with multiplehard drives, or an airplane with fourengines, for example. With JMP, you havemany tools to analyze the reliability ofsingle components within those systems.But with JMP Pro, you can take the reliabilityof single components, build a complexsystem of multiple components andanalyze the reliability of the entire system.Using the Reliability Block Diagram, youcan easily design and fix weak spots in yoursystem – and be better informed to preventfuture system failures.Generalized Regression is a one-stop shop for interactive variable selection, modelingand generalizing data to diverse distributions, even with challenging data problems.With this platform, you can perform what-ifanalyses by looking at different designsand comparing plots across multiplesystem designs. You can also determinethe best places to add redundancy anddecrease the probability of a system failure.Repairable Systems SimulationSome systems or components of complexsystems are too costly to have offline forvery long. Maintaining the integrity of thesesystems requires you to schedule repairsfor system components or maximize thebenefit realized by an unplanned outageby completing additional repairs while thesystem is unavailable. With JMP Pro, youcan use the Repairable Systems Simulationto determine how long a system will beunavailable and answer key questions ofhow many repairable events to expect ina given period of time and how much arepair event will cost.Covering arraysCovering arrays are used in testingapplications where factor interactions maylead to failures where each experimentalrun may be costly. As a result, you needto design an experiment to maximize theprobability of finding defects while alsominimizing cost and time. Covering arrayslet you do just that. JMP Pro lets you designan experiment to test deterministic systemsand cover all possible combinations offactors up to a certain order of interactions.And when there are combinations offactors that create implausible conditions,you can use the interactive DisallowedCombinations filter to automaticallyexclude these combinations of factorsettings from the design.One of the advantages of covering arraysin JMP Pro is that JMP Pro is a statisticalanalysis tool, not just a covering arraysdesign tool. For example, you can designcovering arrays and analyze the datausing generalized regression. This is anadvantage of JMP Pro over other toolsthat only design covering arrays.Finally, JMP Pro allows you to import anycovering array design – generated byany software – and further optimize itand analyze the results. You can designthe arrays yourself without having torely on others to build experiments foryou. Test smarter with covering arraysin JMP Pro.
Mixed modelsMixed models contain both fixed effectsand random effects in the analysis. Thesemodels let you analyze data that involveboth time and space. For example, youmight use mixed models in a study designwhere multiple subjects are measuredat multiple times during the course ofa drug trial, or in crossover designs inthe pharmaceutical, manufacturing orchemical industries.JMP Pro lets you fit mixed models to yourdata, letting you specify fixed, randomand repeated effects; correlate groupsof variables; and set up subject andcontinuous effects – all with an intuitivedrag-and-drop interface.In addition, you can calculate the covarianceparameters for a wide variety of correlationstructures. Such examples include when theexperimental units on which the data ismeasured can be grouped into clusters,and the data from a common cluster iscorrelated. Another example is whenrepeated measurements are taken on thesame experimental unit, and theserepeated measurements are correlatedor exhibit variability that changes.It is also easy to visually determine which,if any, spatial covariance structure isappropriate to utilize in your modelspecification when building mixed modelsin JMP Pro.Uplift modelsYou may want to maximize the impact of alimited marketing budget by sending offersonly to individuals who are likely to respondfavorably. But that task may seem daunting,especially when there are large data sets andmany possible behavioral or demographicpredictors. This is where uplift models canhelp. Also known as incremental modeling,true lift modeling or net modeling, upliftmodels have been developed to helpoptimize marketing decisions, definepersonalized medicine protocols or, moregenerally, to identify characteristics ofindividuals who are likely to respond tosome action.Uplift modeling in JMP Pro lets you makethese predictions. JMP Pro fits partitionmodels that find splits to maximize a treatment difference. The models help identifygroups of individuals who are most likely torespond favorably to an action; they help tolead to efficient and targeted decisions thatoptimize resource allocation and impact onthe individual.Advanced computational statisticsJMP Pro includes exact statistical testsfor contingency tables and exact nonparametric statistical tests for one-wayANOVA. Additionally, JMP Pro includesgeneral resampling methods that can beaccessed through a right-click on mostMP reports. Bootstrap: Provides one-click bootstrapping, a resampling method thatapproximates the sampling distributionof a statistic and is useful when textbookassumptions are in question or don’t exist.For example, try applying bootstrappingtechniques to nonlinear model resultsthat are being used to make predictionsor determining coverage intervals aroundquantiles. Also, you can use bootstrapping as an alternative way to gauge theuncertainty in predictive models. Bagging: Conducts model averagingusing bootstrap samples from thetraining set in a cross-validated model.This technique is also known asbootstrap aggregating. Simulate: Provides simulated results fora column of statistics in a report andlets you answer challenging questionswith parametric resampling. Usesimulate to obtain power calculationsin nonstandard situations, evaluatenew or existing statistical methods orconduct permutation tests.Share and communicate resultsJMP has always been about discovery andfinding the best way of communicatingthose discoveries across your organization.JMP Pro includes all the visual andinteractive features of JMP, making yourdata accessible in ways you might neverhave experienced. Through dynamicallylinked data, graphics and statistics and easyto create dashboards, JMP Pro brings yourinvestigation alive in an interactive profiler,geographic map or filtered report to showchange over time, generating valuable newinsights that inform both the model-buildingand explanation process.Operating system guidelinesFunctional Data Explorer is useful for understanding, cleaning up, aligning andbuilding models from sensor streams or batch process data.JMP Pro runs on Microsoft Windows andMac OS. It includes support for 64-bitsystems. See jmp.com/system for completesystem requirements.
Key features exclusive to JMP ProJMP Pro includes all the features of JMP, plus the additional capabilities for analytics listed below.PlatformsAssociation AnalysisMixed Model Performs market basket analysis to identify items that frequentlyoccur together. Fits linear models for continuous responses and complexcovariance structures.Bootstrap Forest Constructs a predictive model by averaging predicted valuesfrom many decision trees constructed using randomly selectedpredictors and observations.Boosted Tree Constructs a predictive model by adding a sequence ofdecision trees where each of the trees is fit on the residuals ofthe previous tree.Covering Arrays Creates designs for testing deterministic systems for failurescaused by interactions among components. Fits random coefficient (hierarchical) models. Fits repeated measures models. Fits spatial data models. Displays variograms. Fits models for multiple correlated responses. Conducts multiple comparisons.Model Comparison Compares the predictive ability of candidate models. Includes fit statistics (R2, misclassification rate, ROC curves,AUC, lift curves). Model averaging. Constructs highly efficient covering arrays.Naive Bayes Constructs covering arrays that take into account disallowed(infeasible) combinations of factor levels. Predicts group membership for a categorical variable basedon the closeness of its predictor values to the predictor valuesfor each group. Supports importing of covering arrays created by other software. Calculates coverage metrics for evaluating covering arrays. Provides ability to further optimize a covering array onceit is created.Formula Depot A container for prediction models that is launched throughthe Publish commands in modeling platforms. Generate Score Code: SAS(DS2), C, Python, Javascript, SQL(with choice of syntax options for different destinations).Functional Data Explorer Useful for dealing with sensor/signal/streaming or batchprocess data.Reliability Block Diagram Graphically displays the relationships among the componentsof a system. Provides a drag-and-drop interface for viewing and editingthe components of a reliability system. Provides profilers that enable you to explore the overallreliability of the system.Repairable Systems Simulation Provides a graphical representation for system maintenancescheduling based on a reliability block diagram. Cleanup, align and conform data coming from sensors. Uses simulation to study and understand complex systembehavior and to schedule desired maintenance. Build surrogate models using a variety of techniques.SEM Use output models and features in other predictivemodeling platforms. Graphical model builder that is useful for creating interrelatedmodels. Works with Custom Designer and Generalized Regressionfor functional DOE. Can be used to build models where variables cannot bemeasured directly and where measurement error shouldbe considered.Generalized Regression General model fitting tool that supports variable selection. Fits penalized generalized linear models, including the lassoand elastic net. Provides forward selection and maximum likelihood. Includes many different cross-validation methods. Provides variable selection for censored data. Fits quantile regression models.K-Nearest Neighbors Predicts a response based on the responses of the k-nearestneighbors in the space of the X’s. Can be used to build a model specification before datais available.SVM Classifier, similar to Neural Net, that provides additionaloptions when building models.Uplift Models incremental impact of an action on individuals. Identifies individuals who are likely to react positively to an action. Finds splits to maximize a treatment difference.(continued to next page)
JMP Pro Specific Platform FeaturesChoice Bayesian Random Effects (Hierarchical Bayes). Save subject estimates for Bayesian Random Effects.Text Explorer Fits latent class analysis models. Performs a singular value decomposition on the documentterm matrix, also known as latent semantic analysis.Fit Y by X Performs a varimax rotated singular value decomposition tohelp you find topics in your text data. Contingency: Provides exact tests for association and trend. Shows clusters of terms and clusters of documents. Oneway: Provides nonparametric exact tests. Provides scatterplot matrices of singular values.Gaussian Process Analyze models with categorical factors. Ability to fit models with thousands of rows through FastGASP. Support for discriminant analysis.Validation ColumnPlatforms that support a validation column:Neural Include rows with missing values in the model, instead ofignoring the rows. Bootstrap Forest Enables you to fit a multi-layer perceptron with three differenttypes of activation functions. Explore Missing Values Fits an additive sequence of models, also called boosting. Provides additional fitting options to transform covariates,minimize the impact of response outliers, and apply penaltiesto help avoid overfitting. Boosted Tree Discriminant Fit Model: Standard Least Squares Fit Model: Stepwise Fit Model: Generalized Regression Fit Model: Nominal Logistic Fit Model: Ordinal LogisticPartial Least Squares Conducts PLS Discriminant Analysis (PLS-DA). Enables use of Fit Model launch window path. Fits interaction and polynomial terms. Fits categorical effects. Includes K-Fold and Holdback validation methods. Imputes missing data with your choice of two methods.Resampling Methods Bootstrap: Provides one-click bootstrapping, a resamplingmethod that approximates the sampling distribution ofa statistic. Fit Model: Parametric Survival Fit Model: Partial Least Squares K-Nearest Neighbors Naive Bayes Neural Partial Least Squares Partition Text Explorer Uplift Bagging: Conducts model averaging using bootstrap samplesfrom the training set. Also known as bootstrap aggregating. Simulate: Provides simulated results for a column of statisticsin a report.Are you ready to take the next step?Contact JMP Sales to ask questions, learn more and schedule a demo.To contact your local JMP office, please visit: jmp.com/officesSAS and all other SAS Institute Inc. product or service names are registered trademarks or trademarks of SAS InstituteInc. in the USA and other countries. indicates USA registration. Other brand and product names are trademarks oftheir respective companies. Copyright 2019, SAS Institute Inc. All rights reserved. 105522 G99726.0819
predictive modeling tools in JMP Pro to combine data from tests conducted around the world into a single database, validate it and use decision trees to analyze the data in confidence. And so can you. JMP Pro offers all the capabilities of JMP plus features for next-level analysis, including predictive modeling and cross-validation techniques,