Transcription
2Q'19 Earnings ReleaseJuly 30, 2019LG Electronics
All information regarding management performance and financial results of LG Electronics (the “Company”) during the 2nd quarter of 2019as contained herein has been prepared on a consolidated basis in accordance with International Financial Reporting Standards (“IFRS”).The information regarding results of 2nd quarter of 2019 has been prepared in advance, prior to being reviewed by outside auditors,solely for the convenience of investors of the Company, and is subject to change in the process of final review by external auditors.The information contained herein includes forward-looking statements in respect to future plans, prospects, and performances of the Companyas well as the Company’s projected sales plan for the 3rd quarter of 2019.These forward-looking statements also refer to the Company’s performance on consolidated base, as indicated.The aforementioned forward-looking statements are influenced by changes in the management environment and relative events, and by their nature,these statements refer to uncertain circumstances. Consequently, due to these uncertainties, the Company’s actual future results may differmaterially from those expressed or implied by such statements.Please note that as the forward-looking statements contained herein are based on the current market situation and the Company’s managementdirection, they are subject to change according to the changes in future market environment and business strategy.The information contained herein should not be utilized for any legal purposes in regards to investors’ investment results. The Company herebyexpressly disclaims any and all liability for any loss or damage resulting from the investors’ reliance on the information contained herein.
Table of ContentsⅠConsolidated Earnings and OutlookⅡPerformance and Outlook by Division
ⅠConsolidated Earnings and Outlook
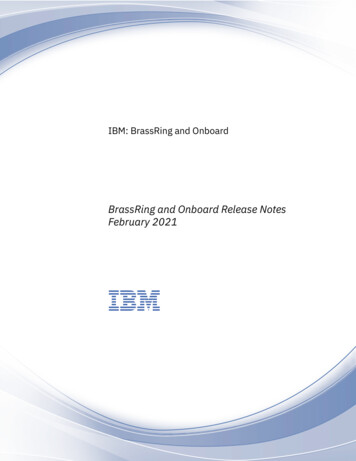
Consolidated Earnings and OutlookSales / ProfitsSales / ProfitsPerformance by Division(Unit : KRW tn)OperatingIncome(%)(Unit : KRW bn)6.0%5.1%4.2%SalesConsolidated*1)(%)H&A*2)Home Appliance& Air SolutionHE *3)14.92QoQ4.8% 15.63YoY4.1% 15.02Home EntertainmentMC *3)Mobile alesO.I(%)SalesVehicle ComponentSolutionsO.IBusiness 5.7 3-0.2%p14.8%19.1 %*1) LG Innotek is included*2) From 1Q'19, robot business has been restated to ‘others' from 'H&A division'*3) From 1Q'19, companion device business has been restated to 'HE division' from 'MC division'
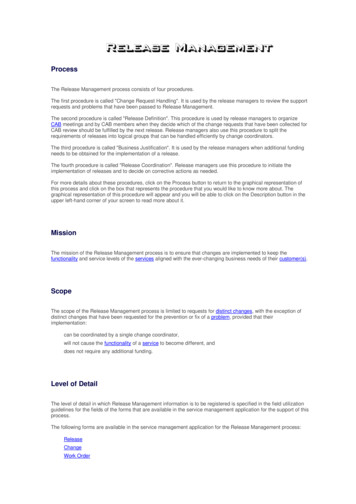
Consolidated Earnings and OutlookIncome TrendCash Flow(Unit : KRW bn)(Unit : KRW bn)1Q’192QoQ2Q’19YoY900.6Net financialincome/expense-78.1Gain/Loss onequity method-23.2Other non-operatingincome/expense-44.9IncomeBefore Tax754.4Corporateincome atingIncomeEBITDAIncome Trend / Cash Flow771.0 Cash at the beginning of period Cash flow from operating activitiesNet s on equity method investment-183.5-206.7-100.9-105.8 Cash flow from investing activitiesIncrease in tangible assets-94.1-139.0-85.6-53.4Increase in intangible assets Cash flow from financing activities-527.3227.1-321.3548.4Dividend paid and othersIncrease/Decrease in debt1,509.21,271.71,242.3 Effects of exchange rate changeson cash and cash equivalents Net changes in cash Cash at the end of periodNet 6-149.43,944.2-204.3339.5
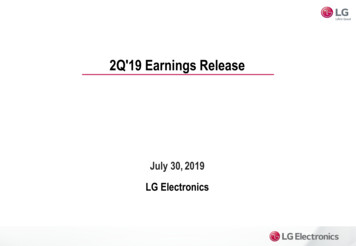
Consolidated Earnings and OutlookLeverage Ratio / Financial PositionLeverage RatioFinancial Position(Unit : KRW tn)(Unit: %)2Q’18Liabilitiesto EquityDebt 8711.4911.55 Equity15.7616.9417.10 Debt10.6911.0610.866.037.657.62Current AssetsNon-Current Assets LiabilitiesCurrent Liabilities45Net Debt toEquity3845Non-Current Liabilities Net Debt32Q’1942.92 Assets1681Q’19
Consolidated Earnings and OutlookBusinessEnvironment Trade uncertainties to rise due to US trade disputes, Japan's export restrictions,and U.K. Brexit etc. Competition between major products to intensify from market stagnation andentrance of off-season Maximize profit by expanding sales of differentiated / premium productsKeyStrategies Continuous growth by fostering B2B, strategic / new businesses Enhance operation efficiency and risk managementSales & ProfitsOutlook(3Q’19)43Q’19 Outlook Sales to grow YoY Maintain stable profitability
ⅡPerformance and Outlook by Division
Performance and Outlook by DivisionPerformance*1)(Unit: %, KRW tn)Op. Margin8.8%13.3%8.5%11.8%H&A (Home Appliance & Air Solution)2Q’19 Performance Sales : Achieved 6.1 Tril. Won, up 16% YoY driven by continued high growth in theKorean market and growth across all regions such as North America, Europe,Middle East and Africa and others2.6%5.264.855.476.104.33 Profit : Achieved record high 2Q profit driven by solid revenue growth,increased sales of new growth products and air conditioners during the peakseason and continuous improvement in cost structureSales3Q’19 ’1919.2Q2Q’19 Market : Solid demand for new growth products in the Korean market is expected tocontinue, but complexity and uncertainties of overseas markets will elevateKey Products LGE :Dish WasherCooktopMini Air PurifierStyler*1) From 1Q'19, robot business has been restated to ‘others' from 'H&A division'5Despite the air conditioning business entering the off-season,maintain stable profitability by maximizing sales of premium & new growth products,enhancing cost structure, and by efficient allocation of resources
Performance and Outlook by DivisionPerformance*1)(Unit: %, KRW tn)Op. Margin10.5%2Q’19 Performance Sales : Declined YoY from lower demand in Europe, Latin America, etc. due tolack of major sporting events8.6%8.6%5.6%4.5%3.85HE (Home Entertainment)4.593.734.023.67 Profit : Increased marketing expenses from intensified competition caused byweak demand in major markets, and unfavorable F/X impact led profit declineSales3Q’19 ’1919.2Q2Q’19 Market : Expect global TV demand to stagnate YoYDemand for premium products such as OLED TV, UHD TV etc. to maintaingrowth trendKey Products LGE :LG Signature OLED TV WNanoCell TV*1) From 1Q'19, companion device business has been restated to 'HE division' from 'MC division'6Large screen premium products, OLED TV and NanoCell TV to drive sales growthDespite higher marketing expenses from intensifying competition,maintain solid profit structure through improving costs andefficient allocation of marketing resources
Performance and Outlook by DivisionPerformance*1)(Unit: %, KRW tn)Op. %1.511.61MC (Mobile Communications)2Q’19 Performance Sales : Despite a 7% QoQ increase driven by the launch of the new 5G model,sales fell 21% YoY due to slow sales of 4G premium models andintense market competition in mass-tier products Profit : Losses widened YoY and QoQ as marketing expense increased due to thelaunch of new models and one-off costs associated with the transfer ofdomestic production linesSales3Q’19 ’1919.2Q2Q’19 Market : Expect stagnant overall market demandCompetitors’ promotion activities to intensify in 5G market especially inKorea and North AmericaKey Products LGE :V50ThinQG8ThinQX6*1) From 1Q'19, companion device business has been restated to 'HE division' from 'MC division'7Increase sales from new competitive mass-tier models and continuous sales of5G productImprove cost efficiency from relocation of production lines and continue toimprove business structure
Performance and Outlook by DivisionPerformance(Unit: %, KRW tn)Op. Margin2Q’19 Performance Sales es 0.87VS (Vehicle Component Solutions)Increased 63% YoY and 6% QoQ driven by new projects in infotainment business,higher demand from major auto OEMs for electric vehicle components,and effects from consolidation of ZKW Profit : Although sales from CID product grew, delays in improving stability inmanufacturing process and initial production costs of other new projectsled lower profitability3Q’19 ’1919.2Q2Q’19 Market : Global auto market demand to slow down due to US-China trade disputes andrestructuring of major auto OEMsKey Products AV/AVN Telematics CIDInfotainment Devices8Demand volatility to grow due to regulatory policies regarding electric vehicles Traction Motor Inverter Battery PackxEV Solution ADAS Camera LCD Cluster Automotive LampSafety & ConvenienceDevices LGE :Closely monitor changes in external environment and regional/auto OEMs’policies and examine adjustment of the business portfolio from a long-termperspectiveFocus on stable supply of components to major OEMs and cost reductionactivities in the short-term
Performance and Outlook by DivisionPerformance(Unit: %, KRW tn)Op. sBS (Business Solutions)2Q’19 Performance Sales : Despite high level of price competition in low to mid-end signage market,the information display business grew slightly YoY driven by growth inpremium productsThe solar business grew YoY driven by increased demand ofhigh-power solar modules in the European market and increased sales fromresidential solar modules in the US market Profit : Profit increased driven by growth of premium product sales in the informationdisplay business, expansion of sales and improved productivity in thesolar module business3Q’19 ’1919.2Q2Q’19 Market : Expect Information display market to grow continuously driven byLED and premium productsKey ProductsThe solar module market demand to maintain growth in accordance tochanges in regional subsidy policies LGE :Information Display9Solar ModulesSecure growth in sales and profitability in premium product categoriesin Information display businessStrengthen the business fundamentals of the solar module business by targetingresidential solar modules in strategic regions and establishing regional portfolios
http://www.lg.com/global
AppendixSummarized Financial Statements (Consolidated)Income Statement(Unit: KRW bn, 0%14,915.1100.0%15,629.2100.0%Cost of goods 177.9%46,260.775.4%11,170.174.9%11,672.974.7%Gross 2.1%15,081.024.6%3,745.025.1%3,956.325.3%Selling & admin g income %-308.3-0.5%-44.9-0.3%-139.0-0.9%Net income before 3%754.45.1%227.11.5%Corporate Income 76.41.2%121.10.8%Net 2.4%578.03.9%106.00.7%Controlled 286.789.6232.77.114.4Financial income (Expense)Gains (loss) onequity method investmentOther non operatingincome (Loss)Non-controlled shares* Since the information regarding results of 2Q'19 has been prepared in advance, it is subject to change in the process of final review by external auditors10
AppendixSummarized Financial Statements (Consolidated)Statements of Financial Position(Unit: KRW 2.920,176.120,134.6Cash and cash 4.2Accounts 2,337.413,162.813,334.014,094.514,241.6Intangible ts ,811.516,306.916,939.717,095.0AssetsCurrent AssetsNon-current AssetsInvestmentPP&ELiabilitiesLease liabilityOther liabilities*1) Since the information regarding results of 4Q'18 has been prepared in advance, it is subject to change in the process of final audit by external auditorsEquity15,456.015,759.416,446.0* Since the information regarding results of 2Q'19 has been prepared in advance, it is subject to change in the process of final review by external auditors11
AppendixSales / Profits by Division (Consolidated)(Unit: KRW bn)1Q'18H&A2Q'183Q'184Q'18'18 Total1Q'192Q'19QoQYoYSalesOp. Income(%)SalesOp. Income(%)SalesOp. Income(%)SalesOp. Income(%)SalesOp. Income(%)SalesOp. 11.5%-29.8%LGE ConsolidatedExcludingLG Innotek (①)SalesOp. 3,728.2910.66.6%14,328.5641.24.5%4.4%3.7%LG Innotek (②)SalesOp. LG InnotekInter-company Transaction (③)SalesOp. .6181.7-1.4221.67.7SalesOp. 915.1900.66.0%15,629.2652.34.2%4.8%4.1%LGE Consolidated (① ②-③)HEMCVSBSOthers12* Since the information regarding results of 2Q'19 has been prepared in advance, it is subject to change in the process of final review by external auditors* From 1Q'19, robot business has been restated to 'Others' from 'H&A division'* From 1Q'19, companion device business has been restated to 'HE division' from 'MC division'
2 Consolidated Earnings and Outlook Income Trend / Cash Flow Cash Flow (Unit : KRW bn) Income Trend (Unit : KRW bn) 1Q'19 2Q'19 Cash at the beginning of period Cash flow from operating activities 437.5 765.6 Net income/loss 578.0 106.0 Depreciation 608.6 619.4 Gain/Loss on equity method investment 23.2 206.7 Cash flow from investing activities- 683.5 466.9