Transcription
Research Articlewww.acsami.orgFlame-Retardant Electrical Conductive Nanopolymers Based onBisphenol F Epoxy Resin Reinforced with Nano PolyanilinesXi Zhang,†,‡ Qingliang He,† Hongbo Gu,† Henry A. Colorado,§ Suying Wei,*,‡ and Zhanhu Guo*,††Integrated Composites Laboratory (ICL) Dan F. Smith Department of Chemical Engineering, Lamar University, Beaumont, Texas77710, United States‡Department of Chemistry and Biochemistry, Lamar University, Beaumont, Texas 77710, United States§Department of Mechanical and Aerospace Engineering, University of California Los Angeles, Los Angeles, California 90095, UnitedStatesS Supporting Information*ABSTRACT: Both fibril and spherical polyaniline (PANI) nanostructures havesuccessfully served as nanofillers for obtaining epoxy resin polymer nanocomposites (PNCs). The effects of nanofiller morphology and loading level on themechanical properties, rheological behaviors, thermal stability, flame retardancy,electrical conductivity, and dielectric properties were systematically studied. Theintroduction of the PANI nanofillers was found to reduce the heat-release rate andto increase the char residue of epoxy resin. A reduced viscosity was observed inboth types of PANI epoxy resin liquid nanosuspension samples at lower loadings(1.0 wt % for PANI nanospheres; 1.0 and 3.0 wt % for PANI nanofibers), theviscosity was increased with further increases in the PANI loading for bothmorphologies. The dynamic storage and loss modulii were studied, together withthe glass-transition temperature (Tg) being obtained from the peak of tan δ. Thecritical PANI nanofiller loading for the modulus and Tg was different, i.e., 1.0 wt %for the nanofibers and 5.0 wt % for the nanospheres. The percolation thresholds ofthe PANI nanostructures were identified with the dynamic mechanical property and electrical conductivity, and, because of thehigher aspect ratio, nanofibers reached the percolation threshold at a lower loading (3.0 wt %) than the PANI nanospheres (5.0wt %). The PANI nanofillers could increase the electrical conductivity, and, at the same loading, the epoxy nanocomposites withthe PANI nanofibers showed lower volume resistivity than the nanocomposites with the PANI nanospheres, which werediscussed with the contact resistance and percolation threshold. The tensile test indicated an improved tensile strength of theepoxy matrix with the introduction of the PANI nanospheres at a lower loading (1.0 wt %). Compared with pure epoxy, theelasticity modulus was increased for all the PNC samples. Moreover, further studies on the fracture surface revealed an enhancedtoughness. Finally, the real permittivity was observed to increase with increasing the PANI loading, and the enhanced permittivitywas analyzed by the interfacial polarization.KEYWORDS: epoxy resin nanocomposites, filler polymer interaction, viscoelastic property, tensile properties,nanospheres and nanofibersfibers with a conductive coating22 have been attempted toincrease its electrical conductivity (σ). However, easy oxidationand high density of the metal particles on one side cause areduced conductivity and heavy weight of the final products,23which will definitely challenge the required device and structureminiaturization.24,25 On the other side, the easy agglomerationof CNTs and CNFs is always deleterious to the mechanicalproperties of the final finishings, and the required surfacetreatments for their better dispersion increase the nanocomposite cost.26,27 Polyaniline (PANI), among all theconjugated polymers, is more attractive, because of its1. INTRODUCTIONThe development of conductive or semiconductive polymernanocomposites (PNCs) from insulating polymers hasattracted more interest, because of the introduced uniquephysicochemical properties to the otherwise inert hostingpolymers, such as thermal stability,1 3 magnetic,4 6 optical,7 9and dielectric properties.10 13 Epoxy as one of the mostimportant engineered polymers has drawn attention because ofits wide applications, including structural materials, tissuesubstitutes,14 anticorrosion coatings,15 and flame-retardantadditives.16 However, the industrial deployments of epoxyresin are largely limited by the static electricity problem.Different types of conductive fillers such as carbon nanofibers(CNFs),17,18 carbon nanotubes (CNTs),19 iron nanoparticles,20copper and nickel powders,21 and electrically conductive glass 2012 American Chemical SocietyReceived: November 3, 2012Accepted: December 28, 2012Published: December 28, 2012898dx.doi.org/10.1021/am302563w ACS Appl. Mater. Interfaces 2013, 5, 898 910
ACS Applied Materials & InterfacesResearch Articlecontrollable doping levels.28 33 However, PANI synthesized inthe classical approaches from aniline, oxidant, and smallmolecule acid34 has very poor solubility in common solventssuch as ethanol, methanol, and acetone.35 PANI nanostructureswith large interfacial areas between PANI and theirsurroundings36 can have an improved dispersibility in thehosting matrixes.In addition to the increased conductivity,37 the epoxy-PANIcomposites have other certain unique properties.38,39 Forinstance, a high dielectric constant is observed in the PANI epoxy composites fabricated by the in situ polymerizationmethod.40 Oligomeric PANI (o-PANI) shows a very lowthreshold value.41 PANI can even act as a curing agent forepoxy resin with covalent bondings formed between the aminegroups of PANI and epoxy resin, and the heat of curingincreases as the PANI loading increases.42 Although theelectrical conductivity of the epoxy-PANI nanocomposites hasbeen achieved by increasing the loading43 or decreasing thesize44 of PANI, the morphology effect has not been studied yet.In addition, a comprehensive study on the rheologicalbehaviors, flame retardancy, and dynamic mechanical propertiesof these epoxy nanocomposites filled with soft polymernanostructures has been rarely reported.Generally, two types of nanoparticles are applied to enhancethe flame retardancy of the polymer matrix. One is theinorganic nanoparticles including alumina trihydrate,45 layereddouble hydroxides (LDHs),46 clay,47 and montmorillonite(MMT).48 However, the flame retardancy of the nanocomposites with inorganic nanoparticles largely depends ontheir dispersion quality.45 Because of the poor compatibilitybetween organic and inorganic materials, additional surfacemodification49 or compatibilization50 is normally deployed toachieve good dispersion of silicate nanoparticles in the polymermatrix. The other type of additive is organic nanoparticles, suchas phosphorus-based51 53 and nitrogen-based flame retardants,including melamine and its derivatives.54 For flame retardantswith phosphorus functional groups, during the decompositionprocess, the phosphorus-rich layer can be formed on the surfaceof residues and be separated from heat source.55 However, thephosphorus-based flame retardants demand that the matrixcontain oxygen or nitrogen atoms to promote char formation,which prevent further combustion. Otherwise, coadditives arerequired to act as charring agents.53 During the research ofnanocomposite flame retardancy, the nitrogen-based flameretardants have attracted more and more interest, because oftheir efficient performance that can function in all the burningstages. These nitrogen-based flame retardants can lead toendothermic reactions,54 which will release ammonia gases athigher temperature to dilute oxygen and combustible gases.53In addition, the nitrogen-based flame retardants can enhancethe char formation. For instance, the melamine cyanurate(MCA), which was used to improve the flame retardancy ofpolyamide 6 (PA6) nanocomposites, can promote thegeneration of carbonaceous char in the condensed phase andfurther slow the degradation of the matrix.48 PANI, whichcontains the nitrogen compounds in the side chain andaromatic ring, has potential applications as flame retardants.56However, limited research about its flame retardancy propertyin epoxy matrix has been reported.In this paper, two different laboratory-synthesized PANInanostructures nanofibers and nanospheres were applied asconductive nanofillers in epoxy resin to enhance the electricalconductivity and increase the fire retardancy performance. ThePNCs with different loading level and morphology of PANInanofillers were prepared. The rheological behaviors of theuncured samples (liquid phase) were studied including steadystate viscosity and complex viscosity, together with the storageand loss modulii. And, for all the cured samples (solid phase),the thermal stability was studied by thermogravimetric analysis(TGA) test and the flame retardancy performance wasevaluated by microscale combustion calorimetry, consideringthe heat release capacity (HR capacity), peak heat release rate(pHRR), total heat release, and the char residue. Thethermomechanical properties, including storage and lossmodulii, and glass-transition temperature were evaluatedtogether with the tensile strength and Young’s modulus. Theeffects of PANI loading and morphology on the electricalconductivity and dielectric property also were systematicallystudied. The observed enhanced dielectric properties wereinterpreted by the interfacial polarization.2. EXPERIMENTAL METHODS ANDCHARACTERIZATION2.1. Materials. The epoxy resin Epon 862 (bisphenol Fepoxy) and EpiCure W curing agent were purchased from theMiller Stephenson Chemical Company, Inc. The molecularstructures of these chemicals are shown in Scheme S1 in theSupporting Information. Aniline (C6H7N), ammonium persulfate (APS, 98 wt %, (NH4)2S2O8), and p-toluene sulfonic acid(PTSA, 98.5 wt %, C7H8O3S) were all purchased from Sigma Aldrich. Chloroform (CHCl3) was purchased from FisherScientific. All of the chemicals were used as received withoutany further treatment.2.2. Preparation of PANI Nanofibers (NFs). PANI NFswere prepared by an interfacial polymerization method with ananiline:APS:PTSA ratio of 8:2:25. Briefly, aniline (3.2 mmol)was dissolved in chloroform (10 mL) as Solution 1, andSolution 2 was prepared by dissolving APS (0.8 mmol) in 1.0M PTSA aqueous solution (10 mL). Then, Solution 2 wasadded into Solution 1 quickly and maintained still for 2 h ofpolymerization at room temperature. The product was vacuumfiltered and washed with ethanol and deionized water toremove any possible oligomers, excess acid, and extra organicsolvent. The obtained powders were dried completely at 50 C.2.3. Preparation of PANI Nanospheres (NSs). The molarratio used in this method was aniline:APS:PTSA 6:3:5. ForSolution 1, PTSA (60 mmol) and APS (36 mmol) weredissolved in deionized water (400 mL) in a beaker andultrasonicated in an ice water bath for 1 h. Solution 2 wasaniline (72 mmol) dissolved in deionized water (100 mL).Solution 2 then was added into Solution 1 and the mixture wassonicated for an additional hour in an ice water bath forpolymerization. Finally, the product was vacuum-filtered andwashed with ethanol and deionized water to remove anypossible oligomers, excess acid, and organic solvent. Theobtained powders were dried at 50 C.2.4. Preparation of PANI Epoxy Nanocomposites.Epoxy resin suspensions with 1.0, 3.0, 5.0, and 10.0 wt % ofPANI NFs and NSs were prepared. First, PANI nanostructureswere immersed in epoxy resin (the total weight of epoxy resinand curing agent was fixed to 40.0 g, and the PANI loading inepoxy resin was controlled by varying the weight of PANInanostructures) without any disturbance overnight so that theresin could wet the nanostructures completely. The mixturewas then mechanically stirred (Heidolph, Model RZR 2041) ata speed of 600 rpm for 1 h at room temperature. The Epicure899dx.doi.org/10.1021/am302563w ACS Appl. Mater. Interfaces 2013, 5, 898 910
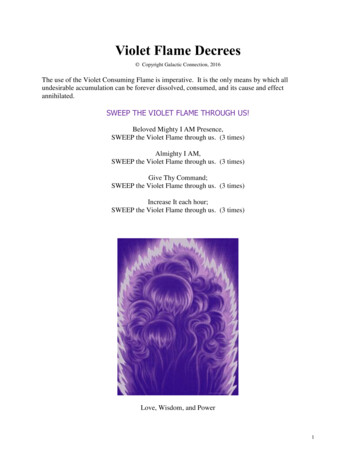
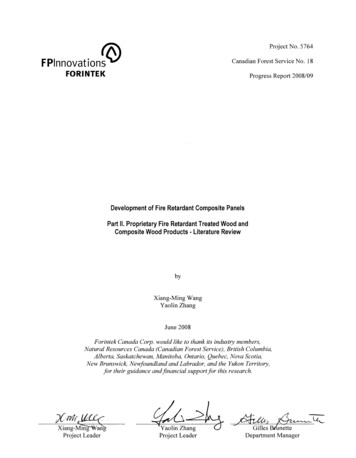
ACS Applied Materials & InterfacesResearch Article200 C. The sample dimensions were 12 mm 3 mm 40mm.Tensile tests were carried out following ASTM methods(Standard D 412-98a, 2002) in a unidirectional tensile testingmachine (ADMET tensile strength testing system). Theparameters (displacement and load) were controlled by adigital controller (MTEST Quattro) with MTESTQuattroMaterials Testing Software. The samples were prepared asdescribed for the nanocomposite fabrication in silicon rubbermolds, which were designed according to the standard ASTMrequirement. A crosshead speed of 1.00 mm/min was used andthe strain (mm/mm) was calculated by dividing the crossheaddisplacement by the original gauge length.2.10. Morphological Characterizations of PANI Epoxy Nanocomposites and PANI Nanostructures.After the tensile test, the broken samples of the PANI epoxynanocomposites were collected. The morphology of thefracture surfaces and the morphology of PANI nanostructureswere characterized with a field-emission scanning electronmicroscope (SEM) (JEOL, Model JSM-6700F). Before testing,the samples were first coated with a thin gold layer.2.11. Resistivity and Permittivity Measurements ofCured PANI Epoxy Nanocomposites. The volume resistivity was determined by measuring the DC resistance along thedisc samples with diameters 60 mm. An Agilent Model 4339Bhigh-resistance meter was used to measure the samples. Thisequipment allows resistance measurement up to 1016 Ω. Thereported values represent the mean value of eight measurements with a deviation of 10%.The dielectric permittivity was measured by a LCR meter(Agilent, Model E 4980A) equipped with a dielectric test fixture(Agilent, Model 16451B) in the frequency range of 20 Hz 2MHz. The samples used for the tests were disk pellets with adiameter of 40 mm and the average thickness was 2 mm. Apiece of rectangular standard Teflon sample with a permittivityof 2.1 2.4 was used for calibration before each test.W curing agent was added into the above suspension with aweight ratio of monomer/curing agent of 100/26.5, asrecommended by the company, and the solution was stirredat high speed (600 rpm) for another hour at room temperature.In order to remove bubbles in the solution and prevent thesettlement of PANI nanofillers during the curing process, lowspeed (200 rpm) mechanical stirring was conducted at 70 Cfor 3 4 h in a water bath. Finally, the solution was poured intosilicon rubber molds and cured at 120 C for 5 h and thencooled naturally to room temperature.2.5. Rheological Behaviors of Liquid Epoxy ResinNanosuspensions. The rheological behaviors of the epoxyresin nanocomposite suspensions, were investigated with arheometer (AR 2000ex, TA Instrumental Company) at shearrates ranging from 0.1 rad/s to 1200 rad/s at 25 C (thesamples are a mixture of only epoxy monomers andnanofillers). A series of measurements were performed in acone-and-plate geometry with a diameter of 40 mm and atruncation of 64 μm. Dynamic rheological measurements werealso performed with a sweeping frequency range between 0.1s 1 and 1000 s 1 at a low strain (1%), which was justified to bewithin the linear viscoelastic (LVE) range for these materials.The LVE range was determined by the strain-storage modulus(G′) curve within the strain range from 0.01 to 100 at afrequency of 1 rad/s. Specimens placed between the cone andplate were allowed to equilibrate for 2 min prior to eachfrequency sweeping.2.6. Fourier Transform Infrared Spectroscopy (FT-IR).The FT-IR spectroscopy (Bruker, Inc., Model Vector 22,coupled with an ATR accessory) was used to characterize thesurface functionality of pure PANI nanostructures, pure epoxyresin, and PANI NFs treated with epoxy resin in the range of500 4000 cm 1 at a resolution of 4 cm 1.2.7. Thermal Characterization of PANI Epoxy Nanocomposites. The thermal stability of the cured PANI epoxyPNCs was studied via thermogravimetric analysis (TGA) (TAInstruments, Model Q-500). All the samples were heated from30 C to 700 C with a nitrogen flow rate of 60 mL/min and aheating rate of 10 C/min. The samples were tested in aircondition with the same flow rate and heating rate to comparethe thermal stability of PNCs under different conditions.Differential scanning calorimetry (DSC) (TA Instruments,Model Q2000) measurements were implemented under anitrogen flow rate of 20 mL/min at a heating rate of 10 C/min from 0 C to 400 C.2.8. Flame Retardancy Characterization of CuredEpoxy Nanocomposites. The flame retardancy performancewas evaluated by using a microscale combustion calorimeter(MCC) (Model MCC-2, Govmark, Farmingdale, NY),according to American Society for Testing and Materials(ASTM D7309, Method A). The sample ( 3 mg) was heatedto a specified temperature using a linear heating rate (1 C/s)in a stream of nitrogen at a flow rate of 80 mL/min. Thethermal degradation products of the sample in nitrogen weremixed with a 20 mL/min stream of oxygen prior to entering the900 C combustion furnace. The reported MCC parameterswere the averages of three measurements.2.9. Mechanical Characterization of Cured EpoxyNanocomposites. Dynamic mechanical analysis (DMA)measurements were carried out in the torsion rectangularmode using a Model AR 2000ex system (TA InstrumentalCompany) with a strain of 0.05%, a constant frequency of 1 Hz,and a heating rate of 2 C/min in the temperature range of 30 3. RESULTS AND DISCUSSION3.1. PANI Nanofibers and Nanospheres. Two differenttypes of PANI nanostructures were synthesized by two differentmethods and used as conductive nanofillers to enhance theproperties of epoxy. Interfacial polymerization method yieldedPANI nanofibers, while PANI nanospheres were obtained byusing ultrasonication (see Figure 2). Compared with PANInanospheres with an average diameter of 370 nm, PANInanofibers have an average diameter of 142.7 nm and length of1.00 μm (Figure 2). In addition, because of the higher aspectratio, the PANI nanofibers exhibit larger specific surface areathan the PANI nanospheres.57 However, the PANI nanospheres have a better thermal stability than nanofibers innitrogen condition (see Figure 1A). For both PANI nanofillers,a slight weight loss stage can be observed from roomtemperature to 150 C, which is attributed to the release ofmoisture and organic solvent residue entangled in the polymerchains.58 The flame retardancy behaviors of these two PANInanofillers were also studied and the heat release capacity (HRcapacity), peak heat release rate (pHRR), total heat release, andchar residue are summarized in Table 1. The PANInanospheres are observed to have a higher decompositiontemperature (285.69 C) than the PANI nanofibers (260.45 C) (Figure 1B), which is consistent with the TGA result.However, the total heat release of the PANI nanofibers werelower than those of the PANI nanospheres. Although the onset900dx.doi.org/10.1021/am302563w ACS Appl. Mater. Interfaces 2013, 5, 898 910
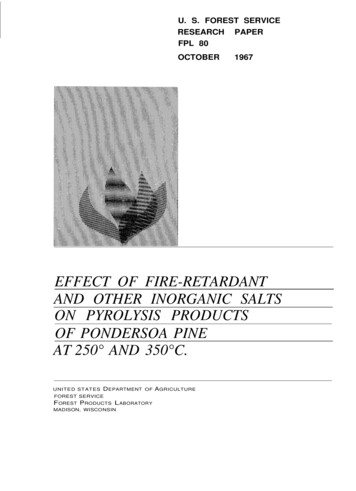
ACS Applied Materials & InterfacesResearch ArticleTable 1. Heat Release (HR) Capacity, Peak Heat ReleaseRate (pHRR), Total Heat Release and Char Residue for theCured Pure Epoxy, PANI Nanofibers, PANI Nanospheres,and PNCs with PANI Nanofibers and Nanospherescured pure epoxyPANI nanofibersPANI nanospheresPNCs with 1.0 wt %PANI nanofibersPNCs with 3.0 wt %PANI nanofibersPNCs with 5.0 wt %PANI nanofibersPNCs with 10.0 wt %PANI nanofibersPNCs with 10.0 wt %PANI nanospheresHR capacity(J/(g K))peak HRR(W/g)total 013243325.623.72128538124.9183.2. Rheological Behaviors of PANI-Epoxy ResinNanosuspensions. The rheological behaviors were testedfor pure epoxy resin and its nanosuspensions containing PANInanofillers. The increase of shear stress is almost linear withincreasing the shear rate. (The detailed results of shear stress vsshear rate are shown in Figure S1 in the SupportingInformation.) The viscosity is observed to decrease as theshear rate increases (see Figures 3A and 3B). However, not allFigure 1. (A) TGA curves and (B) the HRR temperature curves ofPANI nanofibers and PANI nanospheres.Figure 2. SEM microstructures of PANI nanofibers and nanospheres.decomposition temperature of the PANI nanofibers is lower,the heat release process concentrates on a narrow temperaturerange ( 260 400 C), after reaching the pHRR, the HRRvalue decreases sharply with increasing temperature. However,for the PANI nanospheres, the heat release process takes placeover a wide temperature range ( 285 650 C), compared withthe PANI nanofibers, the HRR value of the nanospheresmaintains a large number in the temperature range of 400 600 C. This phenomenon can also be observed in the TGAthermal stability study (Figure 1A). The PANI nanofibersexhibit a sharp weight loss; however, the PANI nanospheresdecompose slowly over a wide temperature range. (Thedifferential thermogravimetry (DTG) result is shown in FigureS2 in the Supporting Information.) Thus, the total heat releaseof the PANI nanofibers is lower than those of the PANInanospheres.Figure 3. Viscosity versus shear rate of (A) pure epoxy resin and itsnanosuspensions with different PANI nanofiber (NF) loading, and (B)pure epoxy resin and its nanosuspensions with different PANInanosphere (NS) loading.901dx.doi.org/10.1021/am302563w ACS Appl. Mater. Interfaces 2013, 5, 898 910
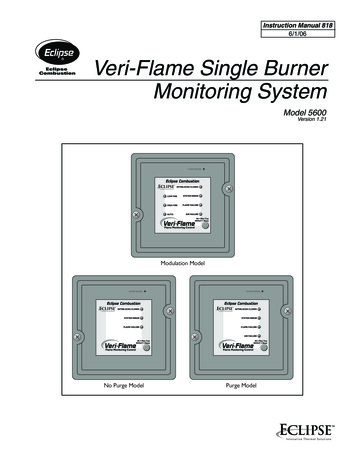
ACS Applied Materials & InterfacesResearch ArticleFigure 4. Complex viscosity (η*), G′, and G″ vs ω of (A) pure epoxy resin and (B) epoxy resin nanosuspensions with 1.0 wt % PANI nanofibers;(C) viscosity vs shear rate of pure epoxy resin and epoxy resin nanosuspensions with 1.0 wt % PANI nanofibers (the inset shows the limited shearrate scale from 0 to 20 rad/s); and (D) δ vs frequency of pure epoxy resin and epoxy resin nanosuspensions with 1.0 wt % PANI nanofibers.of these behaviors can be considered as shear-thinning process(for polymer fluid, the shear force can induce thedisentanglement of polymer chains, which will further alignalong the shear direction59 to cause a decreased shear viscositywith increasing the shear rate60). The identification of shearthinning process was further studied with the complex viscosity.Figures 4A and 4B show the storage modulus (G′), lossmodulus (G″), and complex viscosity (η*) of liquid samples ofpure epoxy resin and its nanosuspensions with 1.0 wt % PANInanofibers, respectively. For pure epoxy resin, no crossing pointof G′ and G″ can be observed in the test range (Figure 4A).The crossing point of the G′ and G″ curves can serve as acriteria to identify the switch from viscous liquid to elasticsolid.17 During the frequency sweep test, the angular frequency(ω) was varied from 100 rad/s to 0.1 rad/s. Pure epoxy resincannot form a solidlike elastic network by itself, and the valueof G″ is higher than G′. The gap between these two moduliiincreased with increasing frequency. However, for epoxy resinnanosuspensions with 1.0 wt % PNAI nanofibers at higher ω,G″ was higher than G′, which was the same as pure epoxy resin,the crossing point of G′ and G″ is shown at a frequency of 60rad/s; with further decreases in ω (lower than 60 rad/s), G′became larger than G″ (Figure 4B). This crossing pointrepresents the fluid property changing from viscous to elastic.Thus, the addition of PANI nanofibers favors the formation ofthe cross-link among epoxy resin and causes the transition fromviscous behavior in the high-frequency range to elastic behaviorin the low-frequency range.The complex viscosity of pure epoxy resin is constant in theentire frequency range (Figure 4A). However, for the epoxyresin nanosuspensions with 1.0 wt % PANI nanofibers, thecomplex viscosity is decreased as the frequency is increased(Figure 4B). The complex viscosity can be transferred to asteady-state viscosity (viscosity obtained from a ramp-strainexperiment61) with shear rate, using the Cox Merz rule (see eq1):62η(γ )̇ η*(ω) ω γ ̇ G ′ 2 G ″ 2 ω ω ω γ ̇(1)where η(γ̇) is the steady-state viscosity; η*(ω) is the complexviscosity; G′ and G″ are storage and loss moduli, respectively;ω is the angular frequency; and γ̇ is the shear rate (when ω γ̇,the value of the complex viscosity is equal to that of the steadystate viscosity). At low shear rate (below 100 s 1), for pureepoxy resin, the steady-state viscosity (transferred fromcomplex viscosity) is constant with increasing the shear rate,which follows Newtonian fluid flow (see Figure 4C). However,for epoxy resin nanosuspensions with PANI nanofillers, theshear viscosity decreases sharply with increasing the shear rate,which is the feature of a pseudo-plastic (shear thinning) fluid.As shown in the steady-state test (Figure 3), at lower loadingsof PANI nanofibers (1.0 and 3.0 wt %) and nanospheres (1.0wt %), with the shear rate increases, the structure of thenanosuspensions would be destroyed and the viscositydecreased to even lower than that of pure epoxy resin.However, with the loading of PANI nanostructures furtherincreased, the interaction between the PANI nanostructuresand the epoxy would become stronger, thus, the viscosity of thenanosuspensions is higher than that of pure epoxy.To further confirm the fluid type, another parameter isintroduced by using oscillation test of the liquid samples. Theterm delta (δ), representing the phase angle between G″ andG′, is also obtained as a function of angular frequency. Thephase angle of pure epoxy resin is almost 90 (see Figure 4D),902dx.doi.org/10.1021/am302563w ACS Appl. Mater. Interfaces 2013, 5, 898 910
ACS Applied Materials & InterfacesResearch ArticleFigure 5. (A) FT-IR spectra, (B) DSC, and (C) TGA curves of pure epoxy resin, pure PANI nanofibers (NFs), and PANI NFs treated with epoxyresin.Figure 6. (A) DSC curves of the cured pure epoxy and its PNCs with different loading levels of PANI nanofibers and nanospheres, (B) TGA curvesof the cured pure epoxy and its PNCs with different loading levels of PANI nanofibers and nanospheres in nitrogen, and (C) TGA curves of thecured pure epoxy and its PNCs with 10.0 wt % loading of PANI nanofibers and nanospheres in air.903dx.doi.org/10.1021/am302563w ACS Appl. Mater. Interfaces 2013, 5, 898 910
ACS Applied Materials & InterfacesResearch Articleindicating a Newtonian fluid.63 Thus, the decreased viscosity inpure epoxy resin sample is not a shear thinning phenomenon; itshould be caused by sample splashing under high rotating speedof cone. However, for the epoxy resin nanosuspensions with 1.0wt % PANI nanofibers, δ is way below 90 (Figure 4D),demonstrating that these nanosuspensions follow shearthinning flow, which is obviously shown in the complexviscosity study (see Figure 4C). Thus, the epoxy resinnanosuspensions with PANI nanofillers belong to a pseudoplastic fluid. Actually, from Figure 4C, the zero-shear viscosity(limiting viscosity at zero shear rate,64 η0 lim η) of the epoxyresin,67 which provides more space for polymer chain segmentsto move, even at a lower temperature. However, when thenanofiller loading is increased to a certain point, the Tg valuewill increase as the loading of PANI nanofillers increases andthe changing point of Tg from decrease to increase occurs at adifferent loading, i.e., 5.0 wt % for nanofibers and 10.0 wt % fornanospheres. The restrained movement of epoxy chains is dueto the formed covalent bondings between epoxy matrix and theamine groups in PANI,42 which cause an increase in Tg. Thus,the variation of Tg in the PNCs is a competition between twoeffects, i.e., enlarged free volume and interaction between PANInanofillers and epoxy matrix. In the PNCs at lower PANIloading level, the free volume effect is dominating, Tg firstdecreases with increasing the PANI loading. However, whenthe PANI loading is increased to a certain level, Tg becomeslargely dependent on the covalent bonding and increases as thePANI loading increases.The variation of Tg from decrease to increase can beconsidered as a criterion to identify the percolation threshold inepoxy resin.68 Epoxy resin blended with carbon nanotubes(CNTs) and polypyrrole (PPy) has been studied by Barrau etal.68 The content of filler near the percolation threshold wasfirst obtained by the dc conductivity, and a minimum Tg studiedby DSC and dynamic mechanical thermal analysis (DMTA)tests and change of storage modulus were shown in the samerange of loading for the percolation threshold to take place. Arelationship between the electrical percolation and the Tgvariation is built. A similar minimum Tg and variation tendencyare observed as the nanofiller loading was increased.Specifically, the Tg value first decreases, and, after reachingthe lowest point, it begins to increase as the nanofiller loadingincreases. It is worth noting that the minimum Tg value isshown at different loadings for the PNCs with nanofibers (3.0wt %) and nanospheres (5.0 wt %). This variation is associatedwith morphology difference between the nanofibers and thenanospheres. For the PANI nanofibers with a larger aspectratio, it would be easy to form a network than the PANInanospheres in the matrix resin.263.5. Thermogravimetric Analysis of Cured EpoxyResin and its Nanocomposites. Figure 6B shows the TGAcurves of the cured pure epoxy and its PNCs with two differentPANI nanostructures in nitrogen. For all the samples, there isonly one sharp weight loss stage, which is caused by the chainbreakdown of the polymer structure. From the onsetdecomposition temperature (extrapolated onset temperatureis obtained by software and the temperature range is set to200 400 C) summarized in Table 2, the introduction of thePANI nanofillers in the epoxy resin causes the decompositiontemperature decrease, which is attributed to the lowerdecomposition temperature of pure PANI nanofibers (235.15 C) and PANI nanospheres (251.73 C) than that of pureepoxy. Similarly, because of the higher decomposition temperature of the pure PANI nanospheres than that of the PANInanofibers (Figure 1A), the PNCs with nanospheres exhibit anhigher onset decomposition temperature than that of the PNCswith nanofibers at the same filler loading (Table 2).However, when the test was run in air (Figure 6C), differentfrom the results obtained in a nitrogen environment, twoweight loss stages are observed. The first degradation stage inair is almost the same as tha
Flame-Retardant Electrical Conductive Nanopolymers Based on Bisphenol F Epoxy Resin Reinforced with Nano Polyanilines Xi Zhang,†,‡ Qingliang He,† Hongbo Gu,† Henry A. Colorado,§ Suying Wei,*,‡ and Zhanhu Guo*,† †Integrated Composites Laboratory (ICL) Dan F. Smith Department of Chemical Engineering, Lamar University, Beaumont, Texas 77710, United States