Transcription
BE 2018Green Gauges09 March 2018Green GaugesA design methodology at Williams College
BE 2018Green Gauges09 March 2018At the conclusion of this session, participants will be able to: understand the value of systems thinking and early designcommunication calculate and compare operational carbon benefits of specificdesign strategies define and contrast site energy and source energy and CO2equivalent greenhouse gas emissions critique the Green Gauges approach based on their ownexperienceLearning Objectives
BE 2018Green GaugesSchedule:Agenda10 min AmyIntroduction and Goals5 minLooking back- past projectsTom10 min Amy/TomGreen Gauges framework10 min TomCurrent projects15 min AndyWhat’s next?site EUI vs source?eCO2 per sf 10 minQuestions and Discussion09 March 2018
BE 2018Green Gauges09 March 2018Williams College Founded 17932000 undergraduates110 buildings 2 billion endowmentFirst GHG reduction goalsin 2007 Additional goals in 2010
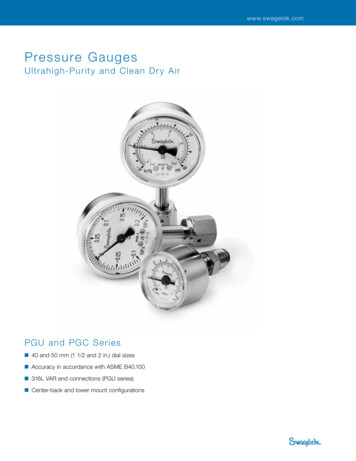
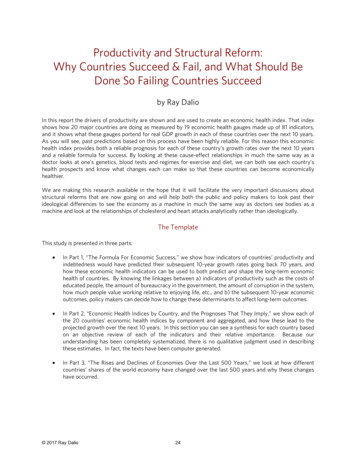
BE 2018Green Gauges09 March 2018Williams College Emissions By Scope40,00035,000Air and Car TravelMetric tons 000Heating and hot 020012002200320042005Fiscal YearWilliams College Emissions by 017
BE 2018Green Gauges09 March 201830,000Metric Tons eCO225,00020,00015,000Thermal Conservation10,000Electric ConservationRenewable Electricity PurchaseLocal Offsets5,000Remaining emissions35% below 199002014201520162017Fiscal year201820192020
BE 2018Green Gauges09 March 2018High performance buildings are important – but what are wegetting for our investment?LEED GOLDLEED GoldNet ZeroLEED PlatinumLiving Building ChallengeLEED Platinum?Platinum?LEEDPassive HouseNocertification
BE 20182008 - 2014Green Gauges2014 - 2016LEED Gold afterthe factLEED Gold atproject start(w/a dash ofLBC)Massive envelopeissues andoperationalchallengesSome envelopeissues and lessthan efficientinvestmentsHistorical & Future Building Standards2016 - 2017LEED Gold EUItarget09 March 20182018 - 20202020 - ?LEED Gold (Netzero, PassiveHouse) EUItarget GGPetalcertification/netzero EUI target GG
BE 2018Green Gauges09 March 2018What to measure? Incremental cost of high performance What’s the baseline?Benefit: carbon reduction Site? Source? Lifetime? Annual?Benefit: Energy cost savingsSee above – what’sBenefit: Operational cost savings the baseline? Then combine somehow into a unified metric!Annual carbon/incremental cost?Lifetime carbon/incremental cost?Net present value/incremental cost? Easy, right?Fun, though.
BE 2018NPV including avoided social costsGreen Gauges09 March 2018
BE 2018NPV including avoided social costsGreen Gauges09 March 2018
BE 2018Green Gauges09 March 2018
BE 2018Green Gauges09 March 2018
BE 2018Green GaugesBiophilic moment- all photos courtesy of Ethan Drinker Photography09 March 2018
BE 2018Green Gauges09 March 2018In the context of carbon reductions,three questions are being asked:1. What specifically is the College doing?2. What does it cost?3. What are the savings?We were asked to:develop a methodology to track this effort in new projectsand retroactively evaluate past projectsThe effort has been named Green Gauges:gauge gāj - an instrument or device for measuring the magnitude,amount, or contents of something, typically with a visual display ofsuch informationWhat is Green Gauges and Why?
BE 2018Green Gauges09 March 2018Horn Halldesigned by Centerline Architects, analysis by Karpman AssociatesPast Projects- Typical Energy Conservation Measures (ECM)
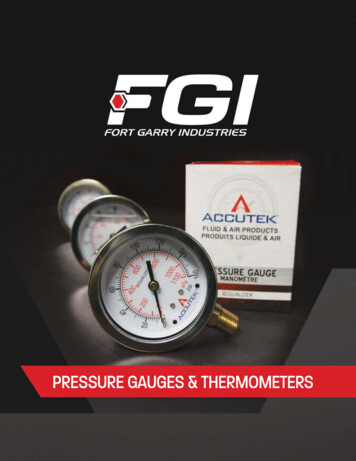
Williams CollegeBE 2018Green Gauges7/29/16Green Gauges09 March 2018The LogConstruction - Occupancy2015Total Project Cost 4,500,000Area (square feet)7,890StrategyAdditional DesignEnhanced CommissioningModeled Annual Energy Savings from Existing Baseline (185,000 kWh per year)% TotalProjectkWh saved% BaseTotal 35,0000.8%-0 7,2000.2%-0CostEnhanced Envelope 75,0001.7%50,00027%Photovoltaic Panels 79,3901.8%18,00010%ByComponent CommentsMEP, Energy Consultant, Arch- blowerdoor testing, LEED evaluation, but notCertifiedTriple glazed windows, exteriorinsulation, air tightnessUpgrade Equipment 10,0000.2%4,0002%Modulating Kitchen Hood and EfficientCoolersHVAC 75,0001.7%30,00016%ERV and VFD's multiple zonesTotal 281,5906.3%EUI 69 kbtu/sf/year (NIC pv)Note: Saving on existing consumption- NOT CODEDesigned by c&h architects, analysis by Energy BalancePast Projects- Pulling out data afterwards
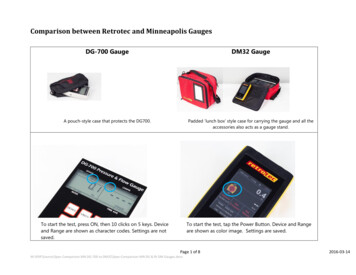
c&h architectsBE 2018Green Gauges09 March 2018Williams College- Project SummariesDecember 2016ProjectBaseline modelingstandard% better thanbaselineWilliams InnAppendix G- 2013Appendix G- 2007CDE Residence HallN/A as not LEEDafter schematicScience Center- SouthAppendix G- 200731.6%Science Center- NorthAppendix G- 200725%Williams BookstoreAppendix G- 2007Horn HallAppendix G- 2007With modificationsAppendix G- 2007ExemptAppendix G- 2007Weston HallThe LogWeston FieldKellogg ! ! ! ! !26%37%% better thanStretch code16%(new code)Energy Use Intensity (EUI) Kbtu/sf/yearNot including pvDESIGN60 DesignBASELINE95 Weighted CBECS109 Existing Inn23 Design20 with EEM1 EEM2138 Design227 Baseline89 Design120 Baseline41%11.6%(old code)5%(old code)21%39 Design66 Baseline52%32%30 Design73 BaselineN/A18.9%44 Design75 Design68 Design19 Design61 Baseline119 Existing and unoccupied.115 Baseline18%34%38.9%Appendix G is the Building Performance Rating Method of ASHRAE Standard 90.1.The past stretch code required commercial building over 100,000 sf to be 20% better than the 2007 version of Appendix G.A building between 5,000 and100,000 sf may either be 20% better than Appendix G, or comply with the prescriptive requirements of the code.The new stretch code (effective Jan 1, 2017) requires 100,000 sf buildings to be 10% better than Appendix G- 2013 (which is more stringent than 2007).Smaller buildings must comply with the International Energy Conservation Code (IECC) 2015 or ASHRAE 90.1.LEED V3 requires all new buildings to be 10% better than the equivalent Appendix G-2007 building on a cost of energy basis.CBECS is the U.S. Energy Information Administration’s Commercial Buildings Energy Consumption Survey.candharchitects.comProject EUI summary sheet49 S. Pleasant St. Suite 301 Amherst, MA 01002413.549.3616
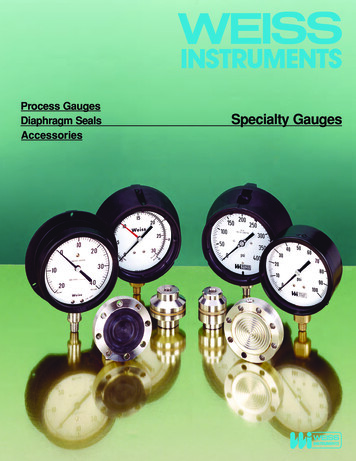
BE 2018Green Gauges09 March 2018EUI Reductions (kBtu/sf)Science Center - South227138The LogWeston FieldHorn HallWilliams BookstoreWeston Hall1191157366617568443930Baseline EUIProject EUI- Code verses designProjected EUI
BE 2018Green Gauges09 March 2018Key Green Gauges deliverables from the design team10% Schematic Design –Goals and Feasibility are established (A).Energy metrics and comparisons.30% Schematic DesignSystems & Metering Narrative (B)Simple descriptions of various design elements.25% Design DevelopmentUpdated Narratives & Value Assessments (C)Cost, energy savings, and carbon reduction.70% Design DevelopmentMetering Diagram(D)Show the components of multiple systems in one diagram.Then follow up during and after Construction (E & F).Most decisions are made in Schematic Design
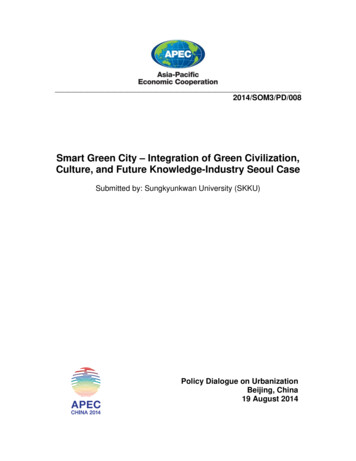
BE 2018Green Gauges09 March 2018GREEN GAUGESREQUEST FOR PROPOSALSPROGRAMMINGGOAL ASSESSMENT10% SCHEMATIC DESIGNDESIGN TEAM DELIVERABLE AEUI SUMMARYSPACE NEEDS EUI DATA ANNUAL ENERGY TARGETDEVELOP SOLUTION CONCEPTSSITEENVELOPEACTIVE SYSTEMS (MEP)IAQPASSIVE SYSTEMSRESILIENT NSTRUCTION30% SCHEMATIC DESIGNDESIGN TEAM DELIVERABLE BSYSTEMS & METERING NARRATIVEDESIGN TEAM DELIVERABLESUSTAINABILITY CHARRETTEOWNER REVIEW AND COMMENTSCHEMATICDESIGNCOMMISSIONING: REVIEW AND COMMENTUPDATE SYSTEMS DESIGN NARRATIVELOADS ANALYSIS BY COMPONENTPACKAGE FOR PRICINGLIST CHOSEN STRATEGIES AS ALTERNATESDESIGN TEAM DELIVERABLE3RD PARTY PRICING BY ESTIMATORCM125% DESIGN DEVELOPMENTDESIGN TEAM DELIVERABLE CVALUE ASSESSMENT50% DESIGN DEVELOPMENTREVIEW OF SCHEMATIC ESTIMATEOWNER REVIEW AND APPROVALDEVELOP STRATEGIESDESIGNDEVELOPMENTOWNER REVIEW AND APPROVALDESIGN TEAM DELIVERABLE DMETERING DIAGRAMCM2DD ESTIMATE - LIST ALTERNATESCM3FINAL CONTRACT - PRICE ALTERNATESINTEGRATE STRATEGIESCONSTRUCTIONDOCUMENTATIONBIDDING OR GMPEXECUTE ISSIONING: ENVELOPE, SYSTEMSCM4COORDINATE FINAL MONITORINGCM511-MONTH WALK THROUGHDESIGN TEAM DELIVERABLE EOCCUPANCY MONITORING NARRATIVEPOST-OCCUPANCYOCCUPANCYDESIGN TEAM DELIVERABLE F11-MONTH WALK THROUGH - REVIEW DATA21 September 2017Diagram- overall
BE 2018GREEN GAUGESGreen Gauges09 March 2018REQUEST FOR PROPOSALSPROGRAMMINGGOAL ASSESSMENT10% SCHEMATIC DESIGNDESIGN TEAM DELIVERABLE AEUI SUMMARYSPACE NEEDS EUI DATA ANNUAL ENERGY TARGETDEVELOP SOLUTION CONCEPTSSITEENVELOPEACTIVE SYSTEMS (MEP)IAQPASSIVE SYSTEMSRESILIENT NSTRUCTION30% SCHEMATIC DESIGNDESIGN TEAM DELIVERABLE BSYSTEMS & METERING NARRATIVEDESIGN TEAM DELIVERABLESUSTAINABILITY CHARRETTEOWNER REVIEW AND COMMENTSCHEMATICDESIGNCOMMISSIONING: REVIEW AND COMMENTUPDATE SYSTEMS DESIGN NARRATIVELOADS ANALYSIS BY COMPONENTPACKAGE FOR PRICINGLIST CHOSEN STRATEGIES AS ALTERNATESDESIGN TEAM DELIVERABLE3RD PARTY PRICING BY ESTIMATORCM125% DESIGN DEVELOPMENTDiagram- SchematicDESIGNTEAM DELIVERABLE CVALUE ASSESSMENTREVIEW OF SCHEMATIC ESTIMATEOWNER REVIEW AND APPROVALDEVELOP STRATEGIES
UPDATE SYSTEMS DESIGN NARRATIVELOADS ANALYSIS BY COMPONENTBE 2018GreenGaugesPACKAGE FOR PRICING09 March 2018LIST CHOSEN STRATEGIES AS ALTERNATESDESIGN TEAM DELIVERABLE3RD PARTY PRICING BY ESTIMATORCM125% DESIGN DEVELOPMENTDESIGN TEAM DELIVERABLE CVALUE ASSESSMENT50% DESIGN DEVELOPMENTREVIEW OF SCHEMATIC ESTIMATEOWNER REVIEW AND APPROVALDEVELOP STRATEGIESDESIGNDEVELOPMENTOWNER REVIEW AND APPROVALDESIGN TEAM DELIVERABLE DMETERING DIAGRAMCM2DD ESTIMATE - LIST ALTERNATESCM3FINAL CONTRACT - PRICE ALTERNATESINTEGRATE STRATEGIESCONSTRUCTIONDOCUMENTATIONBIDDING OR GMPEXECUTE ram– Design DevelopmentDESIGN TEAM DELIVERABLE EOCCUPANCY MONITORING NARRATIVECOMMISSIONING: ENVELOPE, SYSTEMSCM4COORDINATE FINAL MONITORING
50% DESIGN DEVELOPMENTOWNER REVIEW AND APPROVALDESIGN TEAM DELIVERABLE DMETERING DIAGRAMBE 2018Green Gauges09 March 2018CM2DD ESTIMATE - LIST ALTERNATESCM3FINAL CONTRACT - PRICE ALTERNATESINTEGRATE STRATEGIESCONSTRUCTIONDOCUMENTATIONBIDDING OR GMPEXECUTE ISSIONING: ENVELOPE, SYSTEMSCM4COORDINATE FINAL MONITORINGCM511-MONTH WALK THROUGHDESIGN TEAM DELIVERABLE EOCCUPANCY MONITORING NARRATIVEPOST-OCCUPANCYOCCUPANCYDESIGN TEAM DELIVERABLE F11-MONTH WALK THROUGH - REVIEW DATADiagram – At completion21 September 2017
BE 2018Biophilic momentGreen Gauges09 March 2018
BE 2018Green Gauges09 March 2018What is the BASELINE and What is the GOAL?BASELINEPeer group Baseline is LEED Silver (not energy specific)Energy Baseline is MA Stretch CodeGOALLEED GOLD or better15-20% better than the Stretch Code (now IECC – 2015)Stated goal- 35% campus wide carbon emission reduction of1990 levels by 2020ENERGY USE INTENSITY or EUIThe total amount of energy used in the course of a yearexpressed in kbtu/sf.For either source or site energy.at Williams, this value is NOT offset by renewablesGoals and Feasibility (EUI)- Appendix A
BE 2018Green Gauges(EUI)- as reported by LBC, not 2030 Challenge09 March 2018
BE 2018Green GaugesWilliams Inn- Energy Use Intensity- EXAMPLE09 March 2018Designed by Cambridge Seven, Analysis by WSP
BE 2018Green GaugesWilliams Inn- Energy Use Intensity- EXAMPLE09 March 2018Designed by Cambridge Seven, Analysis by WSP
BE 2018Green Gauges09 March 2018A simple narrative that is organized to communicate with all members ofthe Project team.B1SiteB2EnvelopeB3Mechanical, Electrical & PlumbingB4Indoor Air QualityB5Passive StrategiesB6Resilient StrategiesB7WaterB8Generation & OffsetsB9Occupant engagementB10MonitoringTo be reviewed and approved with the Owner at 30% of Schematic Designbefore the design is fully documented.A consistent format for Project Managers working with numerous designteams. If an integrated design process, this is easy.Systems and Metering Narrative- Appendix B
BE 2018Green Gauges09 March 2018Conceptual Design Strategies (Appendix B)B2- EnvelopeSystem DescriptionPros / ConsTarget / GoalSub-Slab2” XPS Foam Board continuous beneath slab.Adequate, continuous sub-slab insulation and air/moisture controlprovides thermal stability, moisture mitigation, reduced heat loss.Areas of discontinuity can provide regions for condensation, moldformation.Reduce heatloss through foundation wallsand condensation at slab. Continuous subslab insulation. Consider R-15 to R-20 forNet Zero ProjectsFoundation4” XPS continuous foam board in groundcontact to exterior of poured concretefoundation walls. AAC block grade whereinsulation ends.Durable, low-impact insulation continuousto the exterior of the foundation to R-20.Walls - WoodInsulation: 2x8 Walls with batt insulation, 4”Rigid Insulation outboard of sheathing.Outline spec indicates wall insulation to bemineral fiber and rigid insulation to be rockwool-fiber.Air Sealing: Continuous and verified air barrierassembly.Continuous insulation at the foundation – whether inside oroutside – provides thermal comfort. Air control and moisturecontrol below grade are critical to maintaining internal comfortthroughout building. basement. Some ground-contact foamproducts have high Global Warming Potential – subtracting fromthe climate-benefits their insulation provides.Insulation: Batt insulation affordable but difficult to install to GradeI standards.Outboard insulation is good strategy for protection of structuralmembers and sheathing.Air Sealing: Provides thermal comfort, energy savings, anddurability by preventing movement of heat and moisture throughwall assembly and avoiding future condensation/mold/rot.Walls – Masonry8” CMU. Brick veneer. Insulated to the outside. Exterior insulation allows for protection of the structuralContinuous insulation on all segments ofassemblies from hot/cold/wet conditions.the thermal boundary.High performance curtain wall. U-0.2 or lower Low U-value windows typically provide greater energy savings,Avoid cold spots, uncomfortable spaceshigher thermal comfort, esp. in spaces dominated by curtain wallwhole unit value specified.assemblies. Prices typically higher than lower performance units.Doors: U-0.24 Exterior Doors specified.Low U-value windows provide greater thermal comfort, energyU-0.2 or better all windows.Windows: Single hung, triple-glazed woodsavings. Prices typically higher than double glazed units.clad windows with multi-layer low-E coatingand Argon fillInsulation: 4” Batt insulation in attic floor. 8”High R-value roof will reduce energy losses in winter (and gains inR-50 or better. All mechanicals fully withinrigid insulation at underside of roofsummer). Carefully detailed air sealing prevents migration of warm insulated space. Air Sealing standard: 0.25sheathing.moist air into assemblies during winter, preventing condensation,cfm75/square foot of shell – all six sides.Air Sealing: Continuous, verifiable air barrierprotecting structure.assembly.Continuous, verifiable air barrier assembly,Careful detailing and established testing protocols provide for low0.25cfm75/shell square foot, all six sidestraceable from roof to basement. Testingheat loss and high durability in low-infiltration buidings. Testing ofprotocols established early. Full-scale mockup mockup can diagnose possible issues in construction sequence.provided and tested with fog.Walls – CurtainWindows / DoorsRoofAir-TightnessOwner Review & CommentsInsulation: R-40 wall with continuousinsulation to the exterior of structuralmembers.Air Sealing standard: 0.25 cfm75/squarefoot of shell – all six sides.Designed by Atelier Ten for PBDW, documented by c&h7 January 2017C&H ArchitectsPage 2 of 6Systems and Metering Narrative - Appendix B- EXAMPLE
BE 2018Green Gauges09 March 2018B2- EnvelopeSystem DescriptionPros / ConsTSub-Slab2” XPS Foam Board continuous beneath slab.Adequate, continuous sub-slab insulation and air/moisture controlprovides thermal stability, moisture mitigation, reduced heat loss.Areas of discontinuity can provide regions for condensation, moldformation.RaFoundation4” XPS continuous foam board in groundcontact to exterior of poured concretefoundation walls. AAC block grade whereinsulation ends.DWalls - WoodInsulation: 2x8 Walls with batt insulation, 4”Rigid Insulation outboard of sheathing.Outline spec indicates wall insulation to bemineral fiber and rigid insulation to be rockwool-fiber.Air Sealing: Continuous and verified air barrierassembly.Continuous insulation at the foundation – whether inside oroutside – provides thermal comfort. Air control and moisturecontrol below grade are critical to maintaining internal comfortthroughout building. basement. Some ground-contact foamproducts have high Global Warming Potential – subtracting fromthe climate-benefits their insulation provides.Insulation: Batt insulation affordable but difficult to install to GradeI standards.Outboard insulation is good strategy for protection of structuralmembers and sheathing.Air Sealing: Provides thermal comfort, energy savings, anddurability by preventing movement of heat and moisture throughwall assembly and avoiding future condensation/mold/rot.Walls – MasonryWalls – CurtainWindows / DoorsSystems and8” CMU. Brick veneer. Insulated to the outside. Exterior insulation allows for protection of the structuralassemblies from hot/cold/wet conditions.High performance curtain wall. U-0.2 or lower Low U-value windows typically provide greater energy savings,whole unit value specified.higher thermal comfort, esp. in spaces dominated by curtain wallassemblies. Prices typically higher than lower performance units.Designed by Atelier Ten for PBDW, documented by c&hDoors: U-0.24 Exterior Doors specified.Low U-value windows provide greater thermal comfort, energyWindows: Single hung, triple-glazed woodsavings. Prices typically higher than double glazed units.MeteringNarrative- AppendixB- EXAMPLEclad windowswith multi-layerlow-E coatingand Argon fillU
sustainably forested wood, local material useBE 2018Increased durability of structural systems inareas of renovationGreen Gauges09 March 2018SUSTAINABLE STRATEGIES: MEP (MECHANICAL, ELECTRICAL, PLUMBING)SYSTEMHEATINGDESCRIPTIONMEASURED BENEFITSOption #1: Campus Steam( ) no site fossil fuel(-) higher EUIUtilizes existing heating sourceOption #2: Air Source VRF Heat Pump withsupplemental steam heating( ) no site fossil fuel – could be offset byPV/GEC( ) lower EUI(-) requires supplemental heat for extremecoldReduced EUI and reduce Carbon footprintwhen coupled with PV/GECsOption #1: Air Cooled Chiller( ) High Efficiency(-) High First CostLess equipment to support AC.Option #2: Air Source VRF Heat Pump( ) High Efficiency(-) Distributed refrigerantReduced EUI and reduce Carbon footprintwhen coupled with PV/GECsEnergy Recovery Units (ERUs)( ) Provide Code required ventilation(-) Space in existing building for ductwork(-) High First CostComfortAir QualityReduce EnergyOccupancy Based Control( ) High EfficiencySingle room recovery ventilation unit( ) Low energy( ) Eliminate the need for ductworkCOOLINGVENTILATIONPROS/CONSOperable windows (see passive section)FILTRATIONHOT WATERMERV 13 Filters in ERUsComply with LEED( ) Air Quality(-) Fan Power(-) Filter CostSee B6 Hot WaterOTHER13Systems and Metering Narrative - Appendix B- EXAMPLEAir QualityDesigned by Centerline Architects
BE 2018Green GaugesSystemHeatingOnlyHeating &CoolingDomesticHotWaterFirstCostOperating SourceCostEUI*09 March 2018ArchitecturalRequirementsThermostatsIndividual ControlHot-Water Radiant Panels LowMediumBasementMechanical Room;Recessed CeilingPanelsAir-Source Heat Pumps MediumLowMechanical Closetswith DuctingShared ControlElectric Baseboard HighMediumRecessed Wall orCeiling PanelsIndividual ControlVRF Heat Pumps MediumMediumMechanical Closetswith DuctingShared ControlGround Source Heat Pumps(Water-to-Air) LowLowMechanical Closetswith DuctingShared ControlGround Source Heat Pumps(Water-to-Water) ( )LowLowMechanical Room;Recessed TerminalUnitsIndividual ControlNatural Gas MediumMediumMechanical RoomN/AAir-Source Heat Pump MediumMediumMechanical RoomN/AnotesHorn Hall is designed with this offcampus steam plant primarycampus standardInstalled at Kellogg CenterCurrent design for the CDE*Source EUI:In comparing the projected energy performance of the Garfield House to other new construction at Williams College, it is important to make an apples to apple comparison of heatingenergy sources. Buildings such as Horn Hall rely on district steam, so the efficiency of the district heating plant must be taken into consideration when comparing it to the efficiency ofGarfield s proposed heating systems (local boilers, etc.).Designed by SGA, Vanderweil and Thorton TomasettiSystems and Metering Narrative - Appendix B- EXAMPLE
BE 2018Biophilic momentGreen Gauges09 March 2018
Appendix C: Value AssessmentBE 2018PROPOSED EUI:Green GaugesStrategies forAssessment(ref Appendix B)IncrementalCost ofMeasureover Baseline( initial cost)EnergySavings(units per fueltype- not )over BaselineAvoided carbon System lifeMetric Tons(years)eCO209 March 2018 /MetricTon ofeCO2 peryear overthe systemlifeCommentsC1- SiteC2- EnvelopeC3- MechanicalC3- ElectricalC3- PlumbingC4- Materials & IAQC5- PassiveStrategiesC6- Resilient DesignC7- WaterC8- GenerationC8- OffsetsC9- OccupantEngagementC10- MeteringValue Assessment- Appendix C01 Oct 2017Williams College- Green GaugesPage 2 of 3
33,20417,7265.9C3High Efficiency Lighting 38,785137,48645.9C3Enhanced Lighting controls 122,70722,7557.6C3Chilled beams at offices 15,590-5.2C3Lab exhaust enhancements 226,039103,28234.5C8Photovoltaics (147.9 kw)123.6 494,50029,700 -148,35049.5cost per metric tonof eCO2 avoidedover system life33.339.3 84640-3,561-18.927.0 1,43520-223-1.26.4 19,136102,85715.19.9 2,99325543.4 41625 21 72 1,914 120 1749.5 9,99020 49996,122 508.9-0.0System Life6,297cost per avoidedmetric tonTotal metric tonsavoided eCO2Envelope Enhancements09 March 2018Equ. Carbonavoided in metrictonsC2THERMS savingsEqu. Carbonavoided in metrictonsSCIENCE CENTER SOUTHKWH savingsGreen GaugesIncremental costsfrom Nat. GridstudyBE 2018TOTAL675.5Value Assessment- Appendix C- EXAMPLEData by Payette- analysis to cost/aCO2e/year by c&hCarbon equivalent values from Clean Air Cool planet
BE 2018Green Gauges09 March 2018ECM #5: Exhaust Air EnhancementsElectric Energy Savings and NEBsMeasure NameElectricityECM 5Laboratory ExhaustkWh103,282Natural Gas 15,161Total CostReductionInstalledIncrementalCostSimple Payback w /oincentiveElec OnlyTotalTherms yearsyears96,122 117,942 133,103 226,03914.91.7Designed by Payette and Vanderweil,by AndelmanandproposedLelekThis measure involves laboratory exhaust design features that exceedanalysiscode requirements.Thedesign has heat pipe energy recovery for the AHUs and also has variable exhaust and supply air flowrateswith significant reduction in airflow during unoccupied periods. Code requirements, per AHSRAE 90.12010 section 6.5.7.2, indicate that laboratory exhaust systems must employ some feature that reducesScienceCenterLab Exhaustexhaust airand/or recoversheat, however the proposed design exceeds this requirement in both regards.This measure results in both electric and natural gas savings. Airflow reductions yield fan energy savingsMeasure Description
BE 2018Green GaugesIDGARFIELDIncremental costs Savingsover codeKWHC2C3aC3bC3cPassive Haus EnvelopeDHW- drain water recoveryLED LightingElectric heating vs. gas boiler (No cooling) - metric tonsEqu. 4.00 - 24,300SavingsTHERMS11.340.003.90-8.1109 March 2018metric tonsEqu. Carbon035902129Total metric tons eCO20.01.90.011.3cost per metric ton11.31.93.93.2 - System Life6,1562,3686,41522,70450502030cost per metric tonover system life 12347321(757)8-Decreviewed by TRCHWILLIAMS INNIDMeasureIncremental costsC2C3aC3bC3cC8Exterior Envelop upgradesMechanical UpgradesElectrical UpgradesHigh Efficiency DHW30 kw pv array SavingsKWH38,000378,00082,00067,00086,000IDSCIENCE CENTER SOUTHC2C3C3C3C3Envelope EnhancementsHigh Efficiency LightingEnhanced Lighting controlsChilled beams at officesLab exhaust enhancementsC8Photovoltaics (147.9 kw)metric tonsEqu. Carbon0.00.045,12215.10.036,00012.0Savingsmetric tonsTHERMSEqu. l costsSavingsmetric tonsFrom Nat. Grid study KWHEqu. Carbon 33,20417,7265.9 38,785137,48645.9 122,70722,7557.6 29,700 15,590-5.2 226,039103,28234.5# 494,500148,350C2aC2bC2cC3Heat pumps (over propane boiler)C3Increase ERV Efficiency 5,000C4LED Lighting C7PV'sC8Network lighting controlID131.981200 kwh per kw?-metric tonsEqu. Carbon0.0cost per metric ton18.875.415.113.412.0 Savingsmetric tonsTHERMS Equ. Carbon6,29733.3- Input by TRCH from 04 Dec Memo from ARC/RFScalculated per WC valuesBOAT HOUSEIncremental costsSavingsmetric tonsSavingsof Measure over baseline KWHEqu. CarbonTHERMSWall insulationU-0.04 vs 0.051 24,0005,1211.7Roof insulationU-0.025 vs 0.032in abovein aboveTriple pane glazing U 0.24 vs 0.3 20,0001,6910.6-Total metric tons eCO20.0Total metric tons eCO22,0165,0105,4465,0027,159Total metric tons eCO2System Life cost per metric tonover the system life50 4020 25110 54520 25020 358cost per metric ton39.327.06.49.9543.4 8461,43519,1362,99341649.5 9,9901st yearcost per metric tonSystem Life cost per metric tonover system life40 2120 7210 1,91425 12025 1720 LifetimeSystem Life cost per metric ton1.71 14,04540 3510.00.56 35,44520 1,7720.0-0.00.001,0610.4-0.00.35 14,12320 70640,5008,0622.7-0.02.69 15,05520 753 527,910 4,000158,37352.8-0.052.85 9,99020 499 20,2505,2541.8-0.01.75 11,55120 578Value Assessment- Appendix C- more examples#VALUE!20#VALUE!499
BE 2018Value Assessment Summaries – DRAFT23 Jan 2018Green Gauges09 March 2018SCIENCE CENTER SOUTHIncremental CostTotal Metric Tonsof eCO2 saved peryearSystemLifeCost per metricton over systemlifeC2Envelope Enhancements 33,20439.340 21C3High Efficiency Lighting 38,78527.020C3Enhanced Lighting Controls 122,7076.410C3Chilled Beams at Offices 29,7009.925C3Lab Exhaust Enhancements 226,039534.425C8Photovoltaics- 148 kw @ 3.57 per watt 494,500(PPA)49.520 72 1,914 120 17 499BOAT HOUSEIncremental CostTotal Metric Tonsof eCO2 saved peryearSystemLifeCost per metricton over systemlife 24,0001.740C2b Triple glazed windows 20,0000.520 351 1,772C3Heat pumps (over propane boiler)?C3Increase ERV Efficiency 5,0000.420C4LED Lighting 40,5002.720C7Photovoltaics- 132 kw @ 4 per watt52.820C8Network Lighting Control 527,910(PPA) 20,250 706 753 4991.7520 578C2aWall and Roof insulationSummary Tables
BE 2018MEMOGreen Gauges09 March 2018WILLIAMS INNIncremental CostTotal Metric Tonsof eCO2 saved peryearSystemLifeCost per metricton over systemlifeC2Exterior Envelope Upgrades 38,00018.850C3aMechanical Upgrades 378,00075.420 40 251C3b Electrical and Lighting Upgrades 82,00015.110 545C3cHigh Efficiency DHW 67,00013.420C8Photovoltaics- 30 kw @ 2.86 per watt 86,000 (low)(PPA)1220 250 358Incremental CostTotal Metric Tonsof eCO2 saved peryearSystemLifeCost per metricton over systemlife 123 47 321- 757GARFIELDC2Passive Haus Envelope 69,80011.350C3aDHW- drain water recovery 4,5001.950C3b LED Lighting 25,0003.920C3c( 24,300)savings3.230Electric heat vs. gas boiler (no cooling)Phase change material? Little heatingbenefitSummary Tablesbut positive
BE 2018Green Gauges09 March 2018MEMOSCIENCE CENTER NORTHIncremental CostTotal Metric Tonsof eCO2 saved peryearSystemLifeCost per metricton over systemlife 319 371- 329C2Envelope Enhancements 348,60027.340C3aImproved Lighting 89,2001220C3b Dual Enthalpy Economizers 3,000-0.4 (yes, more)25C3c 2,20015.460C3d Energy Recovery enthalpy wheel 10,0004.125C3e 2,20023.460Supply air temperature resetReduced Minium flowSummary Tables 2 97 2
BE 2018Green Gauges09 March 2018Williams College Measurement and Verification of Performance Process% EFFORTACTIONDELIVERABLETEAM MEMBERSCOMMENTSSCHEMATIC DESIGN (SD)5%Identify target systems and metrics.Identify systems to monitor (e.g., water List of systems and metrics to bemonitoredsystem) and metrics for monitoring(e.g., amount of potable water use)Project Owner; Design Team (i.e.,Architect, M V Consultant, MEPDesigner, Water System Designer,PV System Designer); GeneralContractor; Building Manager5%Create schematic metering plan.Create a schematic metering plan thatSchematic metering plan for eachidentifies which systems will bemetered systemmonitored and where equipment will belocatedDesign Team (i.e., Architect, M VConsultant, MEP Designer, WaterSystem Designer, PV SystemDesigner); General Contractor;Building Manager15%5%5%DESIGN DEVELOPMENT (DD)Develop metering plan.Design Team (i.e., Architect, M VDevelop a more detailed metering planConsultant, MEP Designer, Waterthat includes descriptions of variables,Metering planSystem Designer, PV Systemmetering equipment, and dataDesigner); General Contractor;collection frequencies, as well asBuilding Managerdiagrams depicting where meteringequipment will be locatedProject Owner; Design Team (i.e.,Confirm metering plan.Architect, M V Consultant, MEPConfirm metering plan with all projectDesigner, Water System Designer,Sign-off on metering planteam members, including thoseElectrical Consultant, PV Systeminvolved in design, construction, andDesigner); General Contractor;day-to-day operations of the projectBuilding ManagerCONSTRUCTION DOCUMENTS (CD)Confirm constructability.Review metering plan with theconstruction team to verifyconstructability of the metering planSign-off on metering plan, withrespect
Living Building Challenge LEED Platinum Net Zero No certification LEED Platinum?LEED Platinum? Passive HousePassive House. BE 2018 Green Gauges 09 March 2018 Historical & Future Building Standards LEED Gold after the fact LEED Gold at project start (w/a dash of LBC) LEED Gold EUI target LEED