Transcription
IDAIW’ELU ENTELSEVlERIntelligent Data Analysis 1 (1997) re Selection for ClassificationM. Dash ‘, H. Liu 2Department of Information System & Computer Science, National University of Singapore, Singapore 119260Received 24 January 1997; revised 3 March 1997; accepted 21 March 1997AbstractFeature selection has been the focus of interest for quite some time and much work has been done. With the creation of hugedatabases and the consequent requirements for good machine learning techniques, new problems arise and novel approachesto feature selection are in demand. This survey is a comprehensive overview of many existing methods from the 1970’s to thepresent. It identifies four steps of a typical feature selection method, and categorizes the different existing methods in termsof generation procedures and evaluation functions, and reveals hitherto unattempted combinations of generation proceduresand evaluation functions. Representative methods are chosen from each category for detailed explanation and discussion viaexample. Benchmark datasets with different characteristics are used for comparative study. The strengths and weaknesses ofdifferent methods are explained. Guidelines for applying feature selection methods are given based on data types and domaincharacteristics. This survey identifies the future research areas in feature selection, introduces newcomers to this field, and pavesthe way for practitioners who search for suitable methods for solving domain-specific real-world applications. (Intelligent DataAnalysis, Vol. I, no. 3, http:llwwwelsevier.co&ocate/ida)0 1997 Elsevier Science B.V. All rights reserved.Keywords: Feature selection; Classification; Framework1. IntroductionThe majority of real-world classification problems require supervised learning where the underlyingclass probabilities and class-conditionalprobabilities are unknown, and each instance is associated witha class label. In real-world situations, relevant features are often unknown a priori. Therefore, manycandidate features are introduced to better represent the domain. Unfortunately many of these are eitherpartially or completely irrelevant/redundantto the target concept. A relevant feature is neither irrelevantnor redundant to the target concept; an irrelevant feature does not affect the target concept in any way,and a redundant feature does not add anything new to the target concept [21]. In many applications, thesize of a dataset is so large that learning might not work as well before removing these unwanted features.Reducing the number of irrelevant/redundantfeatures drastically reduces the running time of a learning1 E-mail: manoranj@iscs.nus.sg.2 E-mail: liuh@iscs.nus.sg.1088-467X/97/ 17.000 1997 Elsevier Science B.V. All rights reserved.PII: SlOSS-467X(97)00008-5
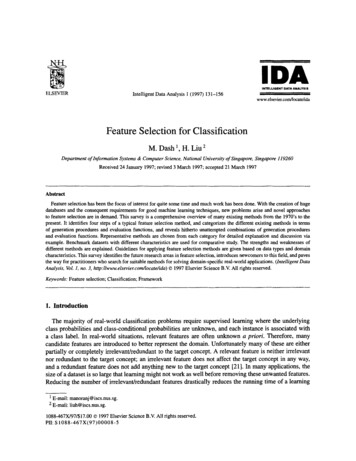
hf. Dash, H. Liu / Intelligent Data Analysis 1 (1997) 131-156132algorithm and yields a more general concept. This helps in getting a better insight into the underlyingconcept of a real-world classification problem [23,24]. Feature selection methods try to pick a subset offeatures that are relevant to the target concept.Feature selection is defined by many authors by looking at it from various angles. But as expected,many of those are similar in intuition and/or content. The following lists those that are conceptuallydifferent and cover a range of definitions.1. Idealized: find the minimallysized feature subset that is necessary and sufficient to the targetconcept [22].2. Classical: select a subset of M features from a set of N features, M N, such that the value of acriterion function is optimized over all subsets of size M [34].3. Improving Prediction accuracy: the aim of feature selection is to choose a subset of features forimproving prediction accuracy or decreasing the size of the structure without significantly decreasingprediction accuracy of the classifier built using only the selected features [24].4. Approximatingoriginal class distribution:the goal of feature selection is to select a small subsetsuch that the resulting class distribution, given only the values for the selected features, is as close aspossible to the original class distribution given all feature values [24].Notice that the third definition emphasizes the prediction accuracy of a classifier, built using only theselected features, whereas the last definition emphasizes the class distribution given the training dataset.These two are quite different conceptually. Hence, our definition considers both factors.Feature selection attempts to select the minimallysized subset of features according to the followingcriteria. The criteria can be:1. the classification accuracy does not significantly decrease; and2. the resulting class distribution, given only the values for the selected features, is as close as possibleto the original class distribution, given all features.Ideally, feature selection methods search through the subsets of features, and try to find the bestone among the competing 2N candidate subsets according to some evaluation function. However thisprocedure is exhaustive as it tries to find only the best one. It may be too costly and practically prohibitive,even for a medium-sizedfeature set size (N). Other methods based on heuristic or random searchmethods attempt to reduce computationalcomplexity by compromisingperformance. These methodsneed a stopping criterion to prevent an exhaustive search of subsets. In our opinion, there are four basicsteps in a typical feature selection method (see Figure 1):1.2.3.4.a generation procedurean evaluation finctiona stopping criterion toa validation procedureto generate the next candidate subset;to evaluate the subset under examination;decide when to stop; andto check whether the subset is valid.The generation procedure is a search procedure [46,26]. Basically, it generates subsets of features forevaluation. The generation procedure can start: (i) with no features, (ii) with all features, or (iii) witha random subset of features. In the first two cases, features are iteratively added or removed, whereasin the last case, features are either iteratively added or removed or produced randomly thereafter [26].An evaluation function measures the goodness of a subset produced by some generation procedure, andthis value is compared with the previous best. If it is found to be better, then it replaces the previous best
M. Dash, H. Liu /IntelligentOriginalFeature Setz-SubsetGenerationAData Analysis 1 (1997) 131-156-133Evaluation\\Goodness ofthe subset\\\NoYesValidationFig. 1. Feature selection process with validation.subset. Without a suitable stopping criterion the feature selection process may run exhaustively or foreverthrough the space of subsets. Generation procedures and evaluation functions can influence the choice fora stopping criterion. Stopping criteria based on a generation procedure include: (i) whether a predefinednumber of features are selected, and (ii) whether a predefined number of iterations reached. Stoppingcriteria based on an evaluation function can be: (i) whether addition (or deletion) of any feature doesnot produce a better subset; and (ii) whether an optimal subset according to some evaluation functionis obtained. The loop continues until some stopping criterion is satisfied. The feature selection processhalts by outputting a selected subset of features to a validation procedure. There are many variationsto this three-step feature selection process, which are discussed in Section 3. The validation procedureis not a part of the feature selection process itself, but a feature selection method (in practice) must bevalidated. It tries to test the validity of the selected subset by carrying out different tests, and comparingthe results with previously established results, or with the results of competing feature selection methodsusing artificial datasets, real-world datasets, or both.There have been quite a few attempts to study feature selection methods based on some framework orstructure. Prominent among these are Doak’s [13] and Siedlecki and Sklansky’s [46] surveys. Siedleckiand Sklansky discussed the evolution of feature selection methods and grouped the methods intopast, present, and future categories. Their main focus was the branch and bound methods [34] andits variants, [16]. No experimental study was conducted in this paper. Their survey was published inthe year 1987, and since then many new and efficient methods have been introduced (e.g., Focus [2],Relief [22], LVF [28]). Doak followed a similar approach to Siedlecki and Sklansky’s survey and groupedthe different search algorithms and evaluation functions used in feature selection methods independently,and ran experiments using some combinations of evaluation functions and search procedures.In this article, a survey is conducted for feature selection methods starting from the early 1970’s [331to the most recent methods [28]. In the next section, the two major steps of feature selection (generationprocedure and evaluation function) are divided into different groups, and 32 different feature selectionmethods are categorized based on the type of generation procedure and evaluation function that is used.
M. Dash, H. Liu/Intelligent134Data Analysis I (1997) 131-156This framework helps in finding the unexplored combinations of generation procedures and evaluationfunctions. In Section 3 we briefly discuss the methods under each category, and select a representativemethod for a detailed description using a simple dataset. Section 4 describes an empirical comparisonof the representative methods using three artificial datasets suitably chosen to highlight their benefitsand limitations.Section 5 consists of discussions on various data set characteristics that influence thechoice of a suitable feature selection method, and some guidelines, regarding how to choose a featureselection method for an application at hand, are given based on a number of criteria1 extracted from thesecharacteristics of data. This paper concludes in Section 6 with further discussions on future researchbased on the findings of Section 2. Our objective is that this article will assist in finding better featureselection methods for given applications.2. Study of Feature SelectionMethodsIn this section we categorize the two major steps of feature selection: generation procedure andevaluation function. The different types of evaluation functions are compared based on a number ofcriteria. A framework is presented in which a total of 32 methods are grouped based on the types ofgeneration procedure and evaluation function used in them.2. I. GenerationProceduresIf the original feature set contains N number of features, then the total number of competing candidatesubsets to be generated is 2 N. This is a huge number even for medium-sizedN. There are differentapproaches for solving this problem, namely: complete, heuristic, and random.2.1.1. CompleteThis generation procedure does a complete search for the optimal subset according to the evaluationfunction used. An exhaustive search is complete. However, Schlimmer [43] argues that “just because thesearch must be complete does not mean that it must be exhaustive.” Different heuristic functions are usedto reduce the search without jeopardizing the chances of finding the optimal subset. Hence, although theorder of the search space is O(2N), a fewer subsets are evaluated. The optimality of the feature subset,according to the evaluation function, is guaranteed because the procedure can backtrack. Backtrackingcan be done using various techniques, such as: branch and bound, best first search, and beam search.2. I. 2. HeuristicIn each iteration of this generation procedure, all remaining features yet to be selected (rejected) areconsidered for selection (rejection). There are many variations to this simple process, but generation ofsubsets is basically incremental (either increasing or decreasing). The order of the search space is O(N*)or less; some exceptions are Relief [22], DTM [9] that are discussed in detail in the next section. Theseprocedures are very simple to implement and very fast in producing results, because the search space isonly quadratic in terms of the number of features.2. I .3. RandomThis generation procedure is rather new in its use in feature selection methods compared to the othertwo categories. Although the search space is O(2N), but these methods typically search fewer number of
M. Dash, H. Liu / Intelligent Data Analysis I (1997) 131-156135subsets than 2N by setting a maximum number of iterations possible. Optimality of the selected subsetdepends on the resources available. Each random generation procedure would require values of someparameters. Assignment of suitable values to these parameters is an important task for achieving goodresults.2.2. EvaluationFunctionsAn optimal subset is always relative to a certain evaluation function (i.e., an optimal subset chosenusing one evaluation function may not be the same as that which uses another evaluation function).Typically, an evaluation function tries to measure the discriminatingability of a feature or a subsetto distinguish the different class labels. Langley [26] grouped different feature selection methods intotwo broad groups (i.e., filter and wrapper) based on their dependence on the inductive algorithm thatwill finally use the selected subset. Filter methods are independent of the inductive algorithm, whereaswrapper methods use the inductive algorithm as the evaluation function. Ben-Bassat [4] grouped theevaluation functions existing until 1982 into three categories: in formation or uncertainty measures,distance measures, and dependence measures, and suggested that the dependence measures can bedivided between the first two categories. He has not considered the classification error rate as anevaluation function, as no wrapper method existed in 1982. Doak [13] divided the evaluation functionsinto three categories: data intrinsic measures, classification error rate, and estimated or incrementalerror rate, where the third category is basically a variation of the second category. The data intrinsiccategory includes distance, entropy, and dependence measures. Considering these divisions and thelatest developments, we divide the evaluation functions into five categories: distance, information (oruncertainty), dependence, consistency, and classi er error rate. In the following subsections we brieflydiscuss each of these types of evaluation functions.2.2.1. Distance MeasuresIt is also known as separability, divergence, or discriminationmeasure. For a two-class problem, afeature X is preferred to another feature Y if X induces a greater difference between the two-classconditional probabilities than Y; if the difference is zero, then X and Y are indistinguishable.An exampleis the Euclidean distance measure.2.2.2. Znfonnation MeasuresThese measures typically determine the information gain from a feature. The information gain from afeature X is defined as the difference between the prior uncertainty and expected posterior uncertaintyusing X. Feature X is preferred to feature Y if the information gain from feature X is greater than thatfrom feature Y (e.g., entropy measure) [4].2.2.3. Dependence MeasuresDependence measures or correlation measures qualify the ability to predict the value of one variablefrom the value of another. The coefficient is a classical dependence measure and can be used to find thecorrelation between a feature and a class. If the correlation of feature X with class C is higher than thecorrelation of feature Y with C, then feature X is preferred to Y. A slight variation of this is to determinethe dependence of a feature on other features; this value indicates the degree of redundancy of the feature.All evaluation functions based on dependence measures can be divided between distance and information
136M. Dash, H. Liu / Intelligent Data Analysis I (1997) 131456Table 1A Comparison of Evaluation FunctionsEvaluation FunctionGeneralityTime ComplexityAccuracyDistance MeasureYesLow-Information MeasureYesLow-Dependence MeasureYesLow-Consistency MeasureYesModerate-Classifier Error RateNoHighVery Highmeasures. But, these are still kept as a separate category, because conceptually, they represent a differentviewpoint [4]. More about the above three measures can be found in Ben-Basset’s [4] survey.2.2.4. Consistency MeasuresThese measures are rather new and have been in much focus recently. These are characteristicallydifferent from other measures, because of their heavy reliance on the training dataset and the use of theMin-Features bias in selecting a subset of features [3]. Min-Features bias prefers consistent hypothesesdefinable over as few features as possible. More about this bias is discussed in Section 3.6. Thesemeasures find out the minimally sized subset that satisfies the acceptable inconsistency rate, that is usuallyset by the user.2.2.5. ClassiJier Error Rate MeasuresThe methods using this type of evaluation function are called “wrapper methods”, (i.e., the classifier isthe evaluation function). As the features are selected using the classifier that later on uses these selectedfeatures in predicting the class labels of unseen instances, the accuracy level is very high althoughcomputationallyquite costly [21].Table 1 shows a comparison of various evaluation functions irrespective of the type of generationprocedure used. The different parameters used for the comparison are:1. generality: how suitable is the selected subset for different classifiers (not just for one classifier);2. time complexity: time taken for selecting the subset of features; and3. accuracy: how accurate is the prediction using the selected subset.The ‘-’ in the last column means that nothing can be concluded about the accuracy of thecorresponding evaluation function. Except ‘classifier error rate,’ the accuracy of all other evaluationfunctions depends on the data set and the classifier (for classification after feature selection) used. Theresults in Table 1 show a non-surprising trend (i.e., the more time spent, the higher the accuracy). Thetable also tells us which measure should be used under different circumstances, for example, with timeconstraints, given several classifiers to choose from, classifier error rate should not be selected as anevaluation function.2.3. The FrameworkIn this subsection, we suggest a framework on which the feature selection methods are categorized.Generation procedures and evaluation functions are considered as two dimensions, and each method is
137M. Dash, H. Liu / Intelligent Data Analysis I (1997) 131-156Table 2Two DimensionalCategorizationof Feature Selection CompleteDistanceMeasureZ-Set 3.1 Relief Relief-FSege84II-&c3.2 Branchand ependencyMeasureVZZ-Sec 3.5 POElACCPRESETVIIIIxConsistencyMeasureXXI-Set3.6 FocusSch193 MIFES-1XII-&cClassifier ErrorRateXII-Set3.8 SBS SFSSBSSLASH PQSS BDS MoorLee94 RC Quei-Gels84XIV-Sec3.8IchiSkla84a IchiSkla84bAMB&BBSXV-Set3.8 LVWGA SA RGSSRMHC-PFl3.3 DTM Koll-3.4 MDLMIIIVI3.7 LVFgrouped depending on the type of generation procedure and evaluation function used. To our knowledge,there has not been any attempt to group the methods considering both steps. First, we have chosen a totalof 32 methods from the literature, and then these are grouped according to the combination of generationprocedure and evaluation function used (see Table 2).A distinct achievement of this framework is the finding of a number of combinations of generationprocedure and evaluation function (the empty boxes in the table) that do not appear in any existingmethod yet (to the best of our knowledge).In the framework, a column stands for a type of generation procedure and a row stands for a typeof evaluation function. The assignment of evaluation functions within the categories may be equivocal,because several evaluation functions may be placed in different categories when considering them indifferent perspectives, and one evaluation function may be obtained as a mathematicaltransformationof another evaluation function [4]. We have tried to resolve this as naturally as possible. In the nexttwo sections we explain each category and methods, and choose a method in each category, for a detaileddiscussion using pseudo code and a mini-dataset (Section 3), and for an empirical comparison (Section 4).3. Categoriesand Their DifferencesThere are a total of 15 (i.e., 5 types of evaluation functions and 3 types of generation procedures)combinations of generation procedures, and evaluation functions in Table 2, The blank boxes in the tablesignify that no method exists for these combinations. These combinations are the potential future work.In this section, we discuss each category, by briefly describing the methods under it, and then, choosinga representative method for each category. We explain it in detail with the help of its pseudo code anda hand-run over a prototypical dataset. The methods in the last row represent the “wrapper” methods,where the evaluation function is the “classifier error rate”. A typical wrapper method can use different
138M. Dash, H. Liu /IntelligentData Analysis 1 (1997) 131456Table 3Sixteen Instances of 0151110101001161111001kinds of classifiers for evaluation; hence no representative method is chosen for the categories under thisevaluation function. Instead they are discussed briefly as a whole towards the end of this section. Theprototypical dataset used for hand-run of the representative methods is shown in Table 3 which consistsof 16 instances (originally 32 instances) of original CorrAL dataset. This mini-dataset has binary classes,and six boolean features (Ao, A 1, Ba, Bi , I, C) where feature I is irrelevant, feature C is correlated tothe class label 75% of the time, and the other four features are relevant to the boolean target concept:(Ao\QAl) - (Bo\QBi).In all the pseudo codes, D denotes the training set, S is the original feature set,N is the number of features, T is the selected subset, and M is the number of selected (or required)features.3.1. Category I: Generation-Heuristic,Evaluation-Distance3. I. I. Brief Description of Various MethodsAs seen from Table 2, the most prominent method in this category is Relief [22]. We first discuss Reliefand its variant followed by a brief discussion on the other method.Relief uses a statistical method to select the relevant features. It is a feature weight-based algorithminspired by instance-based learning algorithms ([ 1 ,S]). From the set of training instances, it first chooses asample of instances, it first chooses a sample of instances; the user must provide the number of instances(NoSample) in this sample. Relief randomly picks this sample of instances, and for each instance in itfinds Near Hit and near Miss instances based on a Euclidean distance measure. Near Hit is the instancehaving minimum Euclidean distance among all instances of the same class as that of the chosen instance;near Miss is the instance having minimumEuclidean distance among all instances of different class.It updates the weights of the features that are initialized to zero in the beginning based on an intuitiveidea that a feature is more relevant if it distinguishes between an instance and its near Miss, and lessrelevant if it distinguishes between an instance and its near Hit. After exhausting all instances in thesample, it chooses all features having weight greater than or equal to a threshold. This threshold canbe automaticallyevaluated using a function that uses the number of instances in the sample; it can alsobe determined by inspection (all features with positive weights are selected). Relief works for noisyand correlated features, and requires only linear time in the number of given features and NoSample. Itworks both for nominal and continuous data. One major limitation is that it does not help with redundant
M. Dash, H. Liu / Intelligent Data Analysis 1 (1997) 131-156Relief( D, S, NoSample,139Threshold)(l)T @(2) Initialize all weights, lVi, to zero.(3) For i 1 to NoSample/*Arbitrarily chosen */Randomly choose an instance x in DFinds its nearHit and nearMissForj ltoNWj Wj - diff (xj , nearHitj)2 diff (xj , nearMissj)2(4) For j 1 to NIf Wj ThresholdAppend feature fj to T(5) Return TFig. 2. Relief.features and, hence, generates non-optimal feature set size in the presence of redundant features. Thiscan be overcome by a subsequent exhaustive search over the subsets of all features selected by Relief.Relief works only for binary classes. This limitation is overcome by Relief-F [25] that also tackles theproblem of incomplete data. Insufficient training instances Relief. Another limitation is that the user mayfind difficult in choosing a proper NoSample. More about this is discussed in Section 4.3.Jakub Segen’s [44] method uses an evaluation function that minimizesthe sum of a statisticaldiscrepancy measure and the feature complexity measure (in bits). It finds the first feature that bestdistinguishes the classes, and iteratively looks for additional features which in combinationwiththe previously chosen features improve class discrimination.This process stops once the minimalrepresentation criterion is achieved.3.1.2. Hand-Run of CorrAL Dataset (see Figure 2)Relief randomly chooses one instance from the sample. Let us assume instance # (i.e., [O,l,O,O,O,l]is chosen). It finds the near Hit and the near Miss of this instance using Euclidean distance measure.The difference between two discrete feature values is one if their values do not match and zerootherwise. For the chosen instance #5, the instance #l is the near Hit (Difirence5 l), and instance#13 and #14 are the near Miss (difierence 5 2). Let us choose instance #13 as the near Miss. Next, itupdates each feature weight Wj. This is iterated NoSample times specified by the user. Features havingweights greater than or equal to the threshold are selected. Usually, the weights are negative for irrelevantfeatures, and positive for relevant and redundant features. For CorrAL dataset is selects {Ao, Bo, BI, C}(more about this in Section 4.3).3.2. Category II: Generation-Complete,Evaluation-Distance3.2.1. Brief Description of Various MethodsThis combinationis found in old methods such as branch and bound [34]. Other methods in thiscategory are variations of branch and bound (B & B) method considering the generation procedure used(BFF [SO]), or the evaluation function used (Bobrowski’s method [5]). We first discuss the branch andbound method, followed by a brief discussion of the other two methods.
140M. Dash, H. Liu/IntelligentData Analysis I (1997) 131-156Narendra and Fukunaga have defined feature selection in a classical way (see definition 2 in Section 1)that requires evaluation functions be monotonic (i.e., a subset of features should not be better than anylarger set that contains the subset). This definition has a severe drawback for real-world problems becausethe appropriate size of the target feature subset is generally unknown. But this definition can be slightlymodified to make it applicable for general problems as well, by saying that B & B attempts to satisfy twocriteria: (i) the selected subset be as small as possible; and (ii) a bound be placed on the value calculatedby the evaluation function [ 131. As per this modification, B & B starts searching from the original featureset and it proceeds by removing features from it. A bound is placed on the value of the evaluationfunction to to create a rapid search. As the evaluation function obeys the monotonicityprinciple, anysubset for which the value is less than the bound is removed from the search tree (i.e., all subsets of it arediscarded from the search space). Evaluation functions generally used are: Mahalanobis distance [15],the discriminant function, the Fisher criterion, the Bhattacharya distance, and the divergence [34]. Xu,Yan, and Chang [50] proposed a similar algorithm (BFF), where the search procedure is modified tosolve the problem of searching an optimal path in a weighted tree with the informed best jrst searchstrategy in artificial intelligence. This algorithm guarantees the best global or subset without exhaustiveenumeration, for any criterion satisfying the monotonicityprinciple.Bobrowski [5] proves that the homogeneity coefficient f*Zk can be used in measuring the degree oflinear dependence among some measurements, and shows that it is applicable to the feature selectionproblem due to its monotonicityprinciple (i.e., if S1, Sz then f*Zk(&) f*Zk(&)).Hence, this can besuitably converted to a feature selection method by implementingit as an evaluation function for branchand bound with backtracking or a better first generation procedure.The fact that an evaluation function must be monotonic to be applicable to these methods, prevents theuse of many common evaluation functions. This problem is partially solved by relaxing the monotonicitycriterion and introducing the approximate monotonicity concept [ 161.3.2.2. Hand-run of CorrAL Dataset (see Figure 3)The authors use Mahalanobis distance measure as the evaluation function. The algorithm needs inputof the required number of features (M) and it attempts to find out the best subset of N 2M features toB&B(D, S, M)if (curd(S) M) {/* subset generation 7j OFor all features f in S {Sj S - f/* remove one feature at a time */ifis legitimate) */if ZsBetter( Sj , T)T Sj/* recursion */B&WSj, W}j 1return T })(SjFig. 3. Branch and bound.
M. Dash, H. Liu / Intelligent Data Analysis 1 (1997) 131-156141DTM( D)(1) T #(2) Apply C4.5 to the training set, D
databases and the consequent requirements for good machine learning techniques, new problems arise and novel approaches to feature selection are in demand. This survey is a comprehensive overview of many existing methods from the 1970's to the present. It identifies four steps of a typical feature selection method, and categorizes the .