Transcription
Machine LearningMachine Learning1. Linear RegressionLars Schmidt-ThiemeInformation Systems and Machine Learning Lab (ISMLL)Institute for Business Economics and Information Systems& Institute for Computer ScienceUniversity of Hildesheimhttp://www.ismll.uni-hildesheim.deLars Schmidt-Thieme, Information Systems and Machine Learning Lab (ISMLL), Institute BW/WI & Institute for Computer Science, University of HildesheimCourse on Machine Learning, winter term 20071/61Machine Learning1. The Regression Problem2. Simple Linear Regression3. Multiple Regression4. Variable Interactions5. Model Selection6. Case WeightsLars Schmidt-Thieme, Information Systems and Machine Learning Lab (ISMLL), Institute BW/WI & Institute for Computer Science, University of HildesheimCourse on Machine Learning, winter term 20071/61
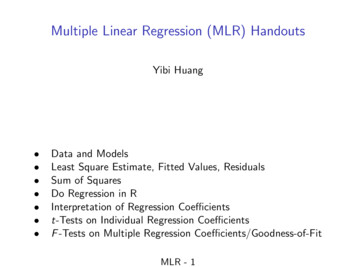
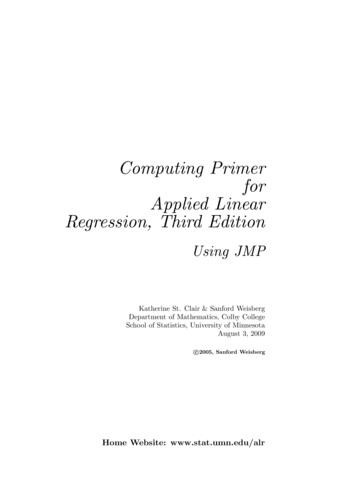
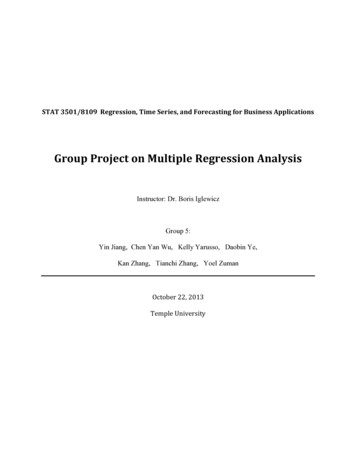
Machine Learning / 1. The Regression ProblemExampleExample: how does gas consumptiondepend on external temperature?(Whiteside, 1960s).weekly measurements of average external temperature total gas consumption(in 1000 cubic feets)A third variable encodes two heatingseasons, before and after wallinsulation.How does gas consumption depend onexternal temperature?How much gas is needed for a giventermperature ?Lars Schmidt-Thieme, Information Systems and Machine Learning Lab (ISMLL), Institute BW/WI & Institute for Computer Science, University of HildesheimCourse on Machine Learning, winter term 20071/61Machine Learning / 1. The Regression ProblemExample 7 Gas consumption (1000 cubic feet) 6 5 4 3 0246810Average external temperature (deg. C)linear modelLars Schmidt-Thieme, Information Systems and Machine Learning Lab (ISMLL), Institute BW/WI & Institute for Computer Science, University of HildesheimCourse on Machine Learning, winter term 20072/61
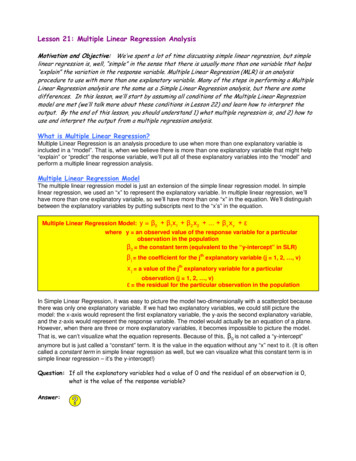
Machine Learning / 1. The Regression ProblemExample 7 7 6Gas consumption (1000 cubic feet)Gas consumption (1000 cubic feet) 5 4 36 5 4 3 0246810Average external temperature (deg. C)linear model 0246810Average external temperature (deg. C)more flexible modelLars Schmidt-Thieme, Information Systems and Machine Learning Lab (ISMLL), Institute BW/WI & Institute for Computer Science, University of HildesheimCourse on Machine Learning, winter term 20073/61Machine Learning / 1. The Regression ProblemVariable Types and CodingThe most common variable types:numerical / interval-scaled / quantitativewhere differences and quotients etc. are meaningful,usually with domain X : R,e.g., temperature, size, weight.nominal / discret / categorical / qualitative / factorwhere differences and quotients are not defined,usually with a finite, enumerated domain,e.g., X : {red, green, blue}or X : {a, b, c, . . . , y, z}.ordinal / ordered categoricalwhere levels are ordered, but differences and quotients are notdefined,usually with a finite, enumerated domain,e.g., X : {small, medium, large}Lars Schmidt-Thieme, Information Systems and Machine Learning Lab (ISMLL), Institute BW/WI & Institute for Computer Science, University of HildesheimCourse on Machine Learning, winter term 20074/61
Machine Learning / 1. The Regression ProblemVariable Types and CodingNominals are usually encoded as binary dummy variables: 1, if X x0,δx0 (X) : 0, elseone for each x0 X (but one).Example: X : {red, green, blue}Replaceone variable X with 3 levels: red, green, bluebytwo variables δred(X) and δgreen(X) with 2 levels each: 0, 1Xredgreenblue—δred(X)1001δgreen(X)0101Lars Schmidt-Thieme, Information Systems and Machine Learning Lab (ISMLL), Institute BW/WI & Institute for Computer Science, University of HildesheimCourse on Machine Learning, winter term 20075/61Machine Learning / 1. The Regression ProblemThe Regression Problem FormallyLetX1, X2, . . . , Xp be random variables called predictors (or inputs,covariates).Let X 1, X 2, . . . , X p be their domains.We write shortlyX : (X1, X2, . . . , Xp)for the vector of random predictor variables andX : X 1 X 2 · · · Xpfor its domain.Y be a random variable called target (or output, response).Let Y be its domain.D P(X Y) be a (multi)set of instances of the unknown jointdistribution p(X, Y ) of predictors and target called data.D is often written as enumerationD {(x1, y1), (x2, y2), . . . , (xn, yn)}Lars Schmidt-Thieme, Information Systems and Machine Learning Lab (ISMLL), Institute BW/WI & Institute for Computer Science, University of HildesheimCourse on Machine Learning, winter term 20076/61
Machine Learning / 1. The Regression ProblemThe Regression Problem FormallyThe task of regression and classification isto predict Y based on X,i.e., to estimateZr(x) : E(Y X x) y p(y x)dxbased on data (called regression function).If Y is numerical, the task is called regression.If Y is nominal, the task is called classification.Lars Schmidt-Thieme, Information Systems and Machine Learning Lab (ISMLL), Institute BW/WI & Institute for Computer Science, University of HildesheimCourse on Machine Learning, winter term 20077/61Machine Learning1. The Regression Problem2. Simple Linear Regression3. Multiple Regression4. Variable Interactions5. Model Selection6. Case WeightsLars Schmidt-Thieme, Information Systems and Machine Learning Lab (ISMLL), Institute BW/WI & Institute for Computer Science, University of HildesheimCourse on Machine Learning, winter term 20078/61
Machine Learning / 2. Simple Linear RegressionSimple Linear Regression ModelMake it simple: the predictor X is simple, i.e., one-dimensional (X X1). r(x) is assumed to be linear:r(x) β0 β1x assume that the variance does not depend on x:Y β0 β1x ,E( x) 0, V ( x) σ 2 3 parameters:β0 intercept (sometimes also called bias)β1 slopeσ 2 varianceLars Schmidt-Thieme, Information Systems and Machine Learning Lab (ISMLL), Institute BW/WI & Institute for Computer Science, University of HildesheimCourse on Machine Learning, winter term 20078/61Machine Learning / 2. Simple Linear RegressionSimple Linear Regression Modelparameter estimatesβ̂0, β̂1, σ̂ 2fitted liner̂(x) : β̂0 β̂1xpredicted / fitted valuesŷi : r̂(xi)residuals ˆi : yi ŷi yi (β̂0 β̂1xi)residual sums of squares (RSS)RSS nX ˆ2ii 1Lars Schmidt-Thieme, Information Systems and Machine Learning Lab (ISMLL), Institute BW/WI & Institute for Computer Science, University of HildesheimCourse on Machine Learning, winter term 20079/61
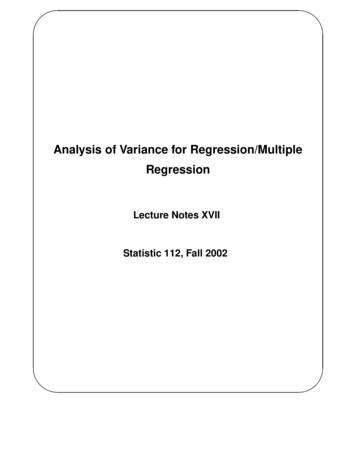
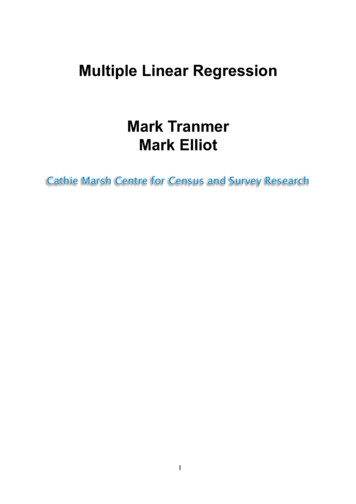
Machine Learning / 2. Simple Linear RegressionHow to estimate the parameters?Example:Given the data D : {(1, 2), (2, 3), (4, 6)}, predict a value for x 3.3 12y456 0 0123data45xLars Schmidt-Thieme, Information Systems and Machine Learning Lab (ISMLL), Institute BW/WI & Institute for Computer Science, University of HildesheimCourse on Machine Learning, winter term 200710/61Machine Learning / 2. Simple Linear RegressionHow to estimate the parameters?Example:Given the data D : {(1, 2), (2, 3), (4, 6)}, predict a value for x 3.Line through first two points:r̂(3) 4ŷi (yi ŷi)22030511543 2yi236 1i123P 0yRSS: 6y2 y1β̂1 1x2 x1β̂0 y1 β̂1x1 101234datamodel5xLars Schmidt-Thieme, Information Systems and Machine Learning Lab (ISMLL), Institute BW/WI & Institute for Computer Science, University of HildesheimCourse on Machine Learning, winter term 200711/61
Machine Learning / 2. Simple Linear RegressionHow to estimate the parameters?Example:Given the data D : {(1, 2), (2, 3), (4, 6)}, predict a value for x 3.Line through first and last point: 56y3 y1β̂1 4/3 1.333x3 x1β̂0 y1 β̂1x1 2/3 0.667 3y4 RSS: 12yiŷi (yi ŷi)22203 3.3330.1116600.111 0i123P01234datamodel5xr̂(3) 4.667Lars Schmidt-Thieme, Information Systems and Machine Learning Lab (ISMLL), Institute BW/WI & Institute for Computer Science, University of HildesheimCourse on Machine Learning, winter term 200712/61Machine Learning / 2. Simple Linear RegressionLeast Squares Estimates / DefinitionIn principle, there are many different methods to estimate theparameters β̂0, β̂1 and σ̂ 2 from data — depending on theproperties the solution should have.The least squares estimates are those parameters thatminimizennnXXX22RSS ˆi (yi ŷi) (yi (β̂0 β̂1xi))2i 1i 1i 1They can be written in closed form as follows:Pn(x x̄)(yi ȳ)Pn iβ̂1 i 12i 1 (xi x̄)β̂0 ȳ β̂1x̄n1 X 22σ̂ n 2 i 1 iLars Schmidt-Thieme, Information Systems and Machine Learning Lab (ISMLL), Institute BW/WI & Institute for Computer Science, University of HildesheimCourse on Machine Learning, winter term 200713/61
Machine Learning / 2. Simple Linear RegressionLeast Squares Estimates / ProofProof (1/2):RSS nX(yi (β̂0 β̂1xi))2i 1 RSS β̂0 nβ̂0 nXi 1nX!2(yi (β̂0 β̂1xi))( 1) 0yi β̂1xii 1Lars Schmidt-Thieme, Information Systems and Machine Learning Lab (ISMLL), Institute BW/WI & Institute for Computer Science, University of HildesheimCourse on Machine Learning, winter term 200714/61Machine Learning / 2. Simple Linear RegressionLeast Squares Estimates / ProofProof (2/2):RSS nX(yi (β̂0 β̂1xi))2i 1 nXi 1nX(yi (ȳ β̂1x̄) β̂1xi)2(yi ȳ β̂1(xi x̄))2i 1 RSS β̂1 nX!2(yi ȳ β̂1(xi x̄))( 1)(xi x̄) 0i 1Pn(y ȳ)(xi x̄)Pn iβ̂1 i 12i 1 (xi x̄)Lars Schmidt-Thieme, Information Systems and Machine Learning Lab (ISMLL), Institute BW/WI & Institute for Computer Science, University of HildesheimCourse on Machine Learning, winter term 200715/61
Machine Learning / 2. Simple Linear RegressionLeast Squares Estimates / ExampleExample:Given the data D : {(1, 2), (2, 3), (4, 6)}, predict a value for x 3.Assume simple linear model.x̄ 7/3, ȳ 11/3. 56i xi x̄ yi ȳ (xi x̄)2 (xi x̄)(yi ȳ)1 4/3 5/316/920/92 1/3 2/31/92/935/37/325/935/9P42/957/9 12Pn(x x̄)(yi ȳ)Pn iβ̂1 i 1 57/42 1.3572(x x̄)ii 16311 57 7β̂0 ȳ β̂1x̄ · 0.5342 3 126 3y4 0 01234datamodel5xLars Schmidt-Thieme, Information Systems and Machine Learning Lab (ISMLL), Institute BW/WI & Institute for Computer Science, University of HildesheimCourse on Machine Learning, winter term 200716/61Machine Learning / 2. Simple Linear RegressionLeast Squares Estimates / ExampleExample:Given the data D : {(1, 2), (2, 3), (4, 6)}, predict a value for x 3.Assume simple linear model.54 3 2yiŷi (yi ŷi)22 1.8570.0203 3.2140.0466 5.9290.0050.0711i123P 0yRSS: 6Pn(x x̄)(yi ȳ)Pn iβ̂1 i 1 57/42 1.3572(x x̄)i 1 i6311 57 7β̂0 ȳ β̂1x̄ · 0.5342 3 12601234datamodel5xr̂(3) 4.571Lars Schmidt-Thieme, Information Systems and Machine Learning Lab (ISMLL), Institute BW/WI & Institute for Computer Science, University of HildesheimCourse on Machine Learning, winter term 200717/61
Machine Learning / 2. Simple Linear RegressionA Generative ModelSo far we assumed the modelY β0 β1x ,E( x) 0, V ( x) σ 2where we required some properties of the errors, but not its exactdistribution.If we make assumptions about its distribution, e.g., x N (0, σ 2)and thusY N (β0 β1X, σ 2)we can sample from this model.Lars Schmidt-Thieme, Information Systems and Machine Learning Lab (ISMLL), Institute BW/WI & Institute for Computer Science, University of HildesheimCourse on Machine Learning, winter term 200718/61Machine Learning / 2. Simple Linear RegressionMaximum Likelihood Estimates (MLE)Let p̂(X, Y θ) be a joint probability density function for X and Ywith parameters θ.Likelihood:LD (θ) : nYp̂(xi, yi θ)i 1The likelihood describes the probabilty of the data.The maximum likelihood estimates (MLE) are thoseparameters that maximize the likelihood.Lars Schmidt-Thieme, Information Systems and Machine Learning Lab (ISMLL), Institute BW/WI & Institute for Computer Science, University of HildesheimCourse on Machine Learning, winter term 200719/61
Machine Learning / 2. Simple Linear RegressionLeast Squares Estimates and Maximum Likelihood EstimatesLikelihood:2LD (β̂0, β̂1, σ̂ ) : nYp̂(xi, yi) i 1nYp̂(yi xi)p(xi) i 1nYp̂(yi xi)i 1nYp(xi)i 1Conditional likelihood:nnYY(y ŷ )21 Pn (y ŷ )211 i 2icond2 2σ̂2σ̂ LD (β̂0, β̂1, σ̂ ) : p̂(yi xi) n e 2 i 1 i ie2π σ̂2π σ̂ ni 1i 1Conditional log-likelihood:n2log LcondD (β̂0 , β̂1 , σ̂ )1 X n log σ̂ 2(yi ŷi)22σ̂ i 1 if we assume normality, the maximum likelihood estimatesare just the minimal least squares estimates.Lars Schmidt-Thieme, Information Systems and Machine Learning Lab (ISMLL), Institute BW/WI & Institute for Computer Science, University of HildesheimCourse on Machine Learning, winter term 200720/61Machine Learning / 2. Simple Linear RegressionImplementation Details123456789101112131415simple-regression(D) :sx : 0, sy : 0for i 1, . . . , n dosx : sx xisy : sy yiodx̄ : sx/n, ȳ : sy/na : 0, b : 0for i 1, . . . , n doa : a (xi x̄)(yi ȳ)b : b (xi x̄)2odβ1 : a/bβ0 : ŷ β1 x̂return (β0 , β1 )Lars Schmidt-Thieme, Information Systems and Machine Learning Lab (ISMLL), Institute BW/WI & Institute for Computer Science, University of HildesheimCourse on Machine Learning, winter term 200721/61
Machine Learning / 2. Simple Linear RegressionImplementation Detailssingle D) :sx : 0, sy : 0for i 1, . . . , n dosx : sx xisy : sy yiodx̄ : sx/n, ȳ : sy/na : 0, b : 0for i 1, . . . , n doa : a (xi x̄)(yi ȳ)b : b (xi x̄)2odβ1 : a/bβ0 : ŷ β1 x̂return (β0 , β1 )123456789101112simple-regression(D) :sx : 0, sy : 0, sxx : 0, syy : 0, sxy : 0for i 1, . . . , n dosx : sx xisy : sy yisxx : sxx x2isyy : syy yi2sxy : sxy xi yiodβ1 : (n · sxy sx · sy)/(n · sxx sx · sx)β0 : (sy β1 · sx)/nreturn (β0 , β1 )Lars Schmidt-Thieme, Information Systems and Machine Learning Lab (ISMLL), Institute BW/WI & Institute for Computer Science, University of HildesheimCourse on Machine Learning, winter term 200721/61Machine Learning1. The Regression Problem2. Simple Linear Regression3. Multiple Regression4. Variable Interactions5. Model Selection6. Case WeightsLars Schmidt-Thieme, Information Systems and Machine Learning Lab (ISMLL), Institute BW/WI & Institute for Computer Science, University of HildesheimCourse on Machine Learning, winter term 200722/61
Machine Learning / 3. Multiple RegressionSeveral predictorsSeveral predictor variables X1, X2, . . . , Xp:Y β0 β1X1 β2X2 · · · βP XP pX β0 βiXi i 1with p 1 parameters β0, β1, . . . , βp.Lars Schmidt-Thieme, Information Systems and Machine Learning Lab (ISMLL), Institute BW/WI & Institute for Computer Science, University of HildesheimCourse on Machine Learning, winter term 200722/61Machine Learning / 3. Multiple RegressionLinear formSeveral predictor variables X1, X2, . . . , Xp:Y β0 pXβiXi i 1 hβ, Xi where β0 β1 β : . ,βp 1 X1 X : . ,Xp Thus, the intercept is handled like any other parameter, for theartificial constant variable X0 1.Lars Schmidt-Thieme, Information Systems and Machine Learning Lab (ISMLL), Institute BW/WI & Institute for Computer Science, University of HildesheimCourse on Machine Learning, winter term 200723/61
Machine Learning / 3. Multiple RegressionSimultaneous equations for the whole datasetFor the whole dataset (x1, y1), . . . , (xn, yn):Y Xβ where y1Y : . ,yn x1x1,1 x1,2.X : . .xnxn,1 xn,2 . . . x1,p. ,. . . xn,p 1 : . , nLars Schmidt-Thieme, Information Systems and Machine Learning Lab (ISMLL), Institute BW/WI & Institute for Computer Science, University of HildesheimCourse on Machine Learning, winter term 200724/61Machine Learning / 3. Multiple RegressionLeast squares estimatesLeast squares estimates β̂ minimize Y Ŷ 2 Y Xβ̂ 2The least squares estimates β̂ are computed viaXT Xβ̂ XT YProof: Y Xβ̂ 2 hY Xβ̂, Y Xβ̂i (. . .) β̂! 2h X, Y Xβ̂i 2(XT Y XT Xβ̂) 0Lars Schmidt-Thieme, Information Systems and Machine Learning Lab (ISMLL), Institute BW/WI & Institute for Computer Science, University of HildesheimCourse on Machine Learning, winter term 200725/61
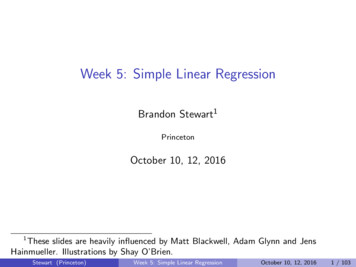
Machine Learning / 3. Multiple RegressionHow to compute least squares estimates β̂Solve the p p system of linear equationsX T X β̂ X T Yi.e., Ax b (with A : X T X, b X T Y, x β̂).There are several numerical methods available:1. Gaussian elimination2. Cholesky decomposition3. QR decompositionLars Schmidt-Thieme, Information Systems and Machine Learning Lab (ISMLL), Institute BW/WI & Institute for Computer Science, University of HildesheimCourse on Machine Learning, winter term 200726/61Machine Learning / 3. Multiple RegressionHow to compute least squares estimates β̂ / ExampleGiven is the following data:x11245x22315y3271Predict a y value for x1 3, x2 4.Lars Schmidt-Thieme, Information Systems and Machine Learning Lab (ISMLL), Institute BW/WI & Institute for Computer Science, University of HildesheimCourse on Machine Learning, winter term 200727/61
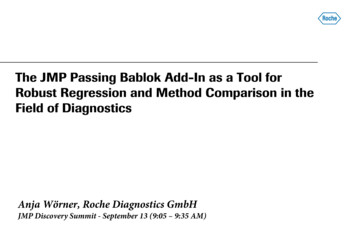
Machine Learning / 3. Multiple RegressionHow to compute least squares estimates β̂ / ExampleY β0 β1X1 2.95 0.1X1 Y β0 β2X2 6.943 1.343X2 datamodel 3 34 11 2 2 14y45 23y 66datamodel5 77 512x1345x2ŷ(x1 3) 3.25ŷ(x2 4) 1.571Lars Schmidt-Thieme, Information Systems and Machine Learning Lab (ISMLL), Institute BW/WI & Institute for Computer Science, University of HildesheimCourse on Machine Learning, winter term 200728/61Machine Learning / 3. Multiple RegressionHow to compute least squares estimates β̂ / Exampleto the data:Now fitx11245Y β0 β1X1 β2X2 1 1X 11 1245 23 ,1 5 4 12 11X T X 12 46 37 ,11 37 39x22315y3271 3 2 Y 7 1 13X T Y 40 24Lars Schmidt-Thieme, Information Systems and Machine Learning Lab (ISMLL), Institute BW/WI & Institute for Computer Science, University of HildesheimCourse on Machine Learning, winter term 200729/61
Machine Learning / 3. Multiple RegressionHow to compute least squares estimates β̂ / Example 4 12 11 134 12 11 134 12 1113 12 46 37 40 0 10 41 0 10 41 11 37 39 240 16 35 470 0 143 243 134 12 112860 0 1597 0 1430 0 1115 0 1430 0 1115 00 143 24300 143 243i.e., 1597/2865.583β̂ 1115/1430 0.779 243/143 1.699Lars Schmidt-Thieme, Information Systems and Machine Learning Lab (ISMLL), Institute BW/WI & Institute for Computer Science, University of HildesheimCourse on Machine Learning, winter term 200730/61Machine Learning / 3. Multiple RegressionHow to compute least squares estimates β̂ / Example10864y20 2x2x1 4Lars Schmidt-Thieme, Information Systems and Machine Learning Lab (ISMLL), Institute BW/WI & Institute for Computer Science, University of HildesheimCourse on Machine Learning, winter term 200731/61
Machine Learning / 3. Multiple RegressionHow to compute least squares estimates β̂ / ExampleTo visually assess the model fit, a plotresiduals ˆ y ŷ vs. true values ycan be plotted:y hat y0.02 0.02 1234567yLars Schmidt-Thieme, Information Systems and Machine Learning Lab (ISMLL), Institute BW/WI & Institute for Computer Science, University of HildesheimCourse on Machine Learning, winter term 200732/61Machine Learning / 3. Multiple Regression0.4The Normal Distribution (also Gaussian)0.10.0with parameters:µ mean,σ standard deviance.probability density function (pdf):phi(x)X N (µ, σ 2)0.20.3written as:(x µ)21 φ(x) : e 2σ22πσ 3 2 10123123Φ and Φ 1 have no analytical form, buthave to computed numerically.0.4Φ 1 is called quantile function.0.0 Phi(x)cummulative density function (cdf):Z xΦ(x) : φ(x)dx0.8x 3 2 10Lars Schmidt-Thieme, Information Systems and Machine Learning Lab (ISMLL), Institute BW/WI & Institute for Computer Science, University of HildesheimCourse on Machine Learning, winter term 200733/61x
Machine Learning / 3. Multiple RegressionThe t Distributionp 5p 10p 50X tpf(x)with parameter:p degrees of freedom.0.1probability density function (pdf):0.20.3written as:1.00.0Γ( p 1x2 p 12 )p(x) : (1 ) 2Γ( p2 )p 6 4 20246xp 0.20.4F(x)0.60.8tp N (0, 1)0.0p 5p 10p 50Lars Schmidt-Thieme, Information Systems and Machine Learning Lab (ISMLL), Institute BW/WI& Institutefor 2Computerof Hildesheim 6 40 Science,2 University46Course on Machine Learning, winter term 200734/61xMachine Learning / 3. Multiple Regression0.15The χ2 Distributionp 5p 7p 10written as:0.05f(x)with parameter:p degrees of freedom.0.10X χ2p1.00.00probability density function (pdf):px12 1 e 2p(x) : xΓ(p/2)2p/215200.80.6Xi2 χ2p0.00.20.4i 110F(x)Y : 5xIf X1, . . . , Xp N (0, 1), thenpX0p 5p 7p 10Lars Schmidt-Thieme, Information Systems and Machine Learning Lab (ISMLL), Institute BW/WI& Instituteof Hildesheim05 for Computer10 Science, University1520Course on Machine Learning, winter term 200735/61
Machine Learning / 3. Multiple RegressionParameter Varianceβ̂ (XT X) 1XT Y is an unbiased estimator for β (i.e., E(β̂) β).Its variance isV (β̂) (X T X) 1σ 2proof:β̂ (XT X) 1XT Y (XT X) 1XT (Xβ ) β (XT X) 1XT As E( ) 0: E(β̂) βV (β̂) E((β̂ E(β̂))(β̂ E(β̂))T ) E((XT X) 1XT T X(XT X) 1) (XT X) 1σ 2Lars Schmidt-Thieme, Information Systems and Machine Learning Lab (ISMLL), Institute BW/WI & Institute for Computer Science, University of HildesheimCourse on Machine Learning, winter term 200736/61Machine Learning / 3. Multiple RegressionParameter VarianceAn unbiased estimator for σ 2 isnn1 X 21 X2σ̂ ˆi (y ŷ)2n p i 1n p i 1If N (0, σ 2), thenβ̂ N (β, (X T X) 1σ 2)Furthermore(n p)σ̂ 2 σ 2χ2n pLars Schmidt-Thieme, Information Systems and Machine Learning Lab (ISMLL), Institute BW/WI & Institute for Computer Science, University of HildesheimCourse on Machine Learning, winter term 200737/61
Machine Learning / 3. Multiple RegressionParameter Variance / Standardized coefficientstandardized coefficient (“z-score”):zi : β̂i,sce(β̂i)2with sce (β̂i) the i-th diagonal element of (X T X) 1σ̂ 2zi would be zi N (0, 1) if σ is known (under H0 : βi 0).With estimated σ̂ it is zi tn p.The Wald test for H0 : βi 0 with size α is:reject H0 if zi αβ̂i Ft 1(1 )n p2sce(β̂i)i.e., its p-value isp-value(H0 : βi 0) 2(1 Ftn p ( zi )) 2(1 Ftn p ( β̂i ))sce(β̂i)and small p-values such as 0.01 and 0.05 are good.Lars Schmidt-Thieme, Information Systems and Machine Learning Lab (ISMLL), Institute BW/WI & Institute for Computer Science, University of HildesheimCourse on Machine Learning, winter term 200738/61Machine Learning / 3. Multiple RegressionParameter Variance / Confidence intervalThe 1 α confidence interval for βi:αβi Ft 1(1 )sce(β̂i)n p2For large n, Ftn p converges to the standard normal cdf Φ.As Φ 1(1 0.052 ) 1.95996 2, the rule-of-thumb for a 5%confidence interval isβi 2sce(β̂i)Lars Schmidt-Thieme, Information Systems and Machine Learning Lab (ISMLL), Institute BW/WI & Institute for Computer Science, University of HildesheimCourse on Machine Learning, winter term 200739/61
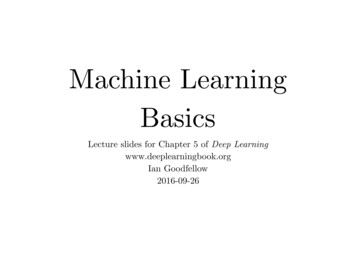
Machine Learning / 3. Multiple RegressionParameter Variance / Exampleto the data:We have already fittedx11245RSSŶ β̂0 β̂1X1 β̂2X2 5.583 0.779X1 1.699X2x22315y3271 ˆ2 (y 52.0457.0030.986n11 X 20.00350 0.00350σ̂ ˆi n p i 14 3 0.00520 0.00075 0.00076(X T X) 1σ̂ 2 0.00075 0.00043 0.00020 0.00076 0.00020 0.000492covariate β̂isce(β̂i) z-score(intercept) 5.583 0.0721 77.5X10.779 0.0207 37.7X2 1.699 0.0221 76.8p-value0.00820.01690.0083Lars Schmidt-Thieme, Information Systems and Machine Learning Lab (ISMLL), Institute BW/WI & Institute for Computer Science, University of HildesheimCourse on Machine Learning, winter term 200740/61Machine Learning / 3. Multiple RegressionParameter Variance / Example 240 0.5Illiteracy 60 50 4500 6000 Life Exp 3000 HS Grad 687072 702.51.5 603000 Income50 60002.545001.5 40state dataset: income (per capita, 1974), illiteracy (percent of population,1970), life expectancy (in years, 1969–71), percent high-school graduates(1970). population (July 1, 1975) murder rate per 100,000 population(1976) mean number of days with minimumtemperature below freezing(1931–1960) in capital or large city land area in square miles0.572Lars Schmidt-Thieme, Information Systems and Machine Learning Lab (ISMLL), Institute BW/WI & Institute for Computer Science, University of HildesheimCourse on Machine Learning, winter term 200741/6168Example: sociographic data of the 50US states in 1977.
Machine Learning / 3. Multiple RegressionParameter Variance / Example 2Murder β0 β1Population β2Income β3Illiteracy β4LifeExp β5HSGrad β6Frost β7Arean 50 states, p 8 parameters, n p 42 degrees offreedom.Least squares estimators:Estimate Std. Error t value Pr( t )(Intercept) 1.222e 02 1.789e 016.831 2.54e-08 ***Population1.880e-04 6.474e-052.905 0.00584 **Income-1.592e-04 5.725e-04 -0.278 0.78232Illiteracy1.373e 00 8.322e-011.650 0.10641‘Life Exp‘ -1.655e 00 2.562e-01 -6.459 8.68e-08 ***‘HS Grad‘3.234e-02 5.725e-020.565 0.57519Frost-1.288e-02 7.392e-03 -1.743 0.08867 .Area5.967e-06 3.801e-061.570 0.12391Lars Schmidt-Thieme, Information Systems and Machine Learning Lab (ISMLL), Institute BW/WI & Institute for Computer Science, University of HildesheimCourse on Machine Learning, winter term 200742/61Machine Learning1. The Regression Problem2. Simple Linear Regression3. Multiple Regression4. Variable Interactions5. Model Selection6. Case WeightsLars Schmidt-Thieme, Information Systems and Machine Learning Lab (ISMLL), Institute BW/WI & Institute for Computer Science, University of HildesheimCourse on Machine Learning, winter term 200743/61
Machine Learning / 4. Variable InteractionsNeed for higher orders 150100 50Can we catch such a dependency? yExample: way length vs. duration of amoving object with constantacceleration a.1s(t) at2 2200Assume a target variable does notdepend linearly on a predictor variable,but say quadratic. 0Can we catch it with a linear model? 02468xLars Schmidt-Thieme, Information Systems and Machine Learning Lab (ISMLL), Institute BW/WI & Institute for Computer Science, University of HildesheimCourse on Machine Learning, winter term 200743/61Machine Learning / 4. Variable InteractionsNeed for general transformationsTo describe many phenomena, even more complex functions ofthe input variables are needed.Example: the number of cells n vs. duration of growth t:n βeαt n does not depend on t directly, but on eαt (with a known α).Lars Schmidt-Thieme, Information Systems and Machine Learning Lab (ISMLL), Institute BW/WI & Institute for Computer Science, University of HildesheimCourse on Machine Learning, winter term 200744/61
Machine Learning / 4. Variable InteractionsNeed for variable interactionsIn a linear model with two predictorsY β0 β1X1 β2X2 Y depends on both, X1 and X2.But changes in X1 will affect Y the same way, regardless of X2.There are problems where X2 mediates or influences the way X1affects Y , e.g. : the way length s of a moving object vs. itsconstant velocity v and duraction t:s vt Then an additional 1s duration will increase the way length not ina uniform way (regardless of the velocity), but a little for smallvelocities and a lot for large velocities.v and t are said to interact: y does not depend only on eachpredictor separately, but also on their product.Lars Schmidt-Thieme, Information Systems and Machine Learning Lab (ISMLL), Institute BW/WI & Institute for Computer Science, University of HildesheimCourse on Machine Learning, winter term 200745/61Machine Learning / 4. Variable InteractionsDerived variablesAll these cases can be handled by looking at derived variables,i.e., instead ofY β0 β1X12 Y β0 β1eαX1 Y β0 β1X1 · X2 one looks atY β0 β1X10 withX10 : X12X10 : eαX1X10 : X1 · X2Derived variables are computed before the fitting process andtaken into account either additional to the original variables orinstead of.Lars Schmidt-Thieme, Information Systems and Machine Learning Lab (ISMLL), Institute BW/WI & Institute for Computer Science, University of HildesheimCourse on Machine Learning, winter term 200746/61
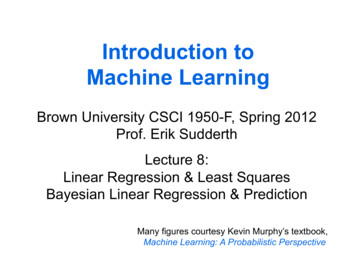
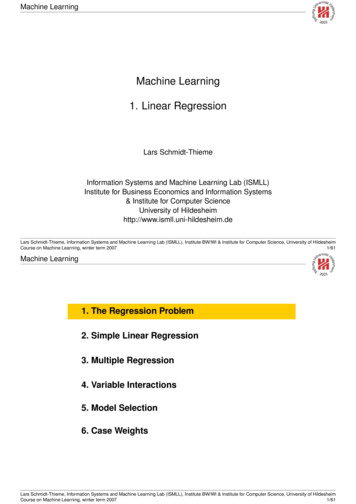
Machine Learning1. The Regression Problem2. Simple Linear Regression3. Multiple Regression4. Variable Interactions5. Model Selection6. Case WeightsLars Schmidt-Thieme, Information Systems and Machine Learning Lab (ISMLL), Institute BW/WI & Institute for Computer Science, University of HildesheimCourse on Machine Learning, winter term 200747/61Machine Learning / 5. Model Selection200Underfitting 100 050y 0 datamodel 2468xIf a model does not well explain the data,e.g., if the true model is quadratic, but we try to fit a linear model,one says, the model underfits.Lars Schmidt-Thieme, Information Systems and Machine Learning Lab (ISMLL), Institute BW/WI & Institute for Computer Science, University of HildesheimCourse on Machine Learning, winter term 200747/61
Machine Learning / 5. Model SelectionOverfitting / Fitting Polynomials of High Degree4 2y68 datamodel 0 02468xLars Schmidt-Thieme, Information Systems and Machine Learning Lab (ISMLL), Institute BW/WI & Institute for Computer Science, University of HildesheimCourse on Machine Learning, winter term 200748/61Machine Learning / 5. Model SelectionOverfitting / Fitting Polynomials of High Degree4 2y68 datamodel 0 02468xLars Schmidt-Thieme, Information Systems and Machin
Lars Schmidt-Thieme, Information Systems and Machine Learning Lab (ISMLL), Institute BW/WI & Institute for Computer Science, University of Hildesheim Course on Machine Learning, winter term 2007 12/ 61 Machine Learning / 2. Simple Linear Regression Least Squares Estimates / Denition In principle, there are many different methods to estimate the