Transcription
BD BiosciencesWhite PaperMay 2012Using the BD Accuri C6 Cytometer for Rapid and Accurate Analysis of theNuclear DNA Contents of Flowering PlantsUsing the BD Accuri C6 Cytometer forRapid and Accurate Analysis of the NuclearDNA Contents of Flowering PlantsDavid W. Galbraith and Georgina M. LambertUniversity of Arizona, Department of Plant Sciences and Bio5 Institute for Collaborative BioresearchWhite PaperContents1Summary2Introduction2Materials and Methods5Results8Discussion and GeneralTroubleshooting10Notes10Author Contact Information10ReferencesSummaryThe nuclear DNA content (C-value) is a fundamental parameter of eukaryoticcells. Flow cytometry provides the most convenient and accurate way todetermine C-values of plants, but sampling of the approximately 480,000 speciesof angiosperms (flowering plants) remains very limited, only about 1% beingreported. For plant species for which C-values are available, these values spanan extraordinary range, approximately 1250-fold (0.2 pg to 254.8 pg). For plantsfor which C-values are unknown, this complicates analysis using flow cytometry,when the range of possible C-values exceeds the dynamic range of the flowcytometer. Various instrument settings (amplification values, PMT high voltages,and laser outputs) require adjustment to optimally position the 2C peak valuesfor the unknowns and the appropriate controls within the fluorescence frequencydistributions. Although this can be done empirically, it considerably slows downthe sample throughput.The BD Accuri C6 flow cytometer is ideally suited for determining C-valuesfor new plant species. The unusually high dynamic range of the ADC allowssimultaneous analysis of species for which C-values span almost the entire rangeof the described angiosperms. This white paper describes the way in whichC-value determinations are done, including technical details for avoidingcontribution from cellular debris, and includes typical measurements from plantspecies to illustrate the dynamic range of the measurements.
BD BiosciencesWhite PaperMay 2012Using the BD Accuri C6 Cytometer for Rapid and Accurate Analysis of theNuclear DNA Contents of Flowering PlantsIntroductionFlow cytometry is the simplest way to determine plant nuclear DNA contents.1To allow the nuclei to pass through the flow cell, the plant tissues are homogenizedby chopping, using a razor blade, in a suitable buffer. After filtration of thehomogenate to remove large particulate materials, the samples are stained withDNA-specific fluorochromes and the fluorescence is quantified.The absolute values for the amounts of the plant nuclear DNA are found bycomparison to cells or nuclei of known DNA content, such as chicken red bloodcells1 or plant standards2,3 (see also hyperlink c in Table 1). Standardization iscomplicated by base-pair specificity inherent to some fluorochromes (DAPI andHoechst 33257 being AT-specific,3 and mithramycin and chromomycin A3 beingGC-specific). The fluorescence produced by intercalating fluorochromes, of whichpropidium iodide (PI) is the most popular, is not biased by base-pair composition,and staining in the presence of RNAse eliminates interference by double-strandedRNA.In this white paper, we provide detailed information about how to use theBD Accuri C6 flow cytometer for the analysis of plant genome sizes. The DNAhistograms produced by the BD Accuri C6 display excellent peak CVs, and thisinstrument, uniquely, can provide simultaneous linear estimates of nuclear DNAcontent spanning at least two orders of magnitude (a range of 0.34 to 80.9 pg).This covers most of the C-values encountered in the flowering plants found acrossthe world. Galbraith4 provides a fuller discussion.Materials and MethodsMaterialsThe seeds mentioned in this paper are available from Lehle Seeds (Round Rock,TX 78680-2366 USA) and from J. Dolezel (Olomouc, Czech Republic).Plant ProductionWe germinated all seeds, except those of Arabidopsis, in 3-inch plastic potscontaining Scotts Metro-Mix 3000 (The Scotts Miracle-Gro Company,Marysville, Ohio) in a growth room at 25 C under a 12/12 light dark cycle witha light intensity of 150 to 175 μeinstein/m-2 /sec-1. Plants were watered daily.Samples were generally taken after four weeks of plant growth.For Arabidopsis, we germinated seeds and grew plants under sterile conditionsusing an established procedure.5 In brief, seeds were sterilized by immersion for5 minutes in a freshly prepared solution of commercial bleach diluted 1:1 withdistilled water containing 10 μL/mL of Triton -X100. The seeds were then rinsedthree times in sterile distilled water and planted on Murashige and Skoog (MS)agar plates supplemented with 2% sucrose and 1.2% agar. The seeds on the plateswere vernalized by incubation at 4 C for 2 days before transfer to a Convirongrowth chamber under a 12-h day/12-h night illumination regime, with anincident light flux of 150 to 175 μm/m-2/sec-1 and a temperature of 22 C (day)and 20 C (night).The plates were kept in a vertical orientation so that the roots grew on the surfaceof, rather than within, the agar medium. Samples were harvested the day of theflow analyses.We purchased plants of Astroemeria aurea (Lily of the Incas) from a localsupermarket. The plants were supplied by Inter-American Products, Cincinnati,Ohio.
BD BiosciencesWhite PaperMay 2012Using the BD Accuri C6 Cytometer for Rapid and Accurate Analysis of theNuclear DNA Contents of Flowering PlantsPage 3Propidium iodide was obtained from Calbiochem (EMD Chemicals, Gibbstown,NJ; Cat. No. 537059), and a stock solution (1 mg/mL) in deionized water wasprepared and stored in aliquots at -20 C. RNAse A (10 mg/mL in water) wasfrom Fermentas (Glen Burnie, MD; Cat. No. EN0531) and was stored at 4 C.Nylon filters were from Partec (Swedesboro, NJ; Cat. No. 04-0042-231). Theyhave a notional porosity of 30 μm. Razor blades were obtained from VWR(VWR International, West Chester, PA; Cat. No. 55411-050).Preparation of Plant Homogenates and Labeling of NucleiAll procedures were done at 4 C or on ice. Approximately 50–100 mg of planttissue was excised and placed in a plastic 60-mm petri dish standing on a prechilled metal plate placed on ice in a rectangular plastic tray. We recommendthat the procedures all be done in a walk-in cold room. Galbraith’s buffersupplemented with 0.1% w/v Triton X-1001 was added in the proportion of 1.5mL of buffer per 100 mg of tissue. Tissues were chopped using a new razor bladefor 2 to 3 minutes. Each slicing action of the razor blade should cut cleanly andwithout bruising the tissue. The razor blade was discarded after a single use. Thehomogenate was filtered through the 30-μm nylon filter. The homogenate (0.5mL) was added to a labeled tube containing 2.5 μL of 10 mg/mL of DNAse-freeRNAse A and incubated on ice for 15 minutes. Propidium iodide was then addedto a final concentration of 50 μg/mL. The stained samples were incubated on icein darkness for 30 minutes prior to analysis.Flow CytometryThe BD Accuri C6 flow cytometer was switched on and allowed to warm up for15 minutes before analyses were begun. Waste and sheath fluid bottles werechecked during this time, and emptied or refilled as required. BD Accuri C6software was started. Performance validation of the BD Accuri C6 was then doneusing 6- and 8-peak fluorescent bead mixtures (Spherotech) according toinstructions (BD Accuri C6 Software User Guide). Finally, the Plant DNAAnalysis Template was opened. This template consists of the following plots andhistograms: FSC-A vs SSC-A, FL1-A vs FL2-A, FL3-A vs FL2-A, and a univariatehistogram of FL2A. The fluorescence signals (pulse area measurements) werescreened by the following filter configurations: (a) FL-1: a 530/14-nm bandpassfilter (b) FL-2: a 585/20-nm bandpass filter, and (c) FL-3: a 670-nm longpassfilter. Analysis of the homogenates was based on light-scatter and fluorescencesignals produced from 20-mW laser illumination at 488 nm.Plant homogenate samples were introduced to the SIP, and the RUN tab wasclicked in BD Accuri C6 software to initiate data acquisition. Threshold levelswere set empirically to eliminate from detection the large amounts of irrelevantdebris that are found in plant homogenates. The default threshold values on theBD Accuri C6 are set at 80,000, and this setting excludes from analysis verysmall nuclei. We set the threshold at 10,000 for FSC, with a secondary thresholdof 1,000 for FL-2. These values were adjusted while acquiring data and observingthe position of the nuclei on the bivariate dot plots such that all the nuclei wereon scale with the least amount of debris appearing in these plots. The flowcytometer was routinely operated at the Slow flow rate setting (14 μL of sampleper minute), and data acquisition for a single sample should typically take 3 to5 minutes.The PI-stained nuclei appeared on the bivariate plots as a region of dots clusteredaround a diagonal line. This region contained two populations of nuclei for nonendoreduplicated species. Additional populations are seen if somaticendoreduplication occurs. A polygonal gate was drawn to enclose the nuclei, andunivariate histograms of PI fluorescence (FL2-A) were accumulated based on this
BD BiosciencesWhite PaperMay 2012Using the BD Accuri C6 Cytometer for Rapid and Accurate Analysis of theNuclear DNA Contents of Flowering Plantsgate. The zoom tool was used to locate and isolate the peaks appearing withinthis univariate histogram. Regions of identification were then placed across thelowest peaks to export values representing peak positions and CVs. The datawas used to calculate the DNA content of the nuclei.TroubleshootingOccasionally, low yields of intact nuclei from the chopping procedure areencountered. This is usually due to the poor condition of the source tissue. Sourcetissues should be fresh, young, and well hydrated. Old or dried-out tissues donot generally provide histograms of adequate quality. Grasses are oftenproblematic, and one may need to use more than the 200-mg sample sizesuggested in the protocol to provide sufficient nuclei for analysis. The tissues ofsome species can be refrigerated in damp paper towels for up to two days priorto analysis, should this be necessary. Freezing tissues is not recommended.Some plants may release mucilaginous compounds into the chopping buffer,resulting in slime, which should not be run through the instrument. Other speciescan release secondary plant products that reduce fluorochrome fluorescence.Careful observation of the samples during chopping is recommended; anychanges in homogenate color and consistency are contraindications. If these areobserved, alternatives are to employ different parts of the plant for analysis, and/or to include additives to the chopping buffer to absorb secondary products.Dolezel et al3 provide additional suggestions for sample preparation in thesesituations.Poor CVs may be the result of excessive chopping, or chopping with dull razorblades. Many sources exist for satisfactory blades (VWR Scientific, FisherScientific, Personna, America Safety Razor Company), which generally shouldhave an edge thickness of 0.22 mm or finer. Double-edged shaving blades areideal, except that one must find or devise suitable holders for them to avoidaccidental injury. Unstable (drifting) peak positions may be due to insufficientperiods of staining. In this white paper, we have recommended 15 minutes, butit is possible that some species may require longer staining times. This can beeasily monitored by flow analysis over time of successive samples taken from asingle stained homogenate.Table 1. Names of plant species, source of seeds, 2c.Common nameSource of plants2C DNADNA content attributioncontent (pg)and hyperlinksThale cress0.32Kew C-value Database(Bennett and Leitch, 2004)Lehle SeedsaRaphanus sativus cv. SaxaRadish1.11Olomouc website(Dolezel et al, 2007)J. DolezelbMedicago sativa L. cv. CimarronAlfalfa3.5Kew C-value Database(Bennett and Leitch, 2004)Lehle SeedsaPisum sativum L. cv. CtiradGarden pea9.09Secale cereale L. cv. DankovskeRye16.19Triticum aestivum L. line 812Wheat34.65Kew C-value Database(Bennett and Leitch, 2004)Lehle SeedsaAlstroemeria aurea Grah.Lily of the Incas80.9Kew C-value Database(Bennett and Leitch, 2004)Inter-AmericanProductscSpeciesArabidopsis thaliana z/research/protocols.php?protocols dnahttp://www.interamericanproducts.comOlomouc website(Dolezel et al, 2007)Olomouc website(Dolezel et al, 2007)J. DolezelbJ. Dolezelb
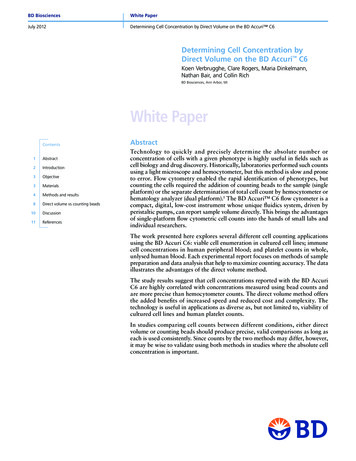
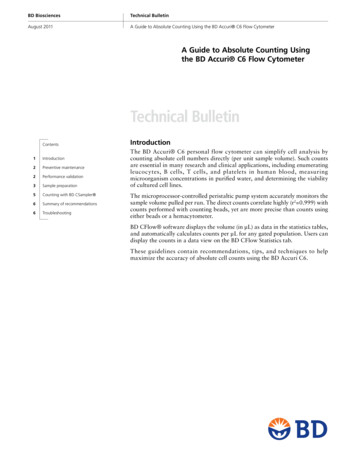
BD BiosciencesWhite PaperMay 2012Using the BD Accuri C6 Cytometer for Rapid and Accurate Analysis of theNuclear DNA Contents of Flowering PlantsPage 5ResultsThe plants used in this study are identified in Table 1, along with their 2C DNAcontent values. A particularly useful resource is the C-value database maintainedby Drs. Leitch and Bennett at The Royal Botanical Gardens, Kew.6Figure 1A shows the biparametric frequency distribution (FL2-A vs FL3-A) of aPI-stained homogenate prepared from pea (Pisum sativum) leaf tissue, asanalyzed by the BD Accuri C6 flow cytometer. Pea has a reasonably large nucleargenome, and is known to produce high quality uniparametric DNA histograms.Two clusters are seen within this frequency distribution. One roughly star-shapedcluster (arrow), which comprises most of the objects in the homogenate,corresponds to subcellular debris. No correlation is seen between the FL2 andFL3 signals within this cluster. The second cluster, boxed in red, forms a veryminor proportion (1.8%) of the objects detected by the flow cytometer. Objectsin this population exhibit a very strong correlation between the FL2 and FL3signals, as would be predicted for PI-stained nuclei. If you place gates aroundthis population (region P), the gated objects provide a very nice uniparametricDNA distribution with clearly defined G0/G1 and G2 peaks. The peak positionsin this case are 533,898.3 and 1,065,516.0 fluorescence units (a ratio of 1:1.996).The CVs for the G0/G1 peak are 2.1% (when determined using BD Accuri C6Software, after manually positioning windows at the 50% points on either sideof the peak), and 2.6% (when determined using SigmaPlot software, withfitting of a Gaussian function to the extracted data). This histogram is typicalof the nuclear DNA contents found within non-endoreduplicated plant tissues.1,7“The BD Accuri C6 cytometer and BD Accuri C6 software have far exceededour expectations. The BD Accuri C6 cytometer provides important additionaldata that we have previously been missing. One is the highly accurate volumedetermination, so that absolute cell counts are automatically recorded for eachexperiment. Secondly, the six-log scale means that we can collect all datawithout compensation, so that runs from different days can be more easilycompared. Overall, we are extremely pleased with the BD Accuri C6 cytometer,and would highly recommend it.”- Associate Professor of Immunology and PediatricsBA105P (1.8%)104Number of NucleiFL3-AGated on Region A (x 10-5)Figure 1. Flow analysis of homogenates from pea seedling tissue.(A) Biparametric dot plot of FL2-A (585/40 nm) vs FL3-A ( 670 nm) fluorescence emission. (B)Uniparametric histogram of FL2-A fluorescence, gated on region P1 of panel A.
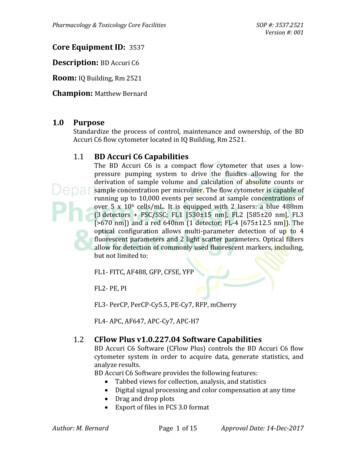
BD BiosciencesWhite PaperMay 2012Using the BD Accuri C6 Cytometer for Rapid and Accurate Analysis of theNuclear DNA Contents of Flowering PlantsFigure 2A illustrates the corresponding biparametric frequency distributionobtained from leaf homogenates of Arabidopsis thaliana, which contains one ofthe smallest genomes of flowering plants ( 157Mb,8 or a 2C value of 0.32 pg).Arabidopsis exhibits endoreduplication within most of its somatic tissues andorgans,7 and this produces multiple clusters within the frequency distributions,corresponding to an endoreduplicative series (2C, 4C, 8C, 16C, etc). Theseclusters fall on the characteristic PI-DNA diagonal, which becomes particularlyobvious following electronic expansion of the region in which it falls (Figure 2B).Gating around this expanded region (P1, 1.2% of the detected signals) providesuniparametric distributions with well-defined peaks (Figure 2C) typical ofArabidopsis thaliana.7 The mean fluorescence values of the peak positions forthe nuclei are 24,541.9, 47,446.1, 91,698.5, and 179,634.1, which fit a straightline almost perfectly (r2 0.9999). The CVs are also very acceptable (3.6%, 2.7%,2.2%, and 2.4%). Similar results are seen for Arabidopsis root homogenates(Figures 2D, 2E). The nuclei comprise a slightly larger proportion of the detectedsignals (region P1), probably due to the absence of chloroplasts from roots. Gatingon region P1 again provides uniparametric histograms of excellent quality andlinearity (Figure 2F): the fluorescence values of the peaks are 22,773.6, 44,930.8,87,703.1, and 171,246.2 (r2 0.9999). The CVs were 3.5%, 2.8%, 3.1%, and3.4%.Day-to-day reproducibility of the C-value measurements on the BD Accuri C6flow cytometer is excellent. For seven repetitions on separate days, using differentArabidopsis seedlings as the source of nuclei, the mean FL2-A value of the 2Cpeak positions was 21,633.6 1,588.5 (mean SD).ABCR1106FL3-A105104P11.2%Number of Nuclei106103Gated on FL2-AEFR1105FL3-A106104P11.8%103Number of Nuclei106FL3-A0 410FL2-AGated on 6104105FL2-AFigure 2. Flow analysis of homogenates from Arabidopsis leaf (A-C) and root (D-F).(A) Biparametric dot plot of FL2-A versus FL3-A fluorescence emission. (B) Enlargement of thesquare region-of-interest (R1) containing the nuclei. The nuclei are indicated by polygonal regionP1. (C) Uniparametric histogram of FL2-A fluorescence, gated on region P1 of panel B. (D) As forpanel A, except using roots. (E) As for panel B, except using roots. (F) As for panel C, except usingroots.
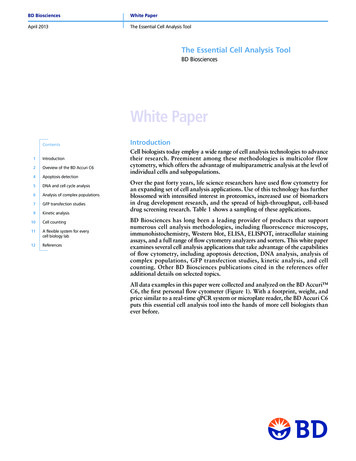
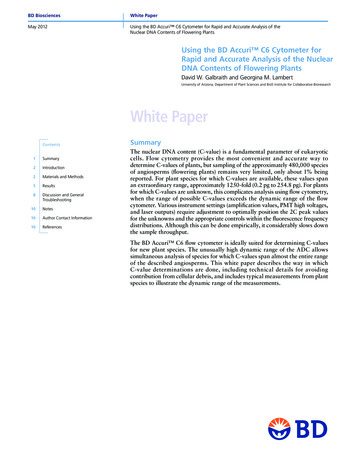
BD BiosciencesWhite PaperMay 2012Using the BD Accuri C6 Cytometer for Rapid and Accurate Analysis of theNuclear DNA Contents of Flowering PlantsPage 7The next experiment extended the observed linearity of PI-based C-valuemeasurements to a dynamic range that spans most of the values reported forflowering plants. Plant tissues were taken from four species (Arabidopsisthaliana, Pisum sativum, Triticum aestivum, and Alstroemeria aurea), chopped,filtered, and stained separately, then mixed. The composite biparametricfrequency distribution contains the diagonal region characteristic of PI-stainednuclei (Figures 3A, 3B). On magnification of the region, it is clear that theAlstroemeria nuclei produce FL3-A signals that are off-scale, but these could becaptured using a suitably placed polygonal window (P2), and the resultant FL2-Auniparametric distributions had well-defined peaks corresponding to the nucleiof the different species (Figure 3C). Assignment of the six peaks to nuclei ofindividual species was done from the results of accumulation of histogramsproduced for analyses of the unmixed homogenates of individual species. ForFigure 3C, the individual peaks and their positions and CVs are: Arabidopsis2C, 20,868.2, 4.2%; Arabidopsis 4C, 40,333.2, 3.5%; Arabidopsis 8C,77,941.5, 2.8%; Pisum 2C, 453,340.4, 2.1%; Triticum 2C, 1,584,795.7, 2.8%;Alstroemeria 2C, 3,486,157.8, 2.4%. The peak position values are stronglycorrelated with the reported nuclear DNA content values (Figures 3D, 3E; r2 106FL2-ADAa (2C)r2 0.9996040200Ta (2C)At(2C-8C)0.0Ps (2C)1.01002C DNA Content (pg)2C DNA Content (pg)80FL2-AEr2 0.999101Number of NucleiP24.3%FL3-AFL3-A106750Gated on P2Ta (2C)At (4C)At (2C)500Ps (2C)At (8C)Aa (2C)2500104105106FL2-A107Aa (2C)Ta (2C)Ps (2C)At (8C)At (4C)At (2C)2.0FL2-A (x 10-6)3.0105106FL2-AFigure 3. Simultaneous analysis of mixtures of plant homogenates.(A) Biparametric dot plot of FL2-A vs FL3-A fluorescence emission. (B) Enlargement of the squareregion-of-interest (R2) containing the nuclei; the nuclei are indicated by polygonal region P2.(C) Uniparametric histogram of FL2-A fluorescence, gated on region P2 of panel B. (D) Plot ofDNA content vs the mean fluorescence values of the 2C peak psitions for the four species. (E)As for panel D except employing a log scale, with identification of the six DNA content peaks.Abbreviations: At, Arabidopsis thaliana; Ps, Pisum sativum; Ta, Triticum aestivum; Aa, Alstromeriaaurea. 2C, 4C, 8C designate the C-values for the individual peaks within these species.
BD BiosciencesWhite PaperMay 2012Using the BD Accuri C6 Cytometer for Rapid and Accurate Analysis of theNuclear DNA Contents of Flowering PlantsDiscussion and General TroubleshootingThe nuclear DNA contents (C-values) of higher plants span a remarkable rangeof values,6,9 from 0.2 pg (Fragaria viridis Duch.) to 254.8 pg (Fritillaria assyriacaBaker10), or about three decades of DNA content. Nevertheless, C-valuemeasurements are available only for about 2% of the species comprising theangiosperms. The BD Accuri C6 flow cytometer is optimally suited for the flowcytometric determination of plant nuclear DNA contents. This is for two mainreasons: first, the BD Accuri C6 employs a 24-bit analog-to-digital converter(ADC) for signal processing, which provides an exceptional seven-decadedynamic range. This dynamic range is larger than that of the described 2C valuesfor the flowering plants.Second, the BD Accuri C6 is equipped with lasers that optimally excite PI foruse as a DNA fluorochrome. This avoids base-pair bias inherent to DAPI, theHoechst dyes, and mithramycin/chromomycin,3 and also provides a convenientway to deal with the large amounts of debris released from plant tissues by thechopping process.1 In comparison to situations typical in flow analysis of animalcell suspensions, in which the object of interest (the cell) represents most of thepopulation, for analysis of C-values using plant homogenates, the objects ofinterest (the nuclei) are a very minor population. Plant debris both scatters lightand can be autofluorescent. Since light scatter signals are generally used fortriggering flow cytometric measurements, careful adjustment of thresholds isrequired to allow visualization of the nuclei. Without appropriate thresholding,auto-rescaling obscures the presence of the nuclei on frequency distributiondisplays, and sample acquisition, based on total counts of scattering particles,stops prior to accumulation of data for adequate numbers of nuclei.Autofluorescence produced by the photosynthetic organelles of aerial tissues canalso overlap the emission of DNA-specific fluorescent signals and, sincechloroplasts greatly outnumber nuclei within the cells of green tissue, this alsocan obscure the nuclei.Using the BD Accuri C6, it is very simple to define the region of interest withinbiparametric distributions of FL2-A vs FL3-A, since these detection channelsroughly split the fluorescence emission of PI-DNA into shorter and longerwavelength spectral components (Figures 1–3). Correlation between thefluorescence emissions within these two spectral bands produces an angled linearregion within the biparametric contour plots containing discrete peaks offluorescence, the lowest representing the 2C nuclei within G0/G1 cells (Figures1–3). Gating around this region provides very clean uniparametric histograms.Debris from different tissue sources, for example shoots (Figures 2A, 2B) androots (Figures 2D, 2E) can be readily excluded for consideration, and mixinghomogenates from different plant species (Figures 3A, 3B) does not impedenuclear analysis.An additional general problem in C-value determinations relates to the choice ofa standard against which to determine the 2C value for the unknown species.This conventionally has been an internal standard, ideally using a plant specieshaving a C-value similar to that of the unknown, but not overlapping. Experiencewith other flow cytometers indicates that data accumulation under conditionsof linear signal amplification is preferred over logarithmic amplification, due tohistorical performance limitations of the latter. Given the extreme ranges of 2Cvalues encountered in the plant kingdom, it can therefore be tricky to establishappropriate conditions and standards for accurate flow analysis of nuclear DNAcontents.
BD BiosciencesWhite PaperMay 2012Using the BD Accuri C6 Cytometer for Rapid and Accurate Analysis of theNuclear DNA Contents of Flowering PlantsPage 9This problem is solved by the BD Accuri C6 flow cytometer in two ways. First,and remarkably, the linearity of measurement of plant genome sizes based on PIfluorescence extends over a dynamic range from 0.32 to 80.9 pg of DNA (Figures3D, 3E). This is the first time this relationship has been demonstrated over sucha large range. The upper limit to C-value measurements using the BD Accuri C6will be about 370 pg of DNA, based on the observed mean position for the 2Cpeak of Alstroemeria (80.9 pg; channel 3,486,157.8) and the highest bin valueavailable on the instrument ( 16 x 106). This exceeds the largest record in theKew C-value database by a factor of 1.5-fold. Extending polygonal gate P2(Figure 3) around the PI-DNA region downward below the Arabidopsis 2C peakrevealed little noise from debris for FL2-A values as low as 2,000. This valuewould correspond to a nuclear 2C DNA content of 0.032 pg, which is about sixfold smaller than the smallest record for the flowering plants.6,11Second, the BD Accuri C6 displays a very high level of reproducibility in day-today measurements of the fluorescence of PI-stained plant nuclei. The variabilityin the position of the Arabidopsis 2C peak had a CV of 7.3%. This essentiallyobviates the need for internal standardization of DNA content values. Cautionshould be observed, nevertheless, since a number of trivial issues can alter thefluorescence emission detected by the BD Accuri C6, including issues relating toexperimental manipulations (the staining time and the presence of secondaryproducts, for example), and those relating to the cytometer itself (deposition ofmurky substances on the flow cell walls). Appropriate controls can readily handlethese issues.Overall, this white paper indicates the BD Accuri C6 should be able to measureany plant 2C value without modification to the instrument, and without therequirement for even simple adjustments such as insertion of neutral densityfilters. The accuracy of measurement of the nuclear DNA contents, reflected bythe low CVs, was consistently high across the entire range of measurements. Weconclude that, for routine analysis of plant nuclear DNA contents, ploidy, orinvestigations of other issues requiring C-value determinations, the BD AccuriC6 provides an excellent measurement platform.
BD BiosciencesWhite PaperMay 2012Using the BD Accuri C6 Cytometer for Rapid and Accurate Analysis of theNuclear DNA Contents of Flowering PlantsNotesThis white paper is abstracted in part from Galbraith,4 with the permission ofthe author.Author Contact InformationUniversity of ArizonaDepartment of Plant Sciences and Bio5 Institute for Collaborative Bioresearch341 Keating Building1657 E. Helen St.Tucson, AZ 85721-0240 USATel: 1 (520) 621-9153Fax: 1 (520) 626-4824Email: galbraith@arizona.eduReferences1. Galbraith DW, Harkins KR, Maddox JR, Ayres NM, Sharma DP, Firoozabady E. Rapid flowcytometric analysis of the cell cycle in intact plant tissues. Science. 1983;220:1049-1051.2. J ohnston JS, Bennett MD, Rayburn AL, Galbraith DW, Price HJ. Reference standards fordetermination of DNA content of plant nuclei. Am J Bot. 1999;86:609-613.3. Dolezel J, Greilhuber J, Suda J. Estimation of nuclear DNA content in plants using flowcytometry. Nature Protocols. 2007;2:2233-2244.4. Galbraith DW. Simultaneous flow cytometric quantification of plant nuclear DNA contentsover the full range of described angiosperm 2C values. Cytometry. 2009;75A:692-698.5. Zhang CQ, Barthelson RA, Lambert GM, Galbraith DW. Characterization of cell-specific geneexpression through fluorescence-activated sorting of nuclei. Plant Physiol. 2008;147:30-40.6. Bennett MD, Leitch IJ. Plant DNA C-values database (release 3.0, Dec. 2004) http://www.kew.org/cvalues/homepage.html.7. Galbraith DW, Harkins KR, Knapp S. Systemic endopolyploidy in Arabidopsis thaliana. PlantPhysiol. 1991;96:985-989.8. Bennett MD, Leitch IJ, Price HJ, Johnston JS. Comparisons with Caenorhabditis ( 100 Mb)and Drosophila ( 175 Mb) using flow cytometry show genome size in Arabidopsis to be 157Mb and thus 25% larger than the Arabidopsis Genome Initiative estimate of 125 Mb. AnnBotany. 2003;91:547-557.9. Bennett MD, Smith JB. Nuclear DNA amounts in angiosperms. Phil Trans Roy Soc London.1976;B 274B:227-274.10. Buitendijk JH, Peters A, Quené RJ, Ramanna MS. Genome size variation and C-bandpolymorphism in Alstroemeria aurea, A. ligtu, and A. magnifica (Alstroemeriaceae). Plant SystEvol. 1998;212:87-106.11. Zonneveld BJM, Leitch IJ, Bennett MD. First nuclear DNA amounts in more than 300angiosperms. Ann Botany. 2005;96:229-244.
BD BiosciencesWhite PaperMay 2012Using the BD Accuri C6 Cytometer for Rapid and Accurate Analysis of theNuclear DNA Contents of Flowering PlantsFor Research Use Only. Not for use in diagnostic or therapeutic procedures.BD flow cytometers are Class 1 Laser Products.SigmaPlot is a registered trademark of Systat Software.Triton is a registered trademark of Sigma-Aldrich.BD, BD Logo and all other trademarks are property of Becton, Dickinson and Company. 2012 BD23-13597-01BD Biosciencesbdbiosciences.com
BD Accuri C6 flow cytometer for the analysis of plant genome sizes. The DNA histograms produced by the BD Accuri C6 display excellent peak CVs, and this instrument, uniquely, can provide simultaneous linear estimates of nuclear DNA content spanning at least two orders of magnitude (a range of 0.34 to 80.9 pg).