Transcription
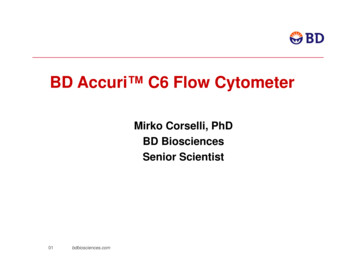
BD BiosciencesWhite PaperApril 2013The Essential Cell Analysis ToolThe Essential Cell Analysis ToolBD BiosciencesWhite PaperContents1Introduction2Oveview of the BD Accuri C64Apoptosis detection5DNA and cell cycle analysis6Analysis of complex populations7GFP transfection studies9Kinetic analysis10Cell counting11A flexible system for everycell biology lab12ReferencesIntroductionCell biologists today employ a wide range of cell analysis technologies to advancetheir research. Preeminent among these methodologies is multicolor flowcytometry, which offers the advantage of multiparametric analysis at the level ofindividual cells and subpopulations.Over the past forty years, life science researchers have used flow cytometry foran expanding set of cell analysis applications. Use of this technology has furtherblossomed with intensified interest in proteomics, increased use of biomarkersin drug development research, and the spread of high-throughput, cell-baseddrug screening research. Table 1 shows a sampling of these applications.BD Biosciences has long been a leading provider of products that supportnumerous cell analysis methodologies, including fluorescence microscopy,immunohistochemistry, Western blot, ELISA, ELISPOT, intracellular stainingassays, and a full range of flow cytometry analyzers and sorters. This white paperexamines several cell analysis applications that take advantage of the capabilitiesof flow cytometry, including apoptosis detection, DNA analysis, analysis ofcomplex populations, GFP transfection studies, kinetic analysis, and cellcounting. Other BD Biosciences publications cited in the references offeradditional details on selected topics.All data examples in this paper were collected and analyzed on the BD Accuri C6, the first personal flow cytometer (Figure 1). With a footprint, weight, andprice similar to a real-time qPCR system or microplate reader, the BD Accuri C6puts this essential cell analysis tool into the hands of more cell biologists thanever before.
BD BiosciencesWhite PaperApril 2013The Essential Cell Analysis ToolTable 1. Selected cell analysis applications for flow cytometry.ApplicationSample Research QuestionsSample ReagentsT-cell immunology Cellular and molecular mechanisms of T-cell development Cell plasticity between Tregs and Th17sAnti-CD3, CD4, CD8, CD45, CD127,FoxP3, IL-17ApoptosisTreatment effects on apoptosisAnnexin V, JC-1DNA/cell cycle Treatment effects on cell cycle DNA content of plant tissuesPropidium iodide (PI), 7-AADAnalysis ofcomplex populations Characterization of heterogeneous stem cell cultures RNA knockdown Rare eventsAnti-Sox2, Nanog, Oct3/4GFP transfection Gene or protein expression Transfection efficiencyGFP, YFP, mCherryKinetic analysis Effects of test compounds on intracellular calcium Nanoparticle uptakeFluo-4Cell counting Viable cell concentrations in cultured cell lines Platelet concentrations in whole, unlysed blood7-AAD, Anti-CD41, CD61Intracellularflow cytometry Cytokines and transcription factors Cell signalingAnti–IL-4, IL-17, IFNγ, Anti-Stat1, Stat5,BD Phosflow Perm Buffer IIIFigure 1. The BD Accuri C6 flow cytometer system.The instrument weighs just 13.6 kg (30 lb). Exterior dimensions (H x W x D) are 27.9 x 54.6 x 41.9cm (11 x 21.5 x 16.5 in.) with fluid tanks in place.Overview of the BD Accuri C6Operation and maintenanceThe BD Accuri C6 offers performance, simplicity, and affordability. Light,rugged, and small enough to fit on a benchtop, it connects to standard electricalcircuitry and can easily be transported into the field without the need forre-alignment. With the optional BD CSampler accessory (see Figure 14, page11), it can process multiwell plates and racks with unattended operation.BD Accuri C6 software makes operation intuitive for novice and proficientusers alike. Most new users become fluent with the software in less than 30minutes, assisted only by a 3-page pictorial Quick Start Guide. Data files can beanalyzed within the program, aided by special tools such as Zoom andVirtualGain , or exported in FCS 3.0 format into FCS Express , FlowJo , orother flow cytometry analysis programs.
BD BiosciencesWhite PaperApril 2013The Essential Cell Analysis ToolPage 3Routine instrument cleaning and priming are automated. Maintenance is easy,even for novice users, and requires no tools. The recommended sheath fluid is0.22-μm filtered, deionized (DI) water. These attributes effectively expand flowcytometry beyond the core facility and onto the laboratory bench or into thefield.Optical and analytical modalities resolve bright and dim signalsThe fully digital BD Accuri C6 features two lasers, two light scatter detectors,and four fluorescence detectors. A state-of-the-art digital signal processing (DSP)system gives the BD Accuri C6 a dynamic range greater than six full decades.This means that it can finely resolve both faint and bright signals at once andanalyze a wide span of biological variation in a single run—from dim, micronsized platelets through large, 30 micron highly fluorescent cell lines.Figure 2. The BD Accuri C6 peristaltic pumpsystem.The unique laminar-flow fluidics system, drivenby peristaltic pumps, combines the advantagesof hydrodynamically focused cell sampling withthe ability to report absolute cell counts for anyidentified population in a sample.The instrument detects this broad dynamic range using standardized factorydetector settings without the need for optimization or tuning. In rare cases wherethe fluorescence is off scale, such as some cell lines transfected with greenfluorescent protein (GFP), attenuation filters can easily be inserted to bring thesignals back on scale while maintaining operation of the detectors within theiroptimal linear range.If additional flexibility is needed, the optical configuration can easily be modified.The Selectable Lasers Module (Cat. No. 653126) allows reassignment of thestandard laser/detector associations, and optional filters can modify the effectivedetector characteristics.High-performance fluidics offer cell counting capabilitiesThe BD Accuri C6 flow cytometer has a unique laminar-flow fluidics systemdriven by push-pull peristaltic pumps (Figure 2). By monitoring the pressure inthe sample introduction probe (SIP), a microprocessor can determine the sampleflow rate. This arrangement combines the advantages of hydrodynamicallyfocused cell sampling (high data acquisition rates, good light-scatter andfluorescence resolution) with the ability to accurately determine sample volumeand automatically report concentrations for any identified population in a sample.This ability to measure absolute counts and concentrations of cells or particlesin samples is crucial for many cell analysis applications. Concentrationmeasurements from the direct volume method are highly correlated with thosefrom counting beads (see Figure 12, page 11), and are more precise thanhemocytometer counts, as described under Cell counting later in this paper.The non-pressurized pumps and open fluidics system allow the use of opensample containers, such as microcentrifuge tubes. This allows the convenientaddition of test compounds to the cell suspension without interruption duringsampling (see Figure 10, page 9), as described under Kinetic analysis later in thispaper.Finally, the peristaltic pumps enable independent regulation of both the sheathand sample flow rates. Users can quickly optimize the sample core diameter(adjustable from 5 to 40 μm) based on the anticipated size range of cells orparticles within the sample.
BD BiosciencesWhite PaperApril 2013The Essential Cell Analysis ToolApoptosis detectionSeveral methodologies can detect apoptosis and cell proliferation. BD Biosciencescarries a broad portfolio of reagents for determination and detection of theseevents by ELISA, immunohistochemistry, cell imaging, Western blot, and flowcytometry.Over the years, multicolor flow cytometry has become essential in the study ofapoptosis, cell cycle, and cell proliferation. Different flow cytometric methodscan detect different indicators of apoptosis, including Annexin V, caspaseactivation, PARP cleavage, changes in mitochondrial membrane potential, andDNA fragmentation (see Table 2). The success of these methods results from thecapability of flow cytometry to monitor these processes along with other cellularevents, such as protein phosphorylation or cytokine secretion, withinheterogeneous cell populations.Table 2. Selected methods for detecting apoptosis using flow cytometry.Apoptosis IndicatorAssayExamplesCat. No.Plasma membrane alterations(Phosphatidylserine exposure)Annexin V binding assays: Single conjugates Annexin V kitsAnnexin V FITC Apoptosis Detection Kit556570Annexin V PE Apoptosis Detection Kit559763Mitochondrial changesJC-1 assaysBD MitoScreen (JC-1) Kit551302Caspase activationCaspase activity assay kitsand reagentsCaspase-3 Active Form PE Apoptosis Kit550914APO-BrdU Apoptosis Detection Kit556405DNA fragmentationTUNEL assaysAPO-Direct Apoptosis Detection Kit556381Changes in the plasma membrane are one of the first detectable characteristicsof the apoptotic process. In normal cells, phosphatidylserine (PS) molecules areconfined to the inner leaflet of the plasma membrane (Figure 3). Duringapoptosis, these molecules externalize and can be bound to FITC- or PE-labeledAnnexin V in the presence of calcium. Dead cells can be excluded with membraneimpermeant dyes such as propidium iodide (PI) or 7-aminoactinomycin D(7-AAD).Annexin V-PE ConjugateCa Plasma MembranePhospholipid FlippingCa Ca ApoptosisNormal CellCytoplasmExternalization ofPhosphatidylserineApoptotic CellCytoplasmFigure 3. Changes in the plasma membrane are an early sign of apoptosis.With the ability to detect four fluorochromes in addition to forward and sidescatter, the BD Accuri C6 can perform most flow cytometric apoptosis assays.1Figure 4 shows sample Annexin V data.
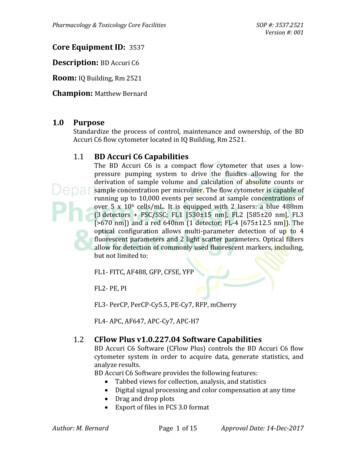
White PaperApril 2013The Essential Cell Analysis 0310410510610710FL1 Annexin V FITC-ADNA and cell cycle analysisS20.1%500,000310Figure 4. Flow cytometric analysis of FITC Annexin V staining.Jurkat cells (human T-cell leukemia; ATCC TIB-152) were treated with 6 µM of camptothecin or0.1% DMSO (negative control) for four hours to induce apoptosis. Cells were stained with FITCAnnexin V and PI according to the BD Pharmingen Annexin V FITC Apoptosis Detection Kitstaining protocol (Cat. No. 556570). Data was acquired on a BD Accuri C6 flow cytometer usingBD Accuri C6 software. Results: Camptothecin treatment (lower plots) resulted in an increase inearly apoptotic cells (PI –Annexin V , shown in green) compared to the DMSO control (upper plots).Dead cell (PI , red) and live cell (PI –Annexin V– , black) populations were easily distinguished.G0/G138.7%155,157Q2-LR2.8%Campto FITC PIFSC-AA04 Jurk aph 3.0Gate: (Singlets in all)Q2-LL86.0%FL1 Annexin V FITC-A0S21.8%Q2-UR11.1%FL3 Propidium Iodide-A345610101010G2/M46.6%Q2-UL0.1%FL3 Propidium 00800FL2-A4006001,015,582A02 Jurk DMSOGate: (Singlets in all)200Count500,000400600P287.4%Campto FITC PI200CountDMSO FITC PIFSC-A155,157CDMSO FITC PI199,729202,651BPage 50Singlets78.8%178,527FL2-HA04 Jurk aph 3.0Gate: (P3 in all)400,000600,000A917,7071,704,234BD Biosciences1,086,036Figure 5. Cell cycle disruption after treatmentwith aphidocolin.Jurkat cells were treated with DMSO or 3 µg/mL of aphidocolin, stained with PI, acquired,and analyzed on the BD Accuri C6. A. Cellstreated with DMSO were gated to excludeaggregates on a PI FL2-A vs PI FL2-H plot. B, C.PI histograms of Jurkat cells (gated on singlets,Panel A) show distinct peaks for cells at theG0/G1 and G2 M cycle phases, with cells in theS phase falling in between. Treatment withaphidocolin (C), which blocks cells in the earlyS phase, resulted in more G0/G1 cells and fewerG2 M cells.Fluorescence intensities of DNA-intercalating dyes such as PI and 7-AADcorrelate directly with DNA content and can be easily measured using flowcytometry. Because different phases of the cell cycle have their own characteristicchromosome content (2N to 4N), PI staining can differentiate cycling andaneuploid cells.Figure 5 shows flow cytometric PI data evaluating how aphidocolin, a DNApolymerase inhibitor that disrupts the cell cycle by blocking cells in the early Sphase, alters the proportion of cells in specific phases.DNA analysis by flow cytometry can identify apoptotic cells (which contain lessthan 2N DNA), proliferating cells, and other subpopulations of interest. Table3 profiles a convenient kit for performing multiparametric analysis of cell status,including proliferation, DNA damage, and apoptosis. (Sample data from aninduced stem cell culture is shown in Figure 6, page 6.)
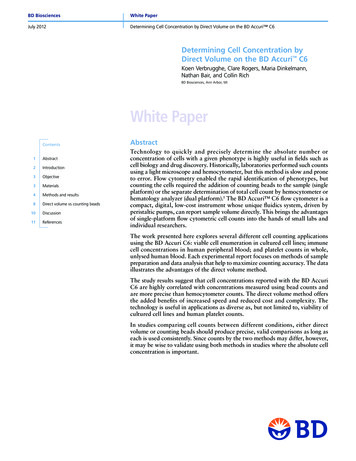
BD BiosciencesWhite PaperApril 2013The Essential Cell Analysis ToolTable 3. Contents of the BD Pharmingen Apoptosis, DNA Damage, and Cell Proliferation Kit(Cat. No. 562253).*10 6B04Gate: P1ComponentR210.8%10 4Bromodeoxyuridine (BrdU)10 210 310 410 510 6Alexa Fluor 488 Sox2-A10 510 6B04Gate: P1Purpose—Incorporated into newly synthesized DNA duringincubationAnti-BrdUPerCP-Cy 5.5BlueDetects cell proliferationAnti-H2AX (pS139)Alexa Fluor 647RedDetects DNA damageAnti-Cleaved PARP (Asp214)PEBlueDetects apoptosisR4R420.8%20.8%R31.9%One application that demonstrates the power of flow cytometry in DNA researchis determining the haploid nuclear DNA content (C-value) for higher plants. PlantC-values, which vary over an extensive range, can be difficult to determine dueto autofluorescence, endoreduplication, mitotic activity, and cellular andsubcellular debris. Galbraith and colleagues at the University of Arizona haveexploited the broad dynamic range, sensitivity to PI, and transportability of theBD Accuri C6 to determine plant C-values quickly and accurately, both in thelab and in the field.210 310 4Analysis of complex populations10 2AlexaFluor 647 H2AX (pS139)-A—Laser*Kit also contains DAPI, DNase, buffers, and a detailed protocol.10 310 2PerCP-Cy5.5 BrdU-A10 5R10.0%Format10 210 310 410 510 6Alexa Fluor 488 Sox2-A10 6B04Gate: P1Stem cell differentiationOne example of a complex population is a stem cell culture, which often containspluripotent or multipotent stem cells along with adult cells in various stages ofdifferentiation. Each type of cell has its own distinct intracellular and/or surfacemarkers, which are enumerated in the interactive Stem Cell Explorer atbdbiosciences.com.3 BD Biosciences offers an expansive portfolio of individualantibodies and convenient kits for the detection of markers of embryonic, adult,and induced pluripotent stem cells and their derivatives.R60.8%10 410 5R52.5%10 3Cleaved PARP PE-A10 2A major strength of flow cytometry is its ability to study complex populations.Western blot, immunoprecipitation, and PCR-based techniques rely on lysing theentire sample, and their results apply to the population as a whole. This makesit difficult to compare specific subsets of cells within the population that mightbehave differently. Other techniques that examine individual cells, such asmicroscopy, are hard to scale up for quantitative analysis. Flow cytometry cancharacterize large numbers of individual cells, allowing for the identification andquantification of different subsets of cells in a heterogeneous population.10 210 310 410 510 6Alexa Fluor 488 Sox2-AFigure 6. Cell status in a heterogeneouspopulation of neural stem cells.H9 hESCs were differentiated to neuralectoderm for six weeks as described in Yuan,et al.4 Cells were dissociated and analyzed forexpression of the hESC and NSC marker Sox2,as well as the cell function markers in the BDPharmingen Apoptosis, DNA Damage, andCell Proliferation Kit (Cat. No. 562253). Datawas collected and analyzed on a BD AccuriC6, gating on the light scatter propertiesof H9 hESC derivatives. Results: Sox2– cells(differentiated neurons and glia) showed(A) reduced proliferation (BrdU , R1), (B)reduced DNA damage (pH2AX, R3), and (C)slightly increased apoptosis (cleaved PARP, R5)compared to other cells in the population.For example, induction of human embryonic stem cells (hESCs) using the serumfree embryoid body (SFEB) method produces “variable and heterogeneous”mixtures of uninduced hESCs, neural stem cells (NSCs), differentiated cells suchas neurons and glia, and cells from other germ cell lineages.4 Flow cytometricanalysis using a fluorescent antibody to the transcription factor Sox2 allows therapid identification of large numbers of both Sox2 (hESC and NSC) and Sox–(differentiated) cells in this mixed population, and greatly simplifies furtheranalysis.Figure 6 compares the proliferation status (BrdU staining), DNA damage(phorphorylated H2AX staining), and apoptotic status (cleaved PARP staining)of induced stem cells in a differentiated culture. Results indicate that Sox2 –(differentiated) cells have stopped proliferating and show reduced DNA damagecompared to other cells in the population.
BD BiosciencesWhite PaperApril 2013The Essential Cell Analysis ToolPage 7RNAi and protein expressionThe analysis of multiple parameters in individual cells or subsets of cells incomplex populations is also important in protein expression experiments suchas RNA interference (RNAi). Variables such as transfection and knockdownefficiency can create complexity that can be missed when looking at RNA orprotein levels at the population level using qPCR or Western blot. A populationin which 80% of the cells are transfected with a short interfering RNA (siRNA)that results in 50% protein reduction would show the same 40% overall proteinreduction as one with 50% transfection efficiency and 80% protein reduction.Chan, et al (2005)5 provided an elegant example of the use of flow cytometry forRNAi analysis. They knocked down Lck, a Src-family kinase that plays an earlyrole in the T-cell receptor signaling pathway in Jurkat T cells. This resulted intwo distinct subpopulations—Lcklo, in which transfection was successful (Lckexpression was reduced), and Lck hi , in which it was not. Using additionalmarkers, they were able to analyze these different populations and found that,when stimulated with phytohemagglutinin (PHA), Lcklo and Lckhi cells differedin expressing CD69, an early T-cell activation marker.Rare events and cell subpopulationsThe advantages of flow cytometry over Western blot are multiplied whenconducting research on rare events or on cells that make up a small minority ofa population. For example, in research on acute myeloid leukemia (AML), onehypothesis suggests that minimal residual disease (MRD) cells persist becausethey resist apoptosis. Using Western blot to study apoptosis-related proteins inMRD cells is difficult, however, due to their rarity in the population. Flowcytometry offers a rapid, highly sensitive method for investigating apoptosis inthese samples because the MRD cells can be identified by phenotype and selectedfor detailed analysis.6GFP transfection studiesTransfection, or introduction of foreign DNA, RNA, or proteins into cells, hasbecome an important tool in studying gene and protein expression and function.Because of variability in transfection efficiency, a reporter gene is oftenco-transfected into the cells. Green fluorescent protein (GFP, cloned from thejellyfish A. victoria) and other derivatives are commonly used as reportermolecules.Many researchers use microscopy to measure GFP transfection efficiency,although the process is time-consuming and expression levels cannot be readilyquantified. Alternatively, Western blot can rapidly quantify protein levels acrossan entire population, but cannot query individual cells or determine theproportion of cells that express the protein. A flow cytometer can bridge thesetechniques to determine GFP fluorescence levels for individual cells whilecollecting data on up to 10,000 cells/second, and can screen for stabletransfectants quickly and easily. In addition, the BD Accuri C6 can measurechanges in gene expression over time without data loss, even in subpopulations,as described under Kinetic Analysis later in this paper.Figure 7, page 8, shows sample microbiology data acquired and analyzed on theBD Accuri C6. Flow cytometry was readily able to distinguish GFP-infected vswild-type E. coli in a mixed sample.
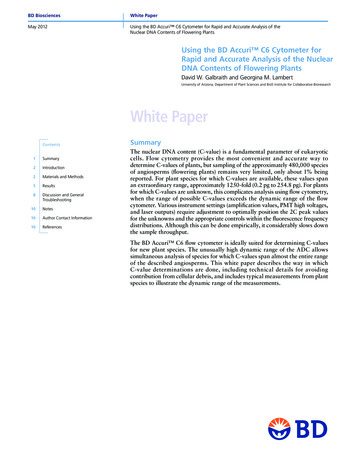
White PaperApril 2013The Essential Cell Analysis ToolE. coli GFP plasmid103 103.4103 103.4102103102SSC-H41955 / 209780 (20%)events displayedSSC-H101104.1FSC-HP254.9%100.310310220000 / 100000 (20%)events displayed102SSC-H101100.3P253.0%100.3103 SC-H0100101102103104FL1: 533 BP105106Partial data displayed1,000Count- GFPM150.5%0M193.6%5001,000Count2,000Partial data displayed200Count0100M10.1%Partial data displayed GFP300BE. coli mixture101E. coli wild typeA39200 / 195997 (20%)events displayedBD Biosciences100101102103104105106FL1: 533 BP100101102103104105FL1: 533 BP106Figure 7. Detection of GFP expression in bacteria.Samples containing wild-type (left column) or GFP-transfected (middle column) Escheria coli B, ora mixture of the two (right column), were acquired on a BD Accuri C6. A. FSC vs SSC scatter plotswere used to gate cells and exclude debris. B. FL1 histograms were used to identify transfected(peak around 103.5) and non-transfected (peak around 101) populations. Both subpopulations wereresolved clearly in the mixed population. Data courtesy of Tim F. Cooper, Dept. of Biology andBiological Chemistry, University of Houston, Houston, TX, USA.Table 4. Fluorescent protein detection withstandard BD Accuri C6 optical filters.DetectorFilterFPs DetectedFL1533/30GFP*, YFP*, mCitrine, YPetFL2585/40mOrange, dTomato, DsRedFL3670 LPRFP, mCherryWith more than six decades of dynamic range, the BD Accuri C6 can detect bothbright and dim signals from GFP and other fluorescent proteins using thestandard filter configuration as shown in Table 4. Optional filters can increasesignal resolution and allow separation of signals that might overlap using thestandard configuration, as shown in Figure 8.7B10 6A10 6*Includes enhanced versions10 5540 BP FL2GFP10 310 410 510 610 210 210 210 710 210 310 510 610 7510 BP FL110 5Q3YFPGFP10 210 310 410 5533 BP FL110 610 710 210 310 410 3YFP10 4540 BP FL210 510 6DQ310 2585 BP FL2Compensated10 410 6533 BP FL1CGFPQ310 310 4Q310 410 5YFP10 3585 BP FL2UncompensatedYFPGFP10 210 310 410 5510 BP FL110 610 7Figure 8. Detection of greenand yellow fluorescent proteinsusing standard and optionalfilters.A, C. Either GFP or YFP signalscan be detected in FL1 andFL2 with the standard BDAccuri C6 filter configuration(533/30 in FL1, 585/40 in FL2).B, D. To detect both GFPand YFP at once, researcherscan separate the signals byusing the 510/15 filter (Cat.No. 653184) in FL1 and the540/20 filter (Cat. No. 653528)in FL2. The top and bottomgraphs show uncompensatedand compensated data,respectively.
BD BiosciencesWhite PaperApril 2013The Essential Cell Analysis ToolKinetic analysis104Small-molecule agonists and other test compounds can elicit powerful and rapidcellular responses—some within seconds or faster. Such dynamic responses canbe difficult to quantify with microscopy and difficult to even detect with othertechniques.FITC Log103Many flow cytometers use a pressurized fluidics system in which the tubes mustbe sealed. To add test compounds to the cell suspension, a stop-flow method isused in which sampling is paused, the sample tube opened, the agonist added,and the tube resealed. This technique leaves a gap or blind spot in data collection(Figure 9) that may fail to capture essential cellular responses.Calcium flux, for example, mediates many important cellular functions. Changesto intracellular calcium (Ca2 ) levels occur rapidly—in some cases withinnanoseconds of stimulation—and obtaining accurate data on these changes is asignificant research challenge. Figure 11 illustrates gap-free measurement of Ca2 levels using the continuous-flow method.7.210Gate: [No Gating]2m 30.0sTime5m 0.0s10510410310210488: 530/40: Fluo-450.0s11067.21020m 0.0s10488: 530/40: Fluo-410m 0.0sTimeCalcium FreeCGate: [No Gating]67.210610510410310210488: 530/40: Fluo-41100.0sFigure 10. Continuous-flow addition of testcompounds with the BD Accuri C6.Cells or compounds can easily be added toopen tubes on the BD Accuri C6 withoutinterrupting sample analysis.BAPTA-AMBGate: [No Gating]10Calcium PresentA4Figure 9. The stop-flow kinetic analysismethod leaves data gaps that may miss cellularresponses.Cytogram obtained on a Beckman CoulterCyAn ADP analyzer using the stop-flowmethod, showing a time gap when compoundswere added.1010 min37 min 30 sec105 minTime22 min 30 sec100 secThe BD Accuri C6, in contrast, employs peristaltic pumps (Figure 2, page 3) inan open fluidics system. The use of open sample containers, such asmicrocentrifuge tubes, allows convenient addition of test compounds to the cellsuspension without interrupting sampling (Figure 10). This “continuous-flow”method enables nonstop monitoring of thousands of cells and accurate dynamicmeasurement of the entire population.110110102100Page 90.0s2m 30.0sTime5m 0.0sFigure 11. Continuous, gap-free recording of intracellular calcium levels on the BD Accuri C6.An unspecified drug compound, the calcium ionophore A23187, and the extracellular calciumchelator EGTA were sequentially added to cultured SH-SY5Y neuronal cells using the continuousflow method on the BD Accuri C6 under three experimental conditions. Cytograms show Fluo-4fluorescence indicating Ca2 levels over time, with arrows indicating addition of test compounds.A. Test compounds were added in the presence of calcium, mediated by thapsigargin. B. Testcompounds were added in the presence of BAPTA-AM, the intracellular calcium chelator. C. Testcompounds were added in the absence of calcium (EGTA). Results: In the presence of calcium,the drug compound provoked a momentary spike in intracellular calcium, which might havebeen missed using the stop-flow method. As expected, A23187 caused a lasting increase inCa2 concentration, and EGTA reduced it. The presence of BAPTA-AM or the absence of calciumnegated the effects of the drug and moderated the effects of A23187 and EGTA. Data courtesyof Alfonso Blanco Fernández, UCD-Conway Institute of Biomolecular and Biomedical Research,University College Dublin, Dublin, Ireland.The continuous-flow method on the BD Accuri C6 can quantify dynamic changesin Ca 2 levels while simultaneously identifying and analyzing differentsubpopulations within a sample, using cell-permeable, calcium-sensitivefluorescent dyes and antibodies to cell marker proteins.8 This method can alsobe applied to other research areas that measure dynamic live cell response, suchas pH, reactive oxygen and nitrogen species, mitochondrial membrane potential,and nanoparticle uptake.
BD BiosciencesWhite PaperApril 2013The Essential Cell Analysis ToolCell countingCount by Beads (Cells/mL)10,000,0001,000,000100,000y 1.0932r2 0.9989N 48Quick and precise cell concentrations for a given phenotype are highly useful indrug discovery and cell biology. Historically, laboratories performed such countsby combining a light microscope and hemocytometer, using a dye such as Trypanblue to distinguish viable and dead cells. However, this method is slow and proneto error, and cannot easily identify specific subsets of 10,000,000Count by Volume (Cells/mL)Figure 12. Comparison of cell concentrationmeasurements based on direct volume vscounting beads.Serial dilutions of Jurkat, 3T3, and U937cells, and T cells, B cells, and platelet samplesfrom four human peripheral blood donorswere counted on the BD Accuri C6 by twomethods. X-axis values represent direct-volumemeasurements, while y-axis values werecalculated based on counting beads. Results:The direct counts (x-axis values) correlatedhighly (r2 0.9989) with counting bead counts(y-axis values).Volume on BD Accuri C6900800y 0.9704x 3.3644R2 0.9715700A recent study explored three cell-counting applications: viable cell concentrationsin cultured cell lines; immune cell concentrations in human peripheral blood;and platelet counts in whole, unlysed human blood. Direct volume measurementon the BD Accuri C6 was compared with counting beads and hemocytometercounts.9The cell concentrations determined by direct volume on the BD Accuri C6correlated highly with concentrations calculated by counting beads (Figure 12).Both methods were consistent over a broad range of concentrations and weremore precise than hemocytometer counts. In experiments where cell counts arecompared across different conditions, either technique is appropriate when usedconsistently. The direct volume method offers the added advantages of increasedspeed and reduced cost and complexity.One application of direct volume cell counting is the determination of plateletconcentrations, which is crucial in both basic science and clinical researchlaboratories. An International Reference Method (IRM), introduced in 2001,provides fast, accurate platelet counts, but requires both a flow cytometer and ahematology analyzer. A recent study validated platelet concentrations measuredby direct volume on the BD Accuri C6 without using a hematology analyzer.10When applied to platelet concentrations spanning the normal range, the directvolume method was found to be interchangeable with the IRM (Figure 13).6005004003002001000Flow cytometers can quickly and accurately identify phenotypes and count cells,but their fluidics systems often cannot measure sample volume, so determiningcell concentrations may require the addition of counting beads to the sample.The BD Accuri C6 peristaltic pump system (Figure
All data examples in this paper were collected and analyzed on the BD Accuri C6, the first personal flow cytometer (Figure 1). With a footprint, weight, and price similar to a real-time qPCR system or microplate reader, the BD Accuri C6 puts this essential cell analysis tool into the hands of more cell biologists than ever before.