Transcription
BD BiosciencesWhite PaperJuly 2012Determining Cell Concentration by Direct Volume on the BD Accuri C6Determining Cell Concentration byDirect Volume on the BD Accuri C6Koen Verbrugghe, Clare Rogers, Maria Dinkelmann,Nathan Bair, and Collin RichBD Biosciences, Ann Arbor, MIWhite rials4Methods and results8Direct volume vs counting beads10Discussion11ReferencesAbstractTechnology to quickly and precisely determine the absolute number orconcentration of cells with a given phenotype is highly useful in fields such ascell biology and drug discovery. Historically, laboratories performed such countsusing a light microscope and hemocytometer, but this method is slow and proneto error. Flow cytometry enabled the rapid identification of phenotypes, butcounting the cells required the addition of counting beads to the sample (singleplatform) or the separate determination of total cell count by hemocytometer orhematology analyzer (dual platform).1 The BD Accuri C6 flow cytometer is acompact, digital, low-cost instrument whose unique fluidics system, driven byperistaltic pumps, can report sample volume directly. This brings the advantagesof single-platform flow cytometric cell counts into the hands of small labs andindividual researchers.The work presented here explores several different cell counting applicationsusing the BD Accuri C6: viable cell enumeration in cultured cell lines; immunecell concentrations in human peripheral blood; and platelet counts in whole,unlysed human blood. Each experimental report focuses on methods of samplepreparation and data analysis that help to maximize counting accuracy. The dataillustrates the advantages of the direct volume method.The study results suggest that cell concentrations reported with the BD AccuriC6 are highly correlated with concentrations measured using bead counts andare more precise than hemocytometer counts. The direct volume method offersthe added benefits of increased speed and reduced cost and complexity. Thetechnology is useful in applications as diverse as, but not limited to, viability ofcultured cell lines and human platelet counts.In studies comparing cell counts between different conditions, either directvolume or counting beads should produce precise, valid comparisons as long aseach is used consistently. Since counts by the two methods may differ, however,it may be wise to validate using both methods in studies where the absolute cellconcentration is important.
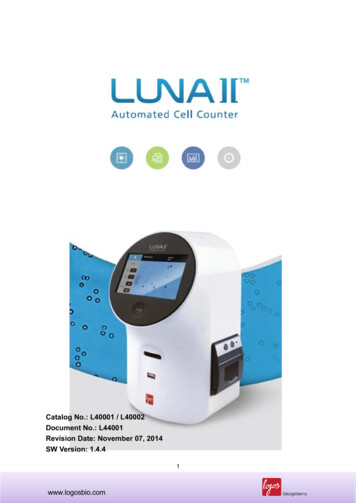
BD BiosciencesWhite PaperJuly 2012Determining Cell Concentration by Direct Volume on the BD Accuri C6IntroductionThe ability to accurately and precisely report concentrations of cell subpopulationsis essential in many areas of biological research. For example, changes in viablecell concentrations are important in assessing cell culture integrity, cell-mediatedcytotoxicity, and drug toxicity. 2,3,4 In typical experiments, researchers want tocompare changes to cell concentrations across a variety of conditions, so resultsmust be determined reliably across a broad range of concentrations. When a largenumber of samples are compared, the cost and time required for each samplebecome crucial.Historically, life science research laboratories performed cell counts using a lightmicroscope and a hemocytometer. A viability dye such as trypan blue allows theviable cells to be identified and counted. However, this method is slow and proneto error. If the target cell subpopulations must be identified phenotypically, aflow cytometer is usually added. However, this only results in multiplication oferrors. A better solution would eliminate the hemocytometer and use the flowcytometer to report cell concentration as well.Digital flow cytometers with laminar-flow fluidics allow fast, phenotypic datacollection (up to 10,000 events per second) on a wide range of cell types (submicron sized bacteria through large mammalian cell lines). However, becausethey cannot directly report sample volume, counting beads must be added toeach sample to calculate cell concentrations. Since the bead concentration isknown, the cell concentration can be calculated based on the ratio of beads tocells.On the other hand, flow cytometers with syringe-driven fluidics can determinecell concentrations directly, without counting beads. However, they are oftenlimited by lower data acquisition rates ( 1,000 events per second), diminishedfluorescence and light-scatter resolution, and a propensity for clogs in the flowcell.The BD Accuri C6 (Figure 1) is a digital flow cytometer with unique laminarflow fluidics driven by a peristaltic pump system (Figure 2). By monitoring thepressure in the Sample Introduction Probe (SIP), a microprocessor can determinethe sample flow rate. This arrangement combines the advantages ofhydrodynamically focused cell sampling (high data acquisition rates, good lightscatter and fluorescence resolution) with the ability to accurately report samplevolume and automatically report concentrations for any identified population ina sample.Figure 1. The BD Accuri C6 flow cytometer system.
BD BiosciencesWhite PaperJuly 2012Determining Cell Concentration by Direct Volume on the BD Accuri C6Page 3ObjectivesThis paper explores methods of preparing and analyzing samples fordetermination of cell concentration across several applications: viable cell countsin cultured cell lines, T- and B-cell counts in human peripheral blood, and plateletcounts in whole human peripheral blood. The three experiments highlightimportant factors for accurately determining cell concentrations—such factorsare discussed in blue type—and illustrate where the direct volume method onthe BD Accuri C6 has advantages over other techniques. For comparison, cellswere also counted by counting beads and, in one experiment, by hemocytometer.Figure 2. The BD Accuri C6 peristaltic pumpsystem.The unique laminar-flow fluidics system of theBD Accuri C6, which is driven by peristalticpumps, combines the advantages of hydrodynamically focused cell sampling with theability to report absolute cell counts for anyidentified population in a sample.MaterialsCell linesProduct DescriptionVendorCatalog NumberU937 human lymphomaATCCCRL-1593.2Jurkat human T-cell leukemia, Clone E6-1ATCCTIB-1523T3 mouse CloneVendorCatalog NumberCD3FITCUCHT1BD Biosciences555332CD19PEHIB19BD Biosciences555413CD41PEHIP8BD Biosciences555467Product DescriptionVendorCatalog NumberBD FACS lysing solutionBD Biosciences349202BD Pharmingen 7-AAD staining solutionBD Biosciences559925BD Trucount absolute counting tubesBD Biosciences340334Trypan blueHyCloneSV300840Ancillary reagents and materialsInstrumentsAll cytometer data was acquired using a BD Accuri C6 flow cytometer system.Prior to data collection, the instrument was validated for accurate volumerecording using BD Trucount tubes, which contain a known number of fluorescentbeads in a lyophilized pellet. The acceptable range of bead counts on theBD Accuri C6 is 20% of the expected value.BD Accuri C6 software was used for acquisition, analysis, and calculation ofcell counts. Unless otherwise noted, 25 μL of each sample was collected fromthe same tube three times using the Medium fluidics setting (flow rate 35 μL/min, core size 16 μm). The 25-µL collection amount was chosen to minimizeacquisition time, avoiding sample settling while still collecting a significantnumber of cells. Researchers can adjust this balance for each experiment,depending on the sample size desired and the propensity for samples to settle.To resuspend cells, the samples were flicked several times before placing themon the cytometer. When automating data collection with the BD CSampler accessory, use the agitate function to reduce settling. 5 Determine optimalconditions empirically with each sample.
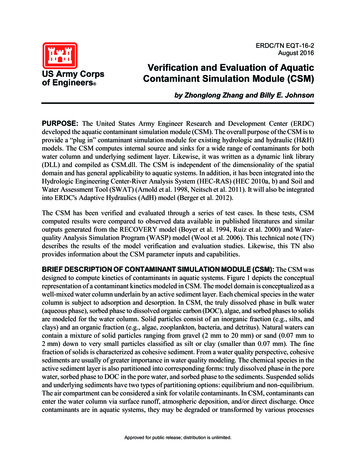
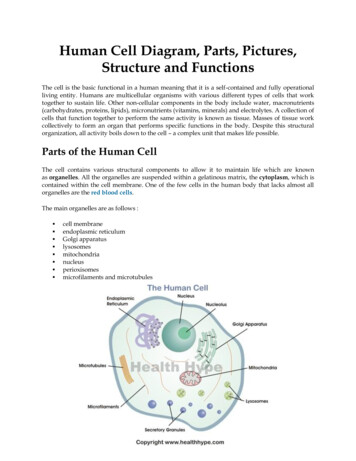
BD BiosciencesWhite PaperJuly 2012Determining Cell Concentration by Direct Volume on the BD Accuri C6ATo provide comparative counting bead data, BD Trucount absolute countingtubes were used for all experiments. A known number of beads in the tube werediluted in a known volume (in this case, 500 μL) to determine the expected beadconcentration. Counting the beads in the sample then yields the volume, whichcan be used to calculate the concentration of cells sampled. Bead counts werecalculated using an FL1 vs FL2 plot. The comparative counting bead results arediscussed under “Direct volume vs counting beads” later in this paper.10 510 6A06 Unlabelled JurkatGate: [No Gating]10 3Microscopic cell counts were obtained using a Neubauer cell counting chamber.Viable78.0%10 110 2FL3-A10 4Dead0.1%10 4.510 510 610 6.9FSC-AA06 Unlabelled JurkatGate: [No Gating]10 510 4FL2-A10 310 210 110 110 210 310 410 510 610 7.2FL1-AA06 Unlabelled JurkatGate: [No Gating]Trucount Beads1.2%10 510 4FL4-A10 310 210 110 110 210 310 410 510 610 7.2FL3-AC01 J 181Gate: all except Trucount Beads10 510 6DDead17.0%10 410 37-AAD FL3-A10 210 110 5When using BD Trucount tubes, counting beads should be excluded fromanalysis since they can overlap with the samples and interfere with accuratecounts. BD Trucount beads are most accurately identified in a biparametricfluorescence plot such as FL1 vs FL2 (Figure 3B) or FL3 vs FL4 (Figure 3C).Use a plot in which they do not overlap with other samples. In this case, thegate in Figure 3B was used to exclude the beads from the FSC vs FL3 plots(Figures 3D and 3E).For comparison, undiluted samples were also counted on a hemocytometer.Trypan blue was added 1:10 to undiluted cells in 1.5-mL microfuge tubes. Tenmicroliters of labeled cells were transferred to the hemocytometer slide, andcounts were performed in triplicate. At least 50 non-blue (viable) cells werecounted for each replicate.Viable60.2%10 4.5Cultures of U937, Jurkat, and NIH/3T3 cell lines were incubated under standardconditions for 7–8 days or 13–14 days, then harvested and resuspended in culturemedia. From each culture, 0.5 mL was transferred into three BD Trucount tubesfor flow cytometry analysis, either undiluted or diluted 1:5 or 1:10 in phosphatebuffered saline (PBS). Five microliters of a 1 mg/mL stock solution of 7-Aminoactinomycin D (7-AAD) solution was added to each sample tube and mixedthoroughly. 7-AAD is a fluorescent viability dye that, like trypan blue, markscells with compromised outer membranes. Tubes were kept at room temperature(RT) in the dark, gently mixed, and sampled 5–30 minutes after 7-AAD wasadded. For each cell line, an additional tube of undiluted cells (without 7-AAD)served as an unstained control sample to determine the viable cell gate.Samples were analyzed on the BD Accuri C6 by setting up a density plot offorward light scatter (FSC) vs 7-AAD fluorescence (7-AAD FL3) in BD AccuriC6 software. A negative control sample for each cell type (without 7-AAD) wasused to define the viable-cell gate in that plot (Figure 3A). This gate includedevents with high FSC and defined the FL3 background fluorescence.10 610 7.2CMethods and resultsViable cell countsTrucount Beads1.2%10 610 7.2B10 610 6.9FSC-AEDead0.0%10 310 210 1FL3-A10 410 510 6A06 Unlabelled JurkatGate: all except Trucount Beads10 4.5Viable79.0%10 510 6FSC-A10 6.9Figure 3. Viable and dead cell gate placement.A. Unstained control cells were used to place the viable cell gate on an FSC vs FL3 plot.BD Trucount beads were identified on (B) FL1 vs FL2 and (C) FL3 vs FL4 plots. D. The bead gatefrom Figure 3B was used to exclude the beads from the FSC vs FL3 plot. E. 7-AAD cells were usedto place the dead cell gate on the FSC vs FL3 plot.
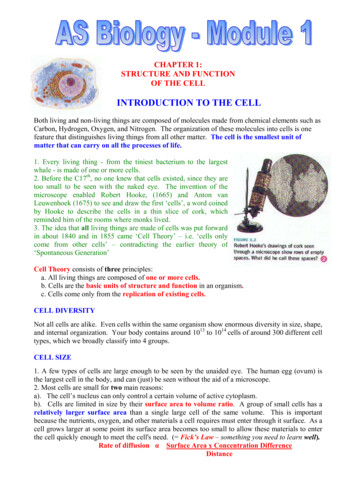
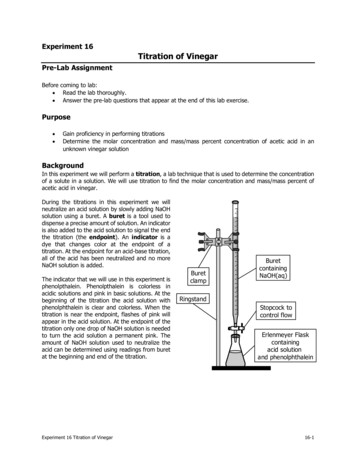
BD BiosciencesWhite PaperJuly 2012Determining Cell Concentration by Direct Volume on the BD Accuri C6Page 5Figure 4 and Table 1 show the results of counting viable cells using the directvolume method on the BD Accuri C6 compared to the hemocytometer. The meanconcentration of viable cells was similar as reported by both methods, with nosignificant differences found (compared by paired Student’s t-test). However,reports were more precise (indicated by standard deviation or %CV) using thedirect method, reaching significance in one of three populations (compared byF-test).Concentration of Viable er20001500100050003T3U937JurkatFigure 4. Selected viable cell concentrations by two counting methods.Comparison of mean viable cell counts per microliter (colored bars) and standard deviations (errorbars) determined by direct volume and hemocytometer methods using three different cell linesone week after passage to a new flask.Table 1. Viable cell concentrations from three cell lines, calculated by direct volume µL)Std DevMean(cells/µL)Std Jurkat3,854.1219.66%3,299.2%CVComparisons%CVMean (PairedStudent’s t-Test)Std .99%0.1090.686
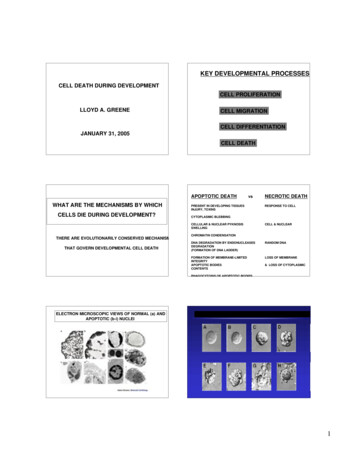
July 2012Determining Cell Concentration by Direct Volume on the BD Accuri C6AFigure 5 compares the counts obtained by the direct volume method for a dilutionseries of each culture. Each dilution series resulted in a linear correlation (R 2 0.999 for all cultures), suggesting that the cytometer was able to accurately reporta broad range of concentrations.B04 A D142Gate: [No Gating]Concentrations of Viable Cells in Diluted Samples500,0001,008,900White Paper10,000y 38.716xR2 0.999061,000,000FSC-HLymphs14.5%y 18.625xR2 0.99995y 10.52xR2 9B04 A D142Gate: [No Gating]200,000B291,6670Cell Concentration (Cells/µL)Lymphs13.6%0SSC-HBD Biosciences1010450,001FSC-HB04 A D142Gate: [No Gating]Figure 5. Serial dilutions of viable cells.Comparison of viable cells per microliter determined by direct volume method using serial dilutionsof 3T3, U937, and Jurkat cells. Axes are scaled logarithmically for easier comparison.Trucount Beads5.9%10 410 310 210 1CD19-PE FL2-H10 5Immune cell counts10 110 210 310 410 510 610 7.2CD3-FITC FL1-HB04 A D142Gate: (Lymphs in all) and (Trucount Beads in all)B Cells CD19 Trucount Beads8.8%30.2%10 410 310 210 1CD19-PE FL2-H10 510 610 7.2D100Dilution (% of Original Sample)1,750,00110 610 7.2C1,000,000T Cells CD3 45.5%Q3-LL15.5%10 110 210 310 410 510 610 7.2CD3-FITC FL1-HFigure 6. Identification of B- and T-cellsubpopulations.A. Lymphocytes were gated on an FSC vs SSC(side scatter) plot. B. The Zoom tool was usedto adjust the gate for optimal selection of cells.C. Beads were gated on a fluorescence plot.D. B- and T-cell subpopulations were identified by CD19 and CD3 expression, respectively.Color compensation was applied to remove theeffects of fluorescence spillover.To determine B-cell (CD19 ) and T-cell (CD3 ) concentrations, human peripheralblood was collected from two healthy donors. Duplicate samples from each donorwere prepared by adding 50 μL of blood to 5 μL each of CD3 FITC and CD19PE antibodies and incubating for 20 minutes at room temperature in the dark.Red blood cells were lysed by adding 450 μL of BD FACS lysing solutionaccording to the manufacturer’s instructions. Cells were pelleted and resuspendedin 500 μL of PBS 5% bovine serum albumin (BSA), and 500 μL was transferredto BD Trucount tubes. Five thousand lymphocytes were collected from eachsample on the BD Accuri C6 with an FSC-H threshold of 200,000.When possible, it is best to minimize steps such as washes and buffer changesin order to minimize loss of sample during each pelleting and resuspensioncycle. Proper titration of antibodies can reduce background fluorescence,alleviating the need for extra wash steps. In addition, whenever a differentbuffer is used, the operator must validate fluidics performance with referencebeads in that sample buffer and calibrate the fluidics if necessary.Thresholds should be determined empirically for each sample type to collectthe complete population of interest while minimizing unnecessary data fromdebris or other cells.After gates were set on lymphocytes (Figure 6A, B) and BD Trucount beads(Figure 6C), B cells (CD19 ) and T cells (CD3 ) were clearly distinguished on anFL1 vs FL2 plot (Figure 6D). Gates should be set carefully in order to encompassthe entire population of interest while excluding other cells. The Zoom functionin BD Accuri C6 software can be helpful for setting the boundaries of the gatesaccurately (Figure 6B).
BD BiosciencesWhite PaperJuly 2012Determining Cell Concentration by Direct Volume on the BD Accuri C6Page 7In experiments using multiple fluorescent parameters, color compensation maybe necessary to reduce the effect of fluorescence spillover from the primarydetector into neighboring detectors. See the BD Accuri C6 Software UserGuide for a more detailed discussion of fluorescence spillover and colorcompensation.Table 2 shows immune cell statistics for two samples from two donors using thedirect volume method. Results from duplicate samples were consistent, with%CVs less than 8%.Table 2. B- and T-cell concentrations and %CV calculated using direct volume.DonorSampleB-Cell (CD19 ) Counts/µL (%CV)113.4 (6.9%)83.7 (6.1%)216.8 (2.6%)103.9 (7.5%)1B04 D4 P2Gate: [No Gating]10 510 110 210 310 410 510 610 7FL1-HB04 D4 P2Gate: all except (Trucount Beads in all)10 4FSC-H10 1.310 210 3Platelets75.9%10 310 425.2 (3.0%)137.3 (6.5%)28.5 (4.0%)149.0 (1.3%)10 5Platelet concentrations were reported on the BD Accuri C6 in duplicate samplesof human whole blood from two donors (method modified from Alugupalli, etal.6). Two-microliter aliquots of whole blood, collected in sodium citrate tubes,were diluted 1:10 into HEPES-buffered saline with 1% formaldehyde. Twentymicroliter aliquots of diluted blood were then incubated in 1.5-mL tubes for 20minutes at room temperature with 20 μL of CD41 PE antibody. Samples werefurther diluted with 1 mL of HEPES-buffered saline with 1% formaldehyde, and500 μL of diluted sample were aliquoted to BD Trucount tubes.In addition to minimizing loss of sample, sample preparation should beadjusted to ensure optimal conditions for the samples, such as preventingclumping and enhancing their viability. For platelets, it is important to use aprotocol that prevents their activation, which would lead to aggregation andimpair accurate counting.Samples were well mixed and acquired on the BD Accuri C6. Data was collectedusing an FL2-H (CD41 PE) threshold of 1,000. Dilution factors were applied todetermine the platelets per microliter of the original whole blood sample.10 510 6 10 6.6B12Platelet counts10 410 2.7CD41-PE FL2-H14Trucount Beads11.4%10 610 7.2AT-Cell (CD3 ) Counts/µL (%CV)10 610 6.6CD41-PE FL2-HFigure 7. Platelet discrimination.A. BD Trucount beads were identified andgated on an FL1 vs FL2 plot. B. With the beadsexcluded, the CD41 platelets were identifiedand gated on an FL2 vs FSC plot.The FL2-H acquisition threshold illustrates the delicate balance betweenexcluding debris (and minimizing the amount of data collected) while stillincluding the platelets and beads. Although the default FSC threshold of 80,000works well for most cell types, it is too high for smaller cells such as platelets.Instead, the platelets’ CD41 PE fluorescence in FL2 was used to set the threshold.After excluding the beads (Figure 7A), the platelets were clearly identified on anFL2 vs FSC plot (Figure 7B).Table 3 shows platelet statistics for two samples from two donors using the directvolume method. As in Table 2, all %CVs are less than 8%. Adjusting for dilutionyields platelet counts per microliter of blood.Table 3. Platelet concentrations and %CV calculated using direct volume.Donor34SamplePlatelet (CD41 )Counts/µL of Sample (%CV)DilutionFactorPlatelet (CD41 )Counts/µL of Blood (%CV)1684.4 (4.8%)520355,867 (4.8%)2719.4 (3.7%)520374,067 (3.7%)1607.6 (2.3%)520315,959 (2.3%)2556.7 (7.1%)520289,487 (7.1%)
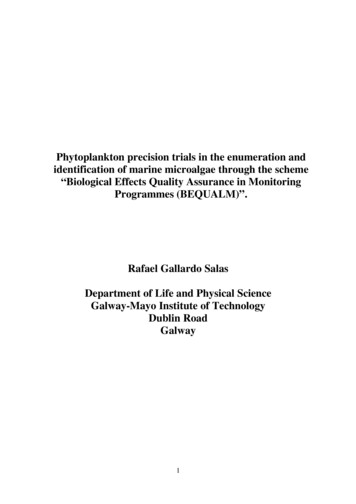
BD BiosciencesWhite PaperJuly 2012Determining Cell Concentration by Direct Volume on the BD Accuri C6Direct volume vs counting beadsThe ability of the BD Accuri C6 to determine volume directly eliminates the needto add counting beads to each sample. This can reduce costs significantly inexperiments that analyze many samples.Counting beads can also overlap with samples of interest. In Figure 3A, forexample, the BD Trucount beads overlap Jurkat cells on an FSC vs FL3 plot. Thisoverlap can interfere with accurate cell counts. The beads’ broad fluorescencespectrum can help to resolve this issue. After identifying the bead population onan FL1 vs FL2 plot (Figure 3B), a gate was set to exclude them from the FSC vsFL3 plot (Figure 3D). Only then could the Jurkat cells be counted. In cases likethis, where counting beads overlap with samples, the direct volume method is aconvenient alternative that eliminates these complications.Since all the experiments reported in this white paper used BD Trucount tubes,they were aggregated to compare the direct volume vs counting bead methodson the BD Accuri C6. A total of 48 different samples of human peripheral bloodand mammalian cell lines were collected as described in earlier sections of thispaper. All samples were collected in triplicate on the BD Accuri C6. As shownin Figure 8, the direct counts correlated highly (r2 0.9989) with counting beadsresults.Count by Beads (Cells/mL)10,000,0001,000,000100,000y 1.0932xr2 0.9989N 00,000Count by Volume (Cells/mL)Figure 8. Comparison of cell concentration reported based on volume vs counting beads.Serial dilutions of Jurkat, 3T3, and U937 cells, and T cells, B cells, and platelet samples from fourhuman peripheral blood donors, were counted on the BD Accuri C6 by two methods. X-axis valuesrepresent volume reported, while y-axis values were calculated based on counting beads.The high correlation validates the use of direct-volume reporting on theBD Accuri C6. Both the direct volume and bead counting methods are consistentacross a wide range of concentrations. The slope of the line—about 1.09—indicates that the counting bead method consistently produces slightly higherconcentration readings than the direct volume method.Because both the direct volume and counting beads methods have their ownintrinsic sources of error, this analysis cannot determine which is more accurate.For most experiments, in which cell concentrations are compared across differentconditions, either technique, if used consistently, produces valid results over a
BD BiosciencesWhite PaperJuly 2012Determining Cell Concentration by Direct Volume on the BD Accuri C6Page 9broad range of cell concentrations. However, counts by the two methods maydiffer. Therefore, if determining the absolute cell concentration is important,validating the chosen method with known standards is recommended.Figure 9 and Table 4 illustrate a typical experiment comparing differentconditions, in this case the concentration of dead cells for each cell line afterculturing for one or two weeks. Dead cell counts increased significantly in the2-week cultures of Jurkat and 3T3 cells (p 0.05), but did not increasesignificantly in the U937 cultures.Concentration of Dead Cells in Young and Old CulturesConcentration of Dead Cells (Cells/µL) Log Scale10001001003T3 1 week3T3 2 weeksU937 1 weekU937 2 weeksJurkat 1 weekJurkat 2 weeksFigure 9. Concentration of dead cells in 1- and 2-week-old cultures.Comparison of dead cells per microliter determined by the direct volume method in 1- vs 2-weekold cultures for three cell lines.Table 4. Dead cell concentrations in three cell lines calculated using direct volume.1 week2 weeksMean(cells/µL)Std DevMean(cells/µL)Std DevPaired tests indicate comparisons between 1- and 2-week means.
BD BiosciencesWhite PaperJuly 2012Determining Cell Concentration by Direct Volume on the BD Accuri C6DiscussionAlthough hemocytometers are traditionally used to measure cell concentrations,their sources of error are well known,7 and this study confirmed that they canbe highly variable (the average %CV for replicate viable cell counts 17.5%). Inaddition, hemocytometers cannot effectively count small particles such asplatelets, or differentiate a subset of cells within a heterogeneous population.Flow cytometers allow precise phenotypic identification of cell subpopulationsusing multiparametric sample analysis with single-cell resolution. By addingcounting beads to a sample, standard laminar-fluidics flow cytometers canprovide rapid and accurate cell concentration measurements as well. Countingbeads save time and improve precision compared to the hemocytometer method,8and have largely replaced it when a flow cytometer is available. However, eventhis approach is subject to error sources such as pipetting technique andcalibration, variability in bead-stock concentrations, and subjective bead gatesettings. The beads are also an added expense.The BD Accuri C6 flow cytometer features a unique peristaltic fluidics systemthat allows direct reporting of the volume sampled from cell suspensions. Thesystem operates with standard laminar flow that enhances fluorescence and lightscatter resolution. The current study demonstrated that volume reporting on theBD Accuri C6 offers a convenient method for determining concentrations ofviable cells in cultured cell lines; immune cells in human peripheral blood; andplatelets in whole, unlysed human peripheral blood.Cell concentration determined by the volume method shares the advantages ofcounting beads, such as speed, accuracy, and analysis of complex populations,while minimizing their added cost and complexity. The counts correlate highlywith counting beads and appear to be more precise than the hemocytometermethod (p 0.01 in one of three comparisons), making it easier to obtainsignificant results. The only data calculation required is to account for dilutionfactors, if applicable. It is not necessary to “back-calculate” the volume sampledbased on the number of beads collected, or to decide subjectively how to gate onthe singlet bead population.9In sum, the BD Accuri C6 offers cell biologists an easy-to-use, affordable, andhighly functional cell counter and flow cytometer, all in one.
BD BiosciencesWhite PaperJuly 2012Determining Cell Concentration by Direct Volume on the BD Accuri C6Page 11References1. Gratama JW, Braakman E, Kraan J, et al. Comparison of single and dual-platform assay formatsfor CD34 haematopoietic progenitor cell enumeration. Clin. Lab Haematol. 1999;21:337-346.2. P asquinelli G, Foroni L, Buzzi M, et al. Smooth muscle cell injury after cryopreservation ofhuman thoracic aortas. Cryobiology. 2006;52:309-316.3. Kim GG, Donnenberg VS, Donnenberg AD, Gooding W, Whiteside TL. A novel multiparametricflow cytometry-based cytotoxicity assay simultaneously immunophenotypes effector cells:comparisons to a 4 h 51Cr-release assay. J Immunol Methods. 2007;325:51-66.4. Charoensuk V, Gati WP, Weinfeld M, Le XC. Differential cytotoxic effects of arsenic compoundsin human acute promyelocytic leukemia cells. Toxicol Appl Pharmacol. 2009;239:64-70.5. BD Biosciences. A guide to absolute counting using the BD Accuri flow cytometer. TechnicalBulletin, January 2012. Available at bdbiosciences.com under Support Resources BD Accuri C6 System.6. Alugupalli KR, Michelson AD, Barnard MR, Leong JM. Serial determinations of platelet counts inmice by flow cytometry. Thromb Haemost. 2001;86:668-671.7. Zanyk MJ, Banerjee D, McFarlane DL. A flow cytometric assay for target binding by NKH1A cellsusing a single laser system. Anal Cell Pathol. 1990;2:241-251.8. Keeney M, Chin-Yee I, Weir K, Popma J, Nayar R, Sutherland DR. Single platform flowcytometric absolute CD34 cell counts based on the ISHAGE guidelines. Cytometry Part A.1998;34:61-70.9. For guidelines on obtaining accurate cell counts on the BD Accuri C6, see: BD Biosciences. Aguide to absolute counting using the BD Accuri flow cytometer. Technical Bulletin, January2012. Available at bdbiosciences.com under Support Resources BD Accuri C6 System.
BD BiosciencesWhite PaperJuly 2012Determining Cell Concentration by Direct Volume on the BD Accuri C6For Research Use Only. Not for use in diagnostic or therapeutic procedures.BD, BD Logo and all other trademarks are property of Becton, Dickinson and Company. 2012 BD23-14505-00BD Biosciencesbdbiosciences.com
All cytometer data was acquired using a BD Accuri C6 flow cytometer system. Prior to data collection, the instrument was validated for accurate volume recording using BD Trucount tubes, which contain a known number of fluorescent beads in a lyophilized pellet. The acceptable range of bead counts on the BD Accuri C6 is 20% of the expected value.