Transcription
A LIQUEFACTION HAZARD MAP OF THE LAS VEGAS VALLEY,NEVADACRISCIONE1 , J. J., WERLE2 , James L., SLEMMONS3 , D. Burton,andLUKE4 , Barbara A.ABSTRACTThe potential for basin amplification of ground motion from significant seismicsources 100-200 km (62-124 mi.) from the Las Vegas Valley (such as the Death ValleyFault System) and Quaternary faults in the valley could provide sufficient energy tocause liquefaction. Key criteria of liquefiable soils coupled with a shallow groundwatertable (less than 15 m (50 ft)) are met at several sites in the Las Vegas Valley. Toinvestigate the extent of the liquefaction hazard, a map was prepared from existing datacompiled from geotechnical reports, using screening protocols for liquefactionpotential.Geotechnical soils reports for the Las Vegas area were screened to establish adatabase. The data were compiled with geographical coverage of the valley in mind.Emphasis was placed on areas with favorable surficial geology and groundwaterconditions. Once established, the data were evaluated using protocol criteria toascertain the degree of liquefaction hazard present at the site. The final product hasbeen superimposed on the map base used by the Clark County Building Department forother soil constraints mapping in the Las Vegas Valley. Thus, the liquefaction hazardmap can be used as a planning tool to indicate whether site-specific investigations forliquefaction susceptibility are warranted.INTRODUCTIONIt has been clearly demonstrated that the geological and historical record suggeststhat earthquakes can cause widespread destruction to cities established in young alluvialvalleys (Hitchcock et al., 1999). Lew (2001) suggests that a combination of thepresence of active seismic faults, young loose alluvium and shallow ground water arethe ingredients that could result in the occurrence of liquefaction. For Las VegasValley,1 UNLV, Department of Geosciences, University of Nevada, Las Vegas, NV 891542 Converse Consultants, 731 Pilot Road, Suite H, Las Vegas, NV 891193 UNR, Professor Emeritus; Consultant, 2905 Autumn Haze Lane, Las Vegas, NV 89117
4 UNLV, Dept. of Civil and Environmental Engineering, Las Vegas, NV 89154-4015research has demonstrated several seismogenic faults (Bell & Price, 1991; Wyman et al,1993; dePolo and Bell, 2000; dePolo et al., 1989; dePolo and dePolo, 1998; andSlemmons et al., 2001), which occur locally and regionally that could contribute to thepotential for liquefaction. In additional, the potential for basin amplification (Su et al.,1998) of ground motion from significant seismic sources 100-200 km (62-124 mi.) fromthe valley (Sawyer et al., 1998) could provide the mechanism to cause liquefaction inthe valley.Werle et al. (2000) presented the results of a preliminary screening investigationconducted to determine whether there are any indicators of liquefaction potential in theLas Vegas Valley. This investigation revealed that the important criteria forliquefaction susceptibility - liquefiable soils and shallow groundwater table - are met inthe Las Vegas Valley. Research by Zikmund (1996) has demonstrated that more thanhalf of the urbanized area of the Las Vegas Valley has a shallow groundwater table, andgeologic maps (Bingler, 1977, Matti and Bachhuber, 1985, Matti et al., 1987, and Mattiet al., 1993) show that significant portions of the valley consist of Holocene andPleistocene alluvial and playa deposits that are extensively sand and silt.The preliminary investigation by Werle and others was a limited evaluation usingexisting data on a few selected sites. The data were from past geotechnicalinvestigations that were not directed to evaluate the potential for liquefaction as part ofthe investigation. The investigators concluded that the potential for damage due toseismically induced liquefaction is low for sites located at the economically importantLas Vegas Strip and Downtown. On the other hand, a site evaluated in the eastern partof the Las Vegas Valley along Las Vegas Wash had a higher level of hazard. This siteand some others reviewed in the area had sand deposits with low SPT (StandardPenetration Test) blow counts (“N-values”) combined with the shallow groundwaterconditions.The goals of this investigation were to develop a more extensive database toascertain the liquefaction hazard in the Las Vegas Valley and to produce a liquefactionsusceptibility map. With this new data and the resulting map in hand, one can betterassess whether screening investigations for liquefaction potential should be conductedas a part of geotechnical studies for projects in the affected areas.DATA COLLECTION AND ANALYSISThe assessment of liquefaction susceptibility incorporates evaluation ofgeotechnical borehole data for late Quaternary deposits that exhibit the appropriate age,textural and groundwater conditions conducive to failure. Analyses of liquefaction
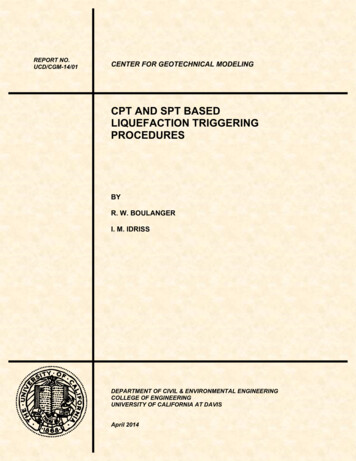
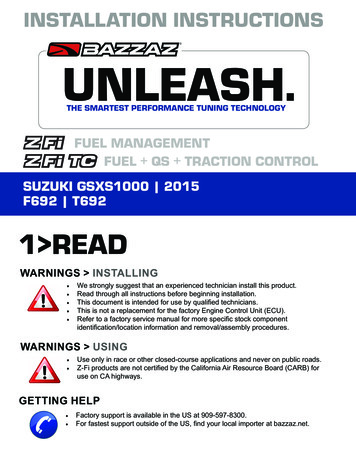
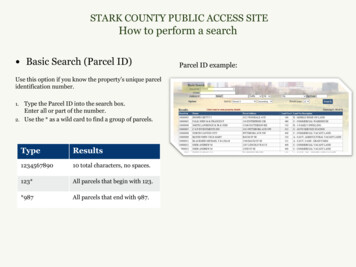
susceptibility were performed using the Seed Simplified Procedure (Seed et al., 1983)that incorporates data on groundwater conditions, overburden load, SPT data and thecyclic stress ratio.The data collection procedure was facilitated by a review of geotechnical reportsfrom Converse Consultants in their Las Vegas office. These reports included projectsdated from 1997-2001, which was analyzed for liquefaction potential for this study. Tohelp limit the extent of the data collection, the study area excluded portions of thevalley unlikely to have liquefaction potential based on soil type and depth togroundwater. The limit of the study area is shown in Figure 1.The record review was initiated to create a database of sites evaluated forliquefaction potential. A spreadsheet was constructed using projects and data fromlogging of geotechnical site investigation projects from Converse Consultants. All datareported was from the original logging of the boreholes with no filters applied or anymodifications. Township, Range, and Section designations were determined usingThomas Guide 2001, Clark County Street Directory. Latitude and longitude valueswere determined using Microsoft Map Point 2002.The database was constructed with the following constraints: The geotechnical site investigation projects included boreholes that rarelyreached 30 feet and they typically remained opened for variable amounts oftime.The locations of the boreholes were plotted on a project site map, but notidentified as to their surface elevation, longitude, or latitude.The geotechnical site investigation projects used in this research were intendedfor soil foundations reports and varied from single-family homes to miles oflateral pipelines and road construction projects. No report used was identifiedas intended for or included liquefaction susceptible analysis.The borehole depths ranged from 5-80 feet below the surface.The data reported was not modified from the original logging for the specificboreholes, especially, no filters nor modifications were applied for this currentproject.The borehole that had the highest liquefaction susceptible was reported even ifmultiple boreholes were identified during a specific project.The sandy material that had the highest liquefaction susceptible was used toassign the protocol criteria within specific borehole for that location.Thus, the protocol criteria used included soil type, blow count, and groundwaterinformation that were obtained from standard geotechnical site investigation projectswithout modification or filtering of the original borehole logs.
LAS VEGASSCALE: 1 INCH APPROXIMATELY 4 MILESSCALE: 1 inch approximately 4 miles
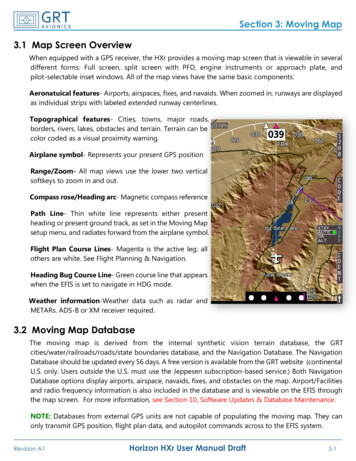
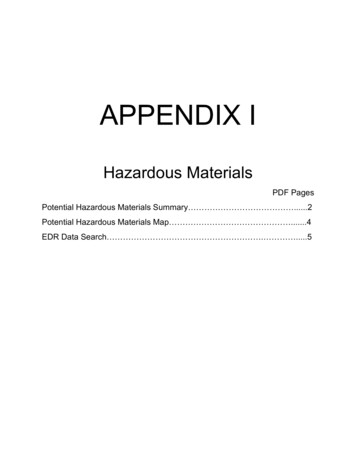
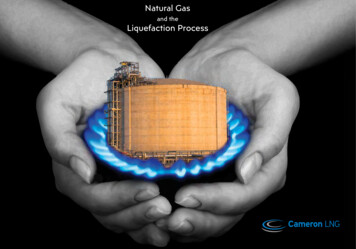
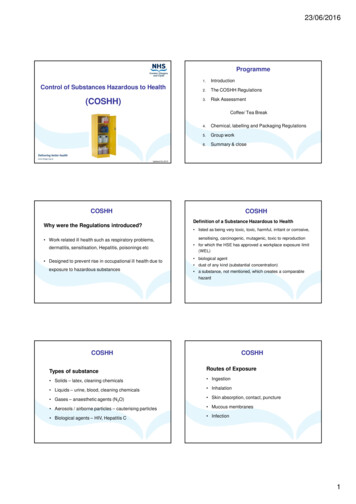
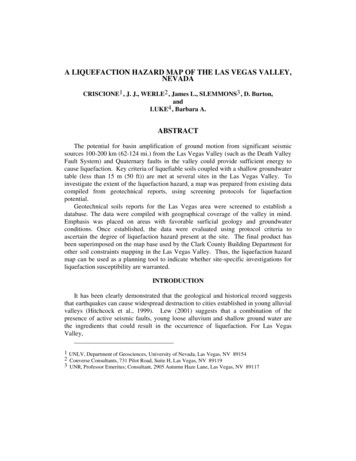
Protocol criteria as suggested by previous guidelines (Nevada Earthquake SafetyCouncil, Guidelines for evaluating liquefaction hazards in Nevada, 2000; SpecialPublication 117, Guidelines for evaluating and mitigating seismic hazards in California,1997; and Lew, 2001) were determined for each selected borehole. This includedassigning values based upon blow counts (less than 30-1 point), water present (yes/no2 points if present and saturated), and type of sandy material present (non-clay 1point; poorly graded sand-4 points; well-graded sand-3 points; silty sand-2 points,sandy clay/clayey sand-1point). An example of how the point system was applied ispoint “34” on the database. This point was assigned 1-point for a blow count of 25, 2points for water being present and saturating the material, 1-point for being a non-clayand 4-points for being a poorly graded sand, which give it a total of 8 points, whichwould place it in the high liquefaction susceptibility category. The categories wereplotted on the map with high values being 7 and 8, moderate values being 5 and 6, andlow values being less than 5.LIQUEFACTION HAZARD MAPFigure 2 represents the data mapped on a base similar to ones used by the ClarkCounty Building Department for other soil constraints mapping in the Las VegasValley. The general limits of the area having the highest liquefaction potential are alsodepicted.From Figure 3, it appears as though the areas of concern are generally located inareas of wash flood plains, and in particular the eastern portion of the Valley withshallow groundwater conditions. Thus, areas of surficial recent deposits with highgroundwater in Las Vegas Valley may be potentially susceptible to failure fromliquefaction during ground shaking in future earthquakes. This indicates that areas ofLas Vegas Valley may be analogies to the geological patterns observed in the SanFernando and Simi Valleys of southern California. These valleys were especially hardhit and adversely affected by the Northridge earthquake January 17, 1994. Hitchcock etal. (1999) and Wills and Hitchcock (1999) showed that the Northridge Earthquakeproduced considerable damage from liquefaction, which was directly related to theground shaking and the saturated Holocene stream deposits in the region.SUMMARY AND CONCLUSIONSSoil data for Las Vegas Valley were compiled with the aid of geotechnical soilreports from Converse Consultants projects over the time period of 1997 to 2001. Thepurpose of this investigation was to establish a database and to compile a liquefaction
SCALE: 1 INCH APPROXIMATELY 4 MILESLiquefaction PotentialLOWMODERATEHIGHAREA WITH HIGH POTENTIALFIGURE 2 - LIQUEFACTION HAZARD MAP FOR LAS VEGAS VALLEY
SCALE: 1 INCH APPROXIMATELY 4 MILESGROUNDWATER LESS THAN 30 FEET ( ZIKMUND, 1996)FEMA 100 YR. FLOOD PLAIN(FEMA FLOOD INSURANCE RATE MAPS, 1989)FIGURE 3 - LIMITS OF SHALLOW GROUNDWATERCONDITIONS AND GEOLOGIC RECENT DEPOSITS
susceptibility map. Geographical coverage of the valley with over 150 data points wasused to develop the liquefaction susceptibility map. Before plotting each of the pointsscreening protocols for liquefaction potential was applied. The protocols emphasizedareas with favorable surficial geology and groundwater conditions. The final product isshown on the map base used by the Clark County Building Department for other soilconstraints mapping in the Las Vegas Valley and delineates areas that have conditionsrecognized to produce liquefaction. Thus, the liquefaction hazard map can be used as aplanning tool and provide a guideline for developing site-specific investigations in areasthat have liquefaction susceptible conditions.In summary, the combination of high groundwater within loose sandy sedimentsconstitutes a significant liquefaction hazard beneath portions of Las Vegas Valley.Given the realization that liquefaction does not occur randomly, but is restricted todeposits with geologic and hydrologic characteristics that can be identified and mapped(Hitchcock et al., 1999), the preliminary liquefaction susceptibility map presentedshows areas of concern. With this in mind, it is recommended for future projects inareas that are located in designated liquefaction hazard zones that the procedures andguidelines set forth in the State of Nevada in Guidelines for evaluating liquefactionhazards be applied. In general, this would require consultants to perform screeninginvestigations to filter out sites that have no potential or low potential for liquefaction.If the preliminary screening investigation does not clearly demonstrate the absence ofliquefaction hazards at a project site, a quantitative evaluation will be required to assessthe liquefaction hazards.ACKNOWLEDGMENTSThis effort was largely supported by the Federal Emergency Management Agency(FEMA) in concert with the Nevada Division of Emergency Management. The authorswould also like to thank the Nevada Earthquake Safety Council for their continuinginterest. Finally, Mr. Rich Pugliese at Converse Consultants has been particularlyhelpful in generating the maps shown herein.REFERENCESBell, J.W. and Price, J.G., 1991, Subsidence in Las Vegas Valley, 1980-1991: FinalProject Report. Nevada Bureau of Mines and Geology, Final Project Report to aConsortium of 11 City, County, State & Federal Agencies.Bingler, E.C., 1977, Las Vegas SE Folio Geologic Map: Nevada Bureau of Mines andGeology, 1:24,000 scale.
California Division of Mines and Geology (DMG), 1997, Guidelines for evaluating andmitigating seismic hazards in California, Special Publication 117, California DMG,Sacramento, 11 pp.dePolo, C. M. and Bell, J. W., 2000, Map of faults and earth fissures in the Las Vegasarea: Nevada Bureau of Mines and Geology Preliminary Map.dePolo, C. M., Clark, D. G., Slemmons, D. B., and Aymard, W. H., 1989, HistoricalBasin and Range Province surface faulting and fault segmentation: U. S.Geological Survey Open-File Report 89-315, pp. 131-162.dePolo, D. M. and dePolo, C. M., 1998, Earthquakes in Nevada, 1852-1996: NevadaBureau of Mines and Geology, Map 111.Hitchcock, C. S., Loyd, R. C., and Haydon, W. D., 1999, Mapping liquefaction hazardsin Simi Valley, Ventura County, California: Environmental & EngineeringGeoscience, Vol. V, No. 4, pp. 441-458.Lew, M., 2001, Liquefaction evaluation guidelines for practicing engineering andgeological professionals, in Proceedings of the 11th International Conference SoilMechanics and Foundation Engineering, San Francisco, CA, Vol. 1, pp. 321-376.Martin G.R., and Lew M., (Editors) 1999, Recommended procedures forimplementation of DMG Special Publication 117 – Guidelines for analyzing andmitigating liquefaction in California, Southern California Earthquake Center,University of Southern California, March.Matti, J.C. and Bachhuber, F.W., 1985, Las Vegas SW Quadrangle Geologic Map:Nevada Bureau of Mines and Geology, 1:24,000 scale.Matti, J.C., Bachhuber, F.W., Morton, D.M., and Bell, J.W., 1987, Las Vegas NWQuadrangle Geologic Map: Nevada Bureau of Mines and Geology, 1:24,000 scale.Matti, J.C., Castor, S.B., Bell, J.W. and Rowland, S.M., 1993, Las Vegas NEQuadrangle Geologic Map: Nevada Bureau of Mines and Geology, 1:24,000 scale.Nevada Earthquake Safety Council, 2000, Guidelines for evaluating liquefactionhazards in Nevada, Nevada Bureau of Mines and Geology, Reno, NV, 7 pp.Sawyer, T.L., Klinger, R.E., dePolo, C.M., & Reheis, M.C., (Abstract), 1998, DeathValley Fault System: significant ground motion sources for Southern Nevada, in
Proceedings of a Conference on Seismic Hazards in the Las Vegas Region, UNLV,Las Vegas, NV, November 14-15, 1996, Nevada Bureau of Mines and GeologyOpen-File Report 98-6.Seed, H. B; Idriss, I. M.; and Arango, I., 1983, Evaluation of liquefaction potentialusing field performance data: Journal of Geotechnical Engineering, Vol. 109, No.3, pp. 458-482.Slemmons, B. D., Bell, J. W., dePolo, C. M., Ramelli, A. R., Ramussen, G. S.,Langenheim, V. E., Jackens, R. C., Smith, K., and O’Donnell, J., 2001, EarthquakeHazards in Las Vegas, Nevada, in Luke, B., Jacobson, E. and Werle, J.,Proceedings: 36th Annual Symposium on Engineering Geology and GeotechnicalEngineering, University of Nevada, Las Vegas, pp. 447-457.Su, F., Anderson, J.G., Ni, S.D., & Zeng, Y., 1998, Effect of amplification and basinresponse on strong motion in Las Vegas, Nevada, Earthquake Spectra, 14(2), pp357-375.Werle, J.L., Klein, M.K., Dunford-Linnert, L.M., and Luke, B.A., 2000, "ScreeningInvestigations for Liquefaction Potential in the Las Vegas Valley, Nevada," inProceedings of the 35th Symposium on Engineering Geology and GeotechnicalEngineering, Idaho State University, Pocatello, ID, pp. 261-274.Wills, C. J. and Hitchcock, C. S., 1999, Late Quaternary Sedimentation andLiquefaction Hazard in the San Fernando Valley, Los Angeles County, California:Environmental & Engineering Geoscience, Vol. V, No. 4, pp. 419-439.Wyman, R.W., Karakouzian, M., Bax-Valentine, Slemmons, D.B., Peterson, L., andPalmer, S., 1993, Geology of Las Vegas, Nevada, United States of America,Bulletin of the Association of Engineering Geologists, Vol. 30, pp.33-78.Youd, T.L. & Perkins, J.B., 1987, Mapping of liquefaction severity index, ASCEJournal of Geotechnical Engineering, Vol. 113, No. 11, pp. 1374-1392.Zikmund, K.S., 1996, Extent and potential use of the shallow aquifer and wash flow inLas Vegas, Valley, Southern Nevada Water Authority, 20 pp.
shown on the map base used by the Clark County Building Department for other soil constraints mapping in the Las Vegas Valley and delineates areas that have conditions recognized to produce liquefaction. Thus, the liquefaction hazard map can be used as a planning tool and provide a guideline for developing site-specific investigations in areas