Transcription
REPORT NO.UCD/CGM-14/01CENTER FOR GEOTECHNICAL MODELINGCPT AND SPT BASEDLIQUEFACTION TRIGGERINGPROCEDURESBYR. W. BOULANGERI. M. IDRISSDEPARTMENT OF CIVIL & ENVIRONMENTAL ENGINEERINGCOLLEGE OF ENGINEERINGUNIVERSITY OF CALIFORNIA AT DAVISApril 2014
CPT AND SPT BASED LIQUEFACTION TRIGGERINGPROCEDURESbyRoss W. BoulangerI. M. IdrissReport No. UCD/CGM-14/01Center for Geotechnical ModelingDepartment of Civil and Environmental EngineeringUniversity of CaliforniaDavis, CaliforniaApril 2014
TABLE OF CONTENTS1. ion of report2. ANALYSIS FRAMEWORK2.1.A stress-based framework2.2.Shear stress reduction coefficient, rd2.3Overburden correction factor, CN2.4Overburden correction factor, K 2.5Magnitude scaling factor, MSF2.6Equivalent clean sand adjustments for fines content2.7Fines content and soil classification estimation using CPT data3. CPT-BASED CASE HISTORY DATABASE3.1.Sources of data3.2.Earthquake magnitudes and peak accelerations3.3.Selection and computation of qc1Ncs values3.4.Classification of site performance3.5.Distribution of data4. UPDATED CPT-BASED TRIGGERING PROCEDURE4.1.Correlation with updated database4.2.Variation with fines content4.3.Variation with earthquake magnitude4.4.Variation with effective overburden stress4.5.Summaryi
5. PROBABILISTIC RELATIONSHIP FOR CPT-BASED PROCEDURE5.1.Probabilistic relationships for liquefaction triggering5.2.Limit state function5.3.Likelihood function5.4.Results of parameter estimation and sensitivity studies5.5.Recommended relationships5.6.Summary6. UPDATE AND EXAMINATION OF SPT-BASED DATABASE AND PROCEDURE6.1.Introduction6.2.Update to SPT-based case history database6.3.Correlation with updated database and analysis framework6.4.Variation with fines content6.5.Variation with earthquake magnitude6.6.Variation with effective overburden stress6.7.Summary7. OTHER CONSIDERATIONS IN DEVELOPMENT OF TRIGGERING MODELS7.1.Equivalent qc/N60 ratios7.2.CRR versus relative state parameter7.3.Comparison to experimentally and theoretically derived models8. SUMMARY AND CONCLUSIONSACKNOWLEDGMENTSREFERENCESAPPENDIX A.MAGNITUDE SCALING FACTORii
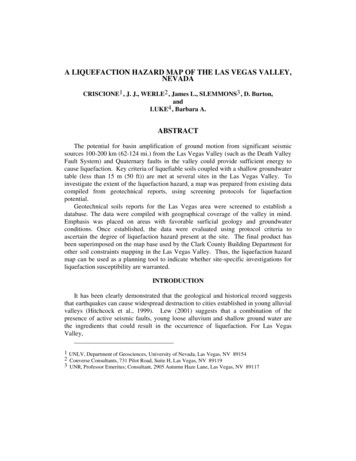
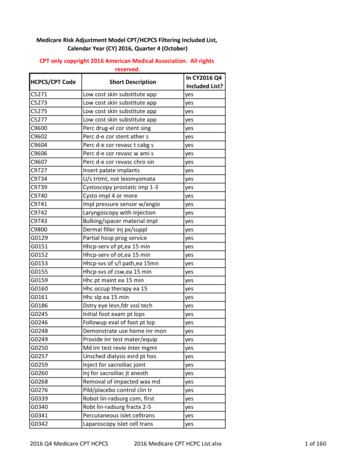
CPT AND SPT BASED LIQUEFACTION TRIGGERINGPROCEDURES1. INTRODUCTION1.1. BackgroundThe Cone Penetration Test (CPT) and Standard Penetration Test (SPT) are the two most widely usedindices for evaluating the liquefaction characteristics of soils. The SPT was used first in developingliquefaction correlations but the CPT has a number of advantages that have made it the primary sitecharacterization tool in certain geologic settings. Shear wave velocity (Vs) tests, Becker Penetration Tests(BPT) and large penetrometer tests (LPT) tend to be used in special situations and thus are used less oftenthan the SPT and CPT in liquefaction evaluations. In most situations, these different site characterizationtools have complementary roles and are most effectively used in combinations.The development of SPT-based and CPT-based liquefaction triggering procedures has progressed over theyears through the efforts of countless researchers. Development of SPT-based correlations began in Japan(e.g., Kishida 1966) and progressed through to the landmark work of Seed et al. (1984, 1985) which setthe standard in engineering practice for over two decades (Youd et al. 2001). Recent updates to SPTbased procedures include those by Idriss and Boulanger (2008, 2010). The SPT-based procedures fromYoud et al. (2001) and Idriss and Boulanger (2010) are compared in Figure 1.1 with the case history data(from Idriss and Boulanger 2010) adjusted to the equivalent vertical effective stress of v 1 atm (101.3kPa, 2117 psf) and an earthquake of moment magnitude of M 7.5. Development of CPT-basedprocedures began with work by Zhou (1980) using observations from the 1978 Tangshan earthquake andwas followed by Seed and Idriss (1981) and Douglas et al. (1981) who proposed the use of correlationsbetween SPT and CPT penetration resistances to convert the then available SPT-based liquefactiontriggering charts for use with the CPT. Other contributions to the advancement of CPT-based liquefactiontriggering procedures since the early 1980s included the work of Shibata and Teparaksa (1988), Stark andOlson (1995), Suzuki et al. (1995, 1997), Robertson and Wride (1997, 1998), Olsen (1997), Moss et al.(2006), and Idriss and Boulanger (2004, 2008). Five recent correlations are compared in Figure 1.2 withthe set of clean sand case histories from Idriss and Boulanger (2008) adjusted to an equivalent v 1 atmand M 7.5.The quantity and quality of CPT and SPT case histories has continued to increase with recent earthquakeevents, including data obtained in the 2010-2011 Canterbury earthquake sequence in New Zealand (e.g.,van Ballegooy et al. 2014, Green et al. 2014) and the 2011 Mw 9.0 Tohoku earthquake in Japan (e.g.,Tokimatsu et al. 2012, Cox et al. 2013). For example, Green et al. (2014) compiled 50 high-quality casehistories representing cases of liquefaction and no liquefaction during the 2010-2011 Canterburyearthquake sequence with subsurface profiles for which the critical layer could be identified withrelatively high confidence. The inclusion of these and other data in liquefaction triggering databasesprovide an opportunity for re-evaluating liquefaction triggering procedures and updating them as may bewarranted.1
Figure 1.1. Examples of SPT-based liquefaction triggering curves with a database of case historiesprocessed with the Idriss-Boulanger (2008) procedure (from Idriss and Boulanger 2008)1.2. PurposeThis report presents a re-examination of CPT-based and SPT-based liquefaction triggering procedures forcohesionless soils. The primary focus of this work is on the CPT-based procedure coupled with anexamination of effects of a change in the magnitude scaling factor relationship on the SPT-basedprocedure. Specific tasks covered by this report include the following: Summarize the liquefaction triggering analysis framework, including a new magnitude scalingfactor relationship and a recommended procedure for estimating fines contents (FC) for use withthe CPT-based procedure;Update the database of CPT-based case histories, including reexamining older case histories andadding data from recent earthquake events;Update the CPT-based liquefaction triggering correlation, as needed;Develop a probabilistic version of the CPT-based liquefaction triggering procedure using theupdated case history database;Examine the SPT-based liquefaction triggering procedure using the revised magnitude scalingfactor relationship and including the addition of 24 case histories to the SPT database; andExamine the consistency between the CPT-based and SPT-based liquefaction triggeringcorrelations.The process that has been used by the authors over the past decade to develop the CPT-based and SPTbased procedures has been to draw from a synthesis of experimental, theoretical, and case history2
Figure 1.2. Examples of CPT-based liquefaction triggering curves for M 7.5 and 'v 1 atm with anearlier database of clean sand liquefaction case histories processed with the Idriss-Boulanger (2008)procedure (from Idriss and Boulanger 2008)findings, rather than view each of the tasks listed above as self-contained parts. This process requires aniterative approach so that each task is informed by findings from the other tasks. It is this synthesis ofinformation from multiple sources that is particularly valuable for arriving at reasonable correlations thatare consistent with the cumulative available information while overcoming the unavoidable limitations ineach individual source of information.1.3. Organization of reportSection 2 of this report contains an overview of the liquefaction analysis framework that has been usedfor the CPT-based and SPT-based liquefaction triggering procedures adopted by the authors. The analysisframework is described in Idriss and Boulanger (2008) except for the revised magnitude scaling factor(MSF) developed herein that accounts for the effects of soil type and denseness. In addition, arecommended relationship and approach for estimating fines contents from CPT data is described.Section 3 presents the updated database of CPT-based liquefaction/no liquefaction case histories. Theselection of earthquake magnitudes, peak accelerations, and representative CPT data are described, andthe classification of site performance discussed.Section 4 presents the updated CPT-based liquefaction triggering correlation and summarizes thedistribution of the case history data relative to the updated correlation. The distributions of the data are3
examined with respect to various parameters (e.g., fines content, earthquake magnitude, overburdenstress) and data sources (e.g., FC from lab data or from CPT-based correlations).Section 5 describes the development of a probabilistic version of the CPT-based liquefaction triggeringcorrelation using the updated case history database. Sensitivity of the derived probabilistic relationship tothe key assumptions is examined, and issues affecting the application of probabilistic liquefactiontriggering models in practice are discussed.Section 6 presents an examination of the effect of the revised MSF relationship on the SPT-basedliquefaction triggering procedure. In addition, the SPT-based database by Boulanger et al. (2012) wasaugmented with 24 additional case histories. The distributions of the case history data relative to the Idrissand Boulanger (2008) triggering correlation are examined with respect to various parameters (e.g., finescontent, earthquake magnitude, overburden stress).Section 7 examines consistency of the CPT-based and SPT-based liquefaction triggering correlations interms of implied qc/N60 ratios and CRR versus relative state parameter relationships. The derivedtriggering relationship is also compared to those derived by Mitchell and Tseng (1990) based on results ofcalibration chamber tests, cyclic laboratory tests, and cone penetration analyses.Section 8 summarizes the major findings and provides concluding remarks.Appendix A presents the revised magnitude scaling factor relationship.4
2. ANALYSIS FRAMEWORK2.1.A stress-based frameworkThe stress-based approach for evaluating the potential for liquefaction triggering, initiated by Seed andIdriss (1967), compares the earthquake-induced cyclic stress ratios (CSR) with the cyclic resistance ratios(CRR) of the soil. The soil's CRR is usually correlated to an in-situ parameter such as CPT penetrationresistance, SPT blow count, or shear wave velocity, Vs. An overview of the stress-based approach thathas been used with CPT or SPT data is presented in this section, followed by additional details regardingspecific model components and analysis procedures in sections 2.2 – 2.7.Earthquake-induced cyclic stress ratio (CSR)The earthquake-induced CSR, at a given depth, z, within the soil profile, is usually expressed as arepresentative value (or equivalent uniform value) equal to 65% of the maximum cyclic shear stress ratio,i.e.:CSRM , v 0.65 max v (2.1)where max maximum earthquake induced shear stress, 'v vertical effective stress, and the subscriptson the CSR indicate that it is computed for a specific earthquake magnitude (moment magnitude, M) andin-situ 'v. The choice of the reference stress level (i.e., the factor 0.65) was selected by Seed and Idriss(1967) and has been in use since. Selecting a different reference stress level would alter the values ofcertain parameters and relationships but would have no net significant effect on the final outcome of thederived liquefaction evaluation procedure, as long as this same reference stress level is used throughout,including forward calculations. The value of max can be estimated from dynamic response analyses, butsuch analyses must include a sufficient number of input acceleration time series and adequate sitecharacterization details to be reasonably robust. Alternatively, the maximum shear stress can beestimated using the equation, developed as part of the Seed-Idriss Simplified Liquefaction Procedure,which is expressed as,CSRM , v 0.65 v amaxr v g d(2.2)where v vertical total stress at depth z, amax/g maximum horizontal acceleration (as a fraction ofgravity) at the ground surface, and rd shear stress reduction factor that accounts for the dynamicresponse of the soil profile.Cyclic resistance ratio (CRR) and penetration resistancesThe CRR is correlated to CPT and SPT penetration resistances after application of procedural andoverburden stress corrections. For SPTs, the various procedural corrections for arriving at a standardized,energy-corrected N60 value are summarized in Idriss and Boulanger (2008, 2010) and thus not repeatedherein. For CPTs, a procedural aspect which warrants clarification for liquefaction applications iscorrection of the measured tip resistance (qc) for unequal end area effects (Campanella et al. 1982) as,5
qt qc 1 ar u2(2.3)where qt the cone tip resistance corrected for unequal end area effects, ar area ratio for the cone tip(typical values between 0.65 and 0.85), and u2 pore pressure measured behind the cone tip. Themagnitude of this correction can be significant for soft clays (as u2 u0, where uo steady state orhydrostatic pore pressure), but is typically quite small for sands (as u2 u0). Thus, the terms qc and qt areapproximately equal in sands and often used interchangeably even if the correction for unequal areaeffects has been performed. The term qc is used herein, with the understanding that the correction hasbeen performed whenever the u2 data are available.CPT and SPT penetration resistances are corrected for overburden stress effects as,qc1N C N qcN C NqcPa(2.4) N1 60 CN N 60(2.5)where CN overburden correction factor, Pa atmospheric pressure, qcN qc/Pa, and qc1N and (N1)60 arethe penetration resistances that would be obtained in the same sand at an overburden stress of 1 atm if allother attributes remain constant (e.g., same relative density, fabric, age, degree of cementation, loadinghistory). Maki et al. (2014) provide a review of overburden normalization frameworks for sands and claysthat are based on different assumptions (i.e., same state parameter versus same void ratio); the effect ofthese alternative normalization schemes on liquefaction triggering correlations are currently beingexamined, but are not included in this report.The soil's CRR is dependent on the duration of shaking (which is expressed through an earthquakemagnitude scaling factor, MSF) and effective overburden stress (expressed through a K factor). Thecorrelation for CRR is therefore developed by adjusting the case history CSR values to a reference M 7.5 and 'v 1 atm as,CSRM 7.5, v 1 CSRM , v (2.6)MSF K The resulting correlation for CRRM 7.5, 1 is then adjusted to other values of M and 'v using,CRRM , v CRRM 7.5, v 1 MSF K (2.7)The soil's CRR is further affected by the presence of sustained static shear stresses, such as may existbeneath foundations or within slopes. The effect of sustained static shear stresses, which may beexpressed through a K factor, is generally small for nearly level ground conditions and is not includedherein because the case history database is dominated by level or nearly level ground conditions.The correlation of CRR to qc1N or (N1)60 in cohesionless soils is also affected by the soil's fines content(FC) which can be expressed as either of,CRRM 7.5, v 1 f qc1N , FC (2.8)6
CRRM 7.5, v 1 f N1 60 , FC (2.9)For mathematical convenience, this correlation can also be expressed in terms of an equivalent clean-sandqc1Ncs or (N1)60cs values which are obtained using the following expressions:qc1Ncs qc1N qc1N(2.10) N1 60cs N1 60 N1 60(2.11)The adjustments qc1N f(FC) and (N1)60 f(FC) are derived so that CRR can be expressed solely interms of qc1Ncs or (N1)60cs as,CRRM 7.5, vc 1 f qc1Ncs (2.12)CRRM 7.5, vc 1 f N1 60cs (2.13)A number of alternative approaches have been used to account for the effects of fines (FC and finesplasticity) on CPT-based liquefaction triggering correlations. Some frameworks utilize the CPT tip andsleeve friction ratio measurements (e.g., Robertson and Wride 1997, Moss et al. 2006) and someemphasized independent specification of fines characteristics (e.g., Idriss and Boulanger 2008). Thisaspect is discussed further in Section 2.3Important attributes of a liquefaction analysis procedureA liquefaction analysis procedure within the above stress-based framework ideally has the following twoattributes: The liquefaction analysis procedure is applicable to the full range of conditions important to practice;e.g., shallow lateral spreads, settlement of structures, stability failures or deformations in levees orearth dams. Practice often results in the need to extrapolate outside the range of the case historyexperiences, requiring the framework to be supported by sound experimental and theoretical bases forguiding such extrapolations. The functional relationships used to describe fundamental aspects of soil behavior and site responseare consistent with those used in developing companion correlations for the other in-situ tests; e.g.,SPT blow count, CPT penetration resistance, and shear wave velocity, Vs. Consistency in thesefunctional relationships facilitates the logical integration of information from multiple sources andprovides a rational basis for the calibration of constitutive models for use in nonlinear dynamicanalyses.The stress-based liquefaction analysis framework for cohesionless soil includes four functions, orrelationships, that describe fundamental aspects of dynamic site response, penetration resistance, and soilcharacteristics and behavior. These four functions, along with the major factors affecting each, are: rd f(depth; earthquake and ground motion characteristics; dynamic soil properties)7
CN f( 'v; DR; FC)K f( 'v; DR; FC)MSF f(earthquake and ground motion characteristics; DR; FC)These functions are best developed using a synthesis of empirical, experimental and theoretical methods,as ultimately the robustness of these functions is important for guiding the application of the resultingcorrelations to conditions that are not well-represented in the case history database.Statistical analyses and regression methods are valuable tools for examining liquefaction analysismethods and testing different hypotheses, but the functional relationships in the statistical models must beconstrained and guided by available experimental data and theoretical considerations. In the case ofliquefaction triggering correlations, the use of regression models alone to derive physical relationships isnot considered adequate because: (1) the case history data are generally not sufficient to constrain thedevelopment of such relationships, as illustrated later in this report; (2) any such relationship will bedependent on the assumed forms for the other functions, given their shared dependencies on factors suchas depth, soil characteristics, and ground motion characteristics; and (3) the use of regression to definefunctions describing fundamental behaviors does not necessarily produce a function that can be reliablyused in extending the resulting correlation to conditions not well represented in the database, such as largedepths.Liquefaction triggering correlations should only be used with the same liquefaction analysis framework(and all its components) that was used to develop the correlation from the case history database.Differences in the functional components (e.g., rd, CN, K , MSF) used by different model developers mayor may not be large in different situations, such that changing a model component may or may not have asignificant effect on the resulting triggering correlation. Such cases are difficult to generalize, however,and thus it is proper and prudent that correlations only be used with the same analysis framework used todevelop them.2.2.Shear stress reduction coefficient, rdIdriss (1999), in extending the work of Golesorkhi (1989), performed several hundred parametric siteresponse analyses and concluded that, for the purpose of developing liquefaction evaluation procedures,the parameter rd could be expressed as,rd exp ( z ) ( z ) M (2.14a) z 5.133 11.73 z ( z ) 0.106 0.118sin 5.142 11.28 ( z ) 1.012 1.126sin (2.14b)(2.14c)where z depth below the ground surface in meters and the arguments inside the sin terms are in radians.Details regarding the soil profiles and input motions used in developing these equations are summarizedby Idriss and Boulanger (2010). The resulting variations of rd with depth and magnitude are shown inFigure 2.1.8
Figure 2.1. Shear stress reduction factor, rd, relationshipOther rd relationships have been proposed, including the probabilistic relationships by Cetin et al. (2004)and Kishida et al. (2009b). The latter two relationships were based on large numbers of site responseanalyses for different site conditions and ground motions, and include the effects of a site's average shearwave velocity over a specified depth and the level of shaking. Idriss and Boulanger (2010) comparedthese alternative rd relationships and showed that their use in interpreting the SPT liquefaction casehistory database would produce relatively small differences in the derived triggering correlation; note,however, that the differences can be important for evaluations in practice when extrapolating to depthsgreater than covered by the database (about 10 or 12 m).Liquefaction evaluations for depths greater than about 10 m can often benefit from site response analysesto estimate the earthquake-induced cyclic stress ratios because the uncertainty in rd becomes large at thesedepths. It must be recognized, however, that a high quality site response analysis requires sufficientsubsurface characterization of the site (including shear wave velocity measurements) and must accountfor variability in the possible input motions (e.g., seven or more time series consistent with the seismichazard, source characteristics, and other intensity measures of importance to the project).The extension of these rd relationships to large magnitude subduction zone events has not beenextensively studied. This extension of rd relationships is currently being evaluated utilizing recordingsfrom the 2011 M 9.0 Tohoku earthquake.2.3Overburden correction factor, CNThe CN relationship used was initially developed by Boulanger (2003b) based on: (1) a re-examination ofpublished SPT calibration chamber test data covering 'v of 0.7 to 5.4 atm (Marcuson and Bieganousky1977a, 1977b); and (2) results of analyses for 'v of 0.2 to 20 atm using the cone penetration theory ofSalgado et al. (1997a, 1997b) which was shown to produce good agreement with a database of over 400CPT calibration chamber tests with 'v up to 7 atm. Idriss and Boulanger (2003, 2008) subsequently9
recommended that the DR-dependence of the CN relationship could be expressed in terms of qc1Ncs or(N1)60cs as follows:m P CN a 1.7 v (2.15a)m 1.338 0.249 qc1Ncs m 0.784 0.07680.264(2.15b) N1 60cs(2.15c)with qc1Ncs limited to values between 21 and 254 and (N1)60cs values limited to values 46 for use in theseexpressions.The use of Equation 2.15a requires iteration which is easily accomplished, for example, using theautomatic iteration option in an Excel spreadsheet. The values of CN calculated using this equation arepresented in Figure 2.2a for a range of qc1Ncs and (N1)60cs values and for effective overburden stresses up to10 atm, and are compared to the Liao and Whitman (1986) relationship in Figure 2.2b for effectiveoverburden stresses up to 2 atm.The limit of 1.7 on the maximum value of CN is reached at 'v less than about 0.35 atm ( 35 kPa), whichwould correspond to a maximum depth of about 2 to 4 m, depending on the depth to the water table. Thislimit is imposed because these expressions were not derived or validated for very low effective stresses,Figure 2.2. Overburden correction factor (CN) relationship for CPT and SPT penetration resistances:(a) for v'/Pa 0 - 10, and (b) for v'/Pa 0 – 2 along with Liao and Whitman's (1986) relationship10
and the assumed functional form will otherwise produce unrealistically large CN values as the 'vapproaches zero. Limits of 1.7 to 2.0 have been recommended by various researchers when using thisfunction form (e.g., Robertson and Wride 1998, Youd et al. 2001). Other functional forms for CN producefinite values at 'v 0; e.g., CN values of 1.5 to 2.4 at 'v 0 are obtained using the relationshipsrecommended for different conditions by Skempton (1986).2.4Overburden correction factor, K The K relationship used was developed by Boulanger (2003) based on: (1) showing that the CRR for aclean reconstituted sand in the laboratory could be related to the sand's relative state parameter index, R;(2) showing that the K relationship for such clean sands could be directly derived from the CRR- Rrelationship; and (3) deriving a K relationship that was consistent with the field-based CRR-(N1)60cscorrelations from the corresponding field-based CRR- R relationships. Idriss and Boulanger (2008)recommended that the resulting K relationship be expressed in terms of the qc1Ncs or (N1)60cs values asfollows: K 1 C ln v 1.1 Pa C C (2.16a)137.3 8.27 qc1Ncs 0.264118.9 2.55 N1 60 cs 0.3(2.16b) 0.3(2.16c)The coefficient C can be limited to its maximum value of 0.3 by restricting qc1Ncs to 211 and (N1)60cs 37 for use in these expressions.The resulting relationship is plotted in Figure 2.3 for a range of qc1Ncs and (N1)60cs values. The limit of 1.1on the maximum value of K is reached at a 'v that varies with denseness of the soil; e.g., for a soil with(N1)60cs 15 or DR 57%, this limit is reached at about 0.4 atm ( 40 kPa). This limit was imposedbecause the dependence of K on 'v has not been measured or validated for very low effective stresses,and the assumed functional form is otherwise unbounded as the 'v approaches zero. The effect ofomitting the limit of 1.1 for the maximum value of K on the interpretation of SPT-based liquefactioncase histories was shown to be essentially negligible (Idriss and Boulanger 2010).The above relationships have been shown to be in reasonable agreement with an updated database oflaboratory experimental data by Montgomery et al. (2012).The K and CN relationships are particularly important in applications that require extrapolation fordepths greater than those covered by the case history database. Different combinations of these tworelationships were evaluated by Boulanger and Idriss (2012b) using the SPT test data and cyclic testresults on frozen sand samples from Duncan Dam (Pillai and Byrne 1994). The K and CN relationshipsused in the Idriss-Boulanger (2008) SPT and CPT procedures provided good agreement with the observedvariations in CRR with overburden stress for that site.11
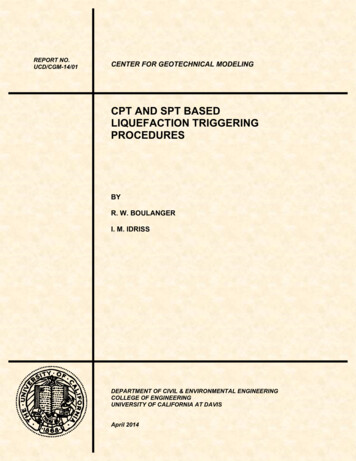
Figure 2.3. Overburden correction factor (K ) relationship2.5Magnitude scaling factor, MSFThe magnitude scaling factor (MSF) is used to account for duration effects (i.e., number and relativeamplitudes of loading cycles) on the triggering of liquefaction. The MSF relationships used by Idriss andBoulanger (2008) and revised herein were derived by combining (1) laboratory-based relationshipsbetween the CRR and the number of equivalent uniform loading cycles, and (2) correlations of thenumber of equivalent uniform loading cycles with earthquake magnitude. The development of the MSFrelationship used herein is described in detail in Appendix A. The following provides a brief summary ofthe MSF relationships used by Idriss and Boulanger (2008), followed by a summary of the new MSFrelationship.The MSF for sands used by Idriss and Boulanger (2008) was developed by Idriss (1999), who derived thefollowing relationship: M MSF 6.9 exp 0.058 1.8 4 (2.17)This relationship is plotted in Figure 2.4. An upper limit for the MSF is assigned to very-small-magnitudeearthquakes for which a single peak stress can dominate the entire time series. The value of 1.8 isobtained by considering the time series of stress induced by a small magnitude earthquake to bedominated by single pulse of stress (i.e., ½ to 1 full cycle, depending on its symmetry), with all otherstress cycles being sufficiently small to neglect. This aspect of the MSF relationship is discussed furtherin Appendix A.12
3Seed & Idriss (1982)Magnitude scaling factor, MSFTokimatsu & Yoshimi (1983)Ambraseys (1985)Arango (1996)Cetin et al (2004)2Idriss (1999) M MSF 6.9 exp 0.058 4 1056789Earthquake moment magnitude, MFigure 2.4. Magnitude scaling factor (MSF) relationshipThe MSF for clays used by Idriss and Boulanger (2008) was developed by Boulanger and Idriss (2007)and is shown in Figure 2.5. This relationship is much flatter (less dependency on number of cycles and,hence, M) than for sands, which reflects the differences in the slopes of the cyclic strength versus numberof cycles curves obtained for these soil types.The MSF relationships used by Idriss and Boulanger (2008) for sands or clays, as shown in Figure 2.5,can be rewritten in a more general form as, MMSF 6.9 exp w 0.0584 MSF 1.8 MMSF 1.12 exp w 0.8284 MSF 1.13Figure 2.5. MSF relationships for clay and sand (Boulanger and Idriss 2007)13
MSF 1 MSFmax M 7.5 exp 4 exp 4 1 5.25 7.5 exp 4 exp 4 (2.18)where MSFmax 1.8 for sand and MSFmax 1.09 for clay and plastic silt. With the fixed terms expressednumerically, the above equation becomes, M MSF 1 MSFmax 1 8.64 ex
The Cone Penetration Test (CPT) and Standard Penetration Test (SPT) are the two most widely used indices for evaluating the liquefaction characteristics of soils. The SPT was used first in developing liquefaction correlations but the CPT has a number of advantages that have made it the primary site characterization tool in certain geologic .