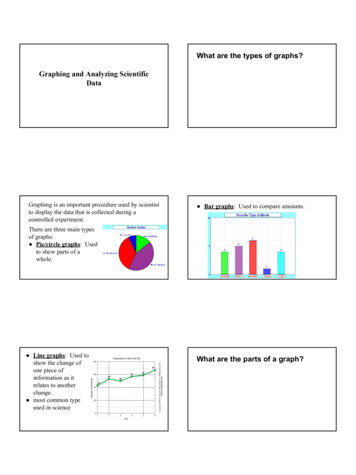
Transcription
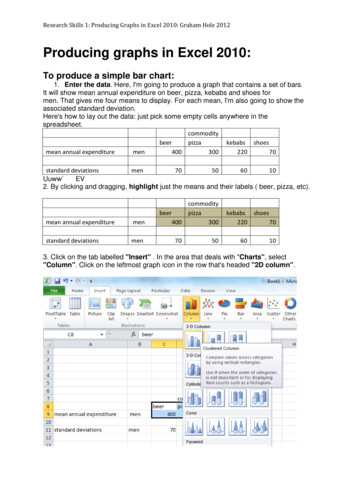
Research Skills 1: Producing Graphs in Excel 2010: Graham Hole 2012Producing graphs in Excel 2010:To produce a simple bar chart:1. Enter the data. Here, I'm going to produce a graph that contains a set of bars.It will show mean annual expenditure on beer, pizza, kebabs and shoes formen. That gives me four means to display. For each mean, I'm also going to show theassociated standard deviation.Here's how to lay out the data: just pick some empty cells anywhere in thespreadsheet.commoditybeerpizzakebabs shoesmean annual expendituremen40030022070standard deviationsmen70506010Uuww EV2. By clicking and dragging, highlight just the means and their labels ( beer, pizza, etc).mean annual expendituremenstandard deviationsmencommoditybeerpizza4003007050kebabs shoes2207060103. Click on the tab labelled "Insert" . In the area that deals with "Charts", select"Column". Click on the leftmost graph icon in the row that's headed "2D column".
Research Skills 1: Producing Graphs in Excel 2010: Graham Hole 2012This is the graph you should absshoesTo add the standard deviation to each mean:Click once on the chart to select the whole thing (make sure you don't click on theinner part of the chart because that will select just the axes and bars). The tabs atthe top will change to show "Chart tools". Select the "Layout" tab.Click on "Error Bars", and then click on "More Error Bars Options." at the bottom.
Research Skills 1: Producing Graphs in Excel 2010: Graham Hole 2012A new dialog box appears, called "Format Error Bars". Most of the time, the defaultvalues in this dialog box are fine. We want a vertical error bar on each bar of thegraph, to show the mean plus and minus one standard deviation. So we want the"direction" of the error bars to be "both", and the "End Style" to be "Cap", as they areby default. However, when it comes to specifying the length of the bars, underthe heading "Error Amount", IGNORE the "Standard deviation" and "StandardError" options - these will NOT produce the correct error bars! Follow thisprocedure instead.
Research Skills 1: Producing Graphs in Excel 2010: Graham Hole 2012(a) Click on "custom", then click on "Specify Value". A dialog box labelled "CustomError Bars" will appear.
Research Skills 1: Producing Graphs in Excel 2010: Graham Hole 2012(b) Click on the box underneath "Positive Error Value", to select it. (You may needto drag the "Format Error Bars" dialog box out of the way of your data before doingthis). Click and drag on the cells that contain the standard deviations for the men.Then click on the box underneath "Negative Error Value" to select it, and then clickand drag on the same range of cells that you just entered into the "Positive ErrorValue" box.Essentially you are telling Excel exactly how to draw the error bars. You want eachone to be a particular mean plus and minus its associated standard deviation. Excelremembers the range of cells that contain the means for the men, so by entering therange of cells that contain the men's standard deviation values into the "Positiveerror value" and "Negative error value" boxes, you are supplying Excel with thevalues that it will need to add and subtract from each mean in order to produce thecorrect error bars.
Research Skills 1: Producing Graphs in Excel 2010: Graham Hole 2012This is what the graph will now look akebabsshoesNote that each error bar is different - that's because the standard deviation for eachbar is different. (If you try to use the "standard deviation" or "standard error" optionsin the "Format Error Bars" dialog box, you will end up with the same size error bar onevery bar in a series, which is not what is wanted!)If you want to include standard errors instead of standard deviations, use exactly thesame procedure but replace the spreadsheet cells containing the standarddeviations with cells containing standard errors.Here are my standard deviations, as used above:standard deviationsmen70506010Let's suppose that I had ten men in this study. The standard errorconsists of the standard deviation divided by the square root of the number ofparticipants.In Excel, the formula for working out a standard error from a standard deviation is: xx/SQRT(10)where xx is the location of the cell containing the standard deviation.In my particular spreadsheet, cell C11 contains the standard deviation for the men'smean expenditure on beer. So somewhere else in the spreadsheet, I click on anempty cell and type " C11/SQRT(10"), and Excel will enter 22.13594 into that cell (thevalue of the standard error).Standard errorsmen22.13594 15.8113883 18.97367 3.162278Don't forget to make your graph conform to APA format. Click on the graph, andthese options will appear on the "Layout" tab. Some options can also be accessedby right-clicking on the graph itself.
Research Skills 1: Producing Graphs in Excel 2010: Graham Hole 2012Mean annual expenditiure ( /- 1 SD)This is what the finished graph should look shoesCommodityTo produce a more complicated bar chart:1. Enter the data. Here, I'm going to produce a graph that contains two sets of bars.One set will show mean annual expenditure on beer, pizza, kebabs and shoes formen. The other set will show the same data for women. That gives me eight meansto display. For each mean, I'm also going to show the associated standard deviation.Here's how to lay out the data: just pick some empty cells anywhere in thespreadsheet.mean annual expendituremenwomenstandard 1005060kebabs shoes2207030200603010502. By clicking and dragging, highlight just the means and their labels (men, women,beer, pizza, etc).mean annual expendituremenwomenstandard 1005060kebabs shoes2207030200603010503. Click on the tab labelled "Insert" . In the area that deals with "Charts", select"Column". Click on the leftmost graph icon in the row that's headed "2D column".
Research Skills 1: Producing Graphs in Excel 2010: Graham Hole 2012This is the graph you should babsshoesTo add the standard deviation to each mean:Click once on the chart to select the whole thing (make sure you don't click on theinner part of the chart because that will select just the axes and bars). The tabs atthe top will change to show "Chart tools". Select the "Layout" tab.Click on "Error Bars", and then click on "More Error Bars Options." at thebottom.The following dialog box pops up:We have two "series" of data here, one series of means for men and one series forwomen. Click on "OK" to select the "men" series to begin with.Follow the same procedure as before:a) Click on "custom", then click on "Specify Value". A dialog box labelled "CustomError Bars" will appear.(b) Click on the box underneath "Positive Error Value", to select it.Click and drag on the cells that contain the standard deviations for the men.
Research Skills 1: Producing Graphs in Excel 2010: Graham Hole 2012Then click on the box underneath "Negative Error Value" to select it, and then clickand drag on the same range of cells that you just entered into the "Positive ErrorValue" box.This is what the graph will now look zakebabsshoesHaving finished with the men's data, simply repeat the whole process to add thewomen's error bars. Go back to the "Error Bars" icon on the far right of the top strip,and repeat the whole process but using the cells containing the women's datainstead.Your final graph should look like zakebabsshoes
Research Skills 1: Producing Graphs in Excel 2010: Graham Hole 2012Let's suppose that I had ten men and ten women in this study. Have a go at working outthe standard error for women using the same formula as before. You should get thesevalues:Standard errorsmenwomen22.13594 15.81139 18.97367 3.16227831.62278 18.97367 9.486833 15.81139Mean annual expenditure ( /- 1 SEM)Have a go at making a figure that conforms to APA format, with error bars containing thestandard error. Your graph should end up looking like ebabsCommodityshoes
Research Skills 1: Producing Graphs in Excel 2010: Graham Hole 2012 Producing graphs in Excel 2010: To produce a simple bar chart: 1. Enter the data. Here, I'm going to produce a graph that contains aset of bars. It will show mean annual expenditure on beer, pizza, kebabs and shoes for men. That gives me four means to display.