Transcription
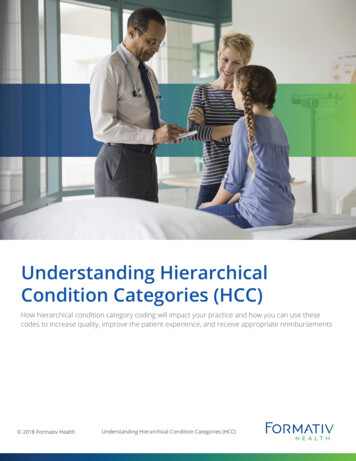
Findings BriefNC Rural Health Research ProgramJuly 2018Average Beneficiary CMS Hierarchical Condition Category(HCC) Risk Scores for Rural and Urban ProvidersAbby F. Hoffman; Kristin L. Reiter, PhD; Randy K. Randolph, MPPWhat are HCC Risk Scores?In some payment models, payers reimburse providers a flat rate per patient (capitation), and in others, payers assesspenalties or provide bonuses based on cost or quality of care outcomes (pay-for-performance). In such payment models,risk adjustment is important. Risk adjustment mechanisms predict whether a given patient, or group of patients, is likelyto be more or less costly to treat than the average population and provides a way to adjust payment accordingly. Riskadjustment compensates health plans and providers for treating sicker patients, and reduces their incentives to selecthealthy or less costly patients.KEY FINDINGS Rural providers serve Medicarebeneficiaries with lower averageCMS-HCC risk scores than urbanproviders—1.43 compared to 1.75,respectively. Lower risk scoressuggest relatively better health andlower expected cost. Average CMS-HCC risk scores arelower for rural providers than theyare for urban providers acrossmultiple provider characteristicsincluding specialty, geographicregion, and eligibility to participatein value-based payment. Lower average CMS-HCC risk scoresof beneficiaries served by ruralproviders is contrary to extensiveprevious research that shows ruralare less healthy than urbanpopulations. Future studies willexplore potential drivers of theserisk score differences, includingvariation in coding practices.In 2004, to adjust capitated payments for Medicare Advantage (MA),or Medicare Part C, the Centers for Medicare & Medicaid Services(CMS) modified a previously developed risk adjustment model.1 Thisnew model uses hierarchical condition categories (HCCs), along withdemographic information, to predict a beneficiary’s expectedMedicare spending in the next year compared to the average expectedspending for the entire Medicare population through an associatedrisk score. The risk adjustment model incorporates the health risk ofbeneficiaries by using multiple factors that influence health. Thesefactors include the beneficiary’s age; sex; eligibility for Medicaid;initial reason for Medicare qualification; residence in an institutionsuch as a long-term care facility; and the diagnoses assigned to thebeneficiary in inpatient, outpatient and office-based settings during abase year.2Diagnoses are classified into approximately 70 disease HCCs. TheHCCs group related diseases and, within each disease, rank differentmanifestations by severity to reflect expected differences in treatment,and therefore cost. For example, a beneficiary that is assignedmultiple diagnosis codes that fall within a single disease category,such as diabetes, would be assigned only one HCC for diabetes thatreflects the highest level of diabetes severity experienced by thebeneficiary. However, if that beneficiary also had an unrelateddisease, such as a head injury, (s)he would receive a second HCC sothat cost estimates reflect increments for each disease.3The CMS-HCC risk score for a beneficiary is the sum of the score orweight attributed to each of the demographic factors and HCCs withinthe model. The CMS-HCC model is normalized to 1.0. Beneficiarieswould be considered relatively healthy, and therefore less costly, witha risk score less than 1.0.Why Do HCC Risk Scores Matter?Risk scores matter because they affect payment. Initially, the CMS-HCC risk adjustment model was used solely toadjust capitated payments to MA plans.2 However, since 2004, its use has expanded to other Medicare paymentprograms, including those for smaller groups of physicians. HCCs are incorporated throughout the Medicare Access andCHIP Reauthorization Act (MACRA) of 2015 payment mechanisms, which are designed to push traditional Medicaretoward performance-based payment. These payment mechanisms began with the interim Value-Based PaymentModifier as part of the Medicare Physician and Other Health Professional Payment System4 (2015-2018). This1
payment system will be consolidated with other quality-incentive programs and replaced by the Merit-based IncentivePayment System (MIPS) of the Quality Payment Program (QPP) in 2019. The QPP requires providers to join either theMIPS or a qualified Advanced Alternative Payment Model (APM), both of which incorporate HCC risk adjustment (seeAppendix A for details).5The goal of risk adjustment is to appropriately reimburse for intensive health care interventions and reduce barriers totreating patients needing complicated treatment. However, if CMS-HCC risk scores do not accurately reflect patienthealth status because of factors such as coding practices6 or capacity, then payments may not be associated with the truecost of treatment. Existing evidence suggests that there may be cause for concern. Rural populations experience worsehealth outcomes than their urban counterparts based on metrics such as mortality,7,8 activity limitations due to chronicconditions, and having a diagnosable severe mental illness.9 By contrast, rural Medicare beneficiaries have lower averageCMS-HCC risk scores than urban beneficiaries,10 suggesting that rural beneficiaries are healthier and less costly.Additionally, preliminary analyses suggest that smaller physician practices, which are disproportionately located in ruralareas,11 have the lowest average CMS-HCC risk scores.12 On the other hand, rural Medicare beneficiaries are youngerthan urban beneficiaries,13 and it may be the case that patients with more complexity systematically seek care in urbanareas. To further investigate potential differences in urban and rural CMS-HCC risk scores at the provider’s patient panellevel, we used the 2015 Medicare Physician and Other Supplier Public Use File,14,15 to compare patient panel CMS-HCCrisk scores between urban and rural providers across provider specialties, census divisions, and MIPS participationrequirements.METHODSData regarding the CMS-HCC risk scores and providers were obtained from the 2015 Medicare Physician and OtherSupplier Public Use File.15 This is the most recent available version of this file. The data in this report came from aportion of the file that aggregates Medicare fee-for-service beneficiary administrative data to the provider level.15 Thefile also incorporates provider location and specialty from the National Plan & Provider Enumeration System. CMSHCC risk scores in this file represent the average risk score of the Medicare beneficiaries seen by the provider. Becausethe payment and risk score data are aggregated to the physician level based on Medicare claims, a single beneficiary canbe included in the patient panel of more than one provider. Detailed provider specialty categories were aggregated usingthe method from the Medicare Data on Provider Practice and Specialty User Documentation.16 Providers were assignedto rural versus urban locations by geocoding17 the street address provided in the Public Use File and the definition ofrural from the Federal Office of Rural Health Policy, which includes nonmetropolitan counties and areas of metropolitancounties with Rural-Urban Commuting Area (RUCA) codes of 4 or greater. Using MIPS years 1 and 2 eligibility criteria,we determined which providers were likely to participate in MIPS based on the provider type, the number of uniqueMedicare beneficiaries, and Medicare’s allowed charge amount per provider (see Appendix B for details).We excluded all providers not within the 50 U.S. states or the District of Columbia (6,189); any providers that do notparticipate in Medicare (837); any organizational, rather than individual, NPIs (61,794); and observations where ruralstatus could not be determined (87). Because CMS-HCC risk scores are calculated at the individual beneficiary level andaggregated at the provider level, we weighted the averages depicted in Figures 1 and 2 by the number of uniquebeneficiaries in each provider’s patient panel.RESULTSTable 1 shows descriptive data on all individual providers that met the stated eligibility criteria for the first year of MIPSbased on measures available in the public use file. Providers practicing in rural locations treat beneficiaries with a loweraverage CMS-HCC risk score as compared to providers practicing in urban locations, and the difference is statisticallysignificant (average CMS-HCC risk score of 1.43 for rural vs. 1.75 for urban). Rural providers also have smaller patientpanels on average: 535 vs. 568 unique Medicare beneficiaries per provider. A larger percentage of rural providers areprimary care (33.0% vs. 25.4%) or non-physician practitioners like physician assistants or nurse practitioners (28.5% vs.15.3%) as compared to urban providers. By contrast, a larger percentage of urban providers are hospital-based (21.9% vs.13.8%) or medical specialties (19.3% vs. 9.0%) as compared to rural providers. The distribution of rural and urbanproviders varies by census division. For example, 12.2 percent of urban providers are located in the Pacific divisionwhile only 6.0 percent of rural providers are located in this same division. Conversely, 14.2 percent of rural providers arelocated in the East South Central division as compared to 5.4 percent of urban providers.2
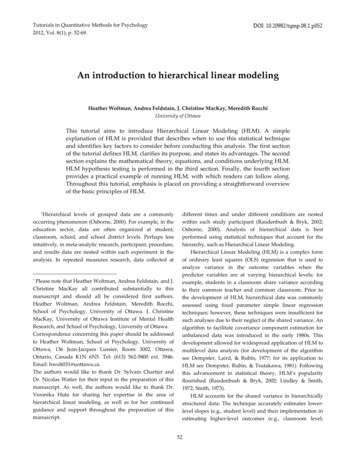
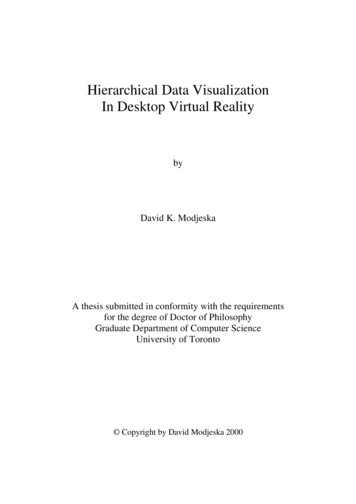
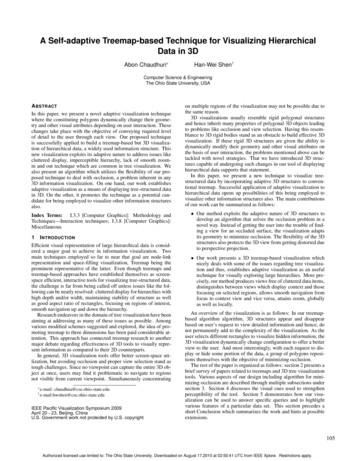
Table 1: Average CMS-HCC Risk Score, Specialty and Census Division: Rural Versus Urban Providers, 2015VariableRuralUrbanNumber of Providers59,270449,284Average CMS-HCC Risk Score of Beneficiaries, mean (SD)1.43 (0.50)1.75 (0.76) 0.001Number of Medicare Beneficiaries, mean (SD)535 (590.29)568 (705.24) 0.001Hospital-based8,189 (13.8%)98,573 (21.9%)Medical specialty5,349 (9.0%)86,882 (19.3%)Non-physician16,894 (28.5%)68,533 (15.3%)Obstetrics-Gynecology539 (0.9%)4,451 (1.0%)Other12 ( 1%)189 ( 1%)Primary care19,570 (33.0%)114,202 (25.4%)Psychiatry816 (1.4%)7,743 (1.7%)Surgery specialty7,892 (13.3%)68,681 (15.3%)New England3,528 (6.0%)29,338 (6.5%)Mid Atlantic4,705 (7.9%)73,509 (16.4%)East North Central10,711 (18.1%)70,304 (15.6%)West North Central7,393 (12.5%)27,999 (6.2%)South Atlantic10,232 (17.3%)96,746 (21.5%)East South Central8,396 (14.2%)24,461 (5.4%)West South Central6,473 (10.9%)45,000 (10.0%)Mountain4,259 (7.2%)26,965 (6.0%)Pacific3,573 (6.0%)54,962 (12.2%)Providers by BroadSpecialty GroupProviders byCensus DivisionValueP-value 0.001 0.001P-values less than or equal to 0.05 are statistically significant. Provider categories were aggregated using MedicareData on Provider Practice and Specialty User Documentation. “Other” provider types include those identified asmultispecialty clinics/group practices and unknown physician specialty.Rural-Urban Differences in Average CMS-HCC Risk Scores by Provider SpecialtyFigure 1 shows that, for each provider specialty grouping, rural providers serve panels of beneficiaries with loweraverage CMS-HCC risk scores as compared to their urban counterparts. The largest differences are found for nonphysician providers (1.31 for rural providers vs. 1.62 for urban providers) and medical specialties (1.66 for rural vs.1.93 for urban). The smallest differences are in obstetrics-gynecology (0.97 for rural vs. 1.03 for urban) and surgeryspecialties (1.30 for rural vs. 1.43 for urban). Beneficiary average CMS-HCC risk scores also vary by providerspecialty: Medical specialties serve patient panels with the highest average CMS-HCC risk scores, and providers inobstetrics-gynecology serve those with the lowest average CMS-HCC risk scores.3
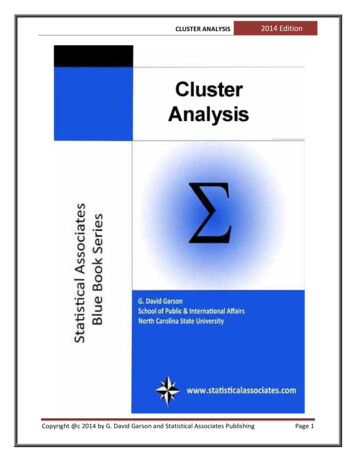
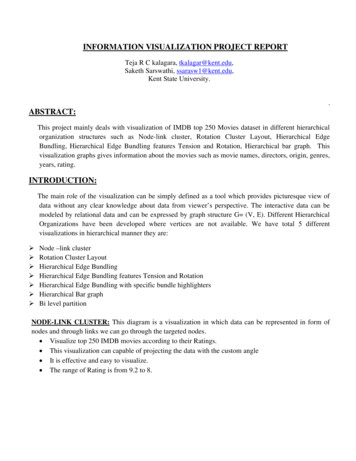
Figure 1: Average CMS-HCC Risk Scores by Specialty: Rural Versus Urban Providers, 2015Urban21.81.61.41.210.80.60.40.20Higher riskLower riskAverage Provider-level csGynecologyRural-Urban Differences in CMS-HCC Risk Scores by Census DivisionFigure 2 shows that in every census division, rural providers serve patient panels that have lower average CMS-HCCrisk scores than urban providers. The lowest average CMS-HCC risk scores for both urban and rural providers are foundin the Mountain division (1.59 and 1.28, respectively). Rural providers serving patient panels with the highest averageCMS-HCC risk scores are in the South Atlantic division (1.54) while urban providers serving patient panels with thehighest risk scores are in the West South Central division (1.84).Figure 2: Average CMS-HCC Risk Scores by Census Division: Rural Versus Urban Providers, 2015Urban21.81.61.41.210.80.60.40.20Higher riskLower riskAverage Provider-level HCCRuralNewEnglandMidAtlanticEast North West North SouthCentralCentralAtlantic4East South West South MountainCentralCentralPacific
Rural-Urban Differences in CMS-HCC Risk Scores by Various MIPS Inclusion CriteriaIn an attempt to avoid an unfair disadvantage to practices unable to successfully participate in quality-based payment,Medicare exempted certain provider types and practice sizes from MIPS (see Appendix B). However, over time, theprovider type and size exemptions change. Table 2 shows average CMS-HCC risk scores for rural and urban providersusing the various MIPS inclusion rules.5 The definitions in the table are organized from the most inclusive to the leastinclusive. Row one of the table shows all of the proposed provider types eligible in MIPS Years 3 18 with no sizerestrictions; the average CMS-HCC risk score is 1.35 for rural provider panels, compared to 1.63 for urban. Row twoexcludes the provider types expected to be eligible in years 3 , only including those provider types eligible in the firstyear, again with no size restrictions. The average CMS-HCC risk score increases slightly for rural (1.35 to 1.37) and forurban (1.63 to 1.67) providers. Using only the Year 1 eligible provider types and imposing size restrictions that removethe smallest providers (row 3) increases the CMS-HCC risk scores in both rural (1.37 to 1.43) and urban (1.67 to 1.75)provider panels, and the rural-urban difference remains.19 Excluding additional small providers using the 2018performance year size criteria20 (row 4) only slightly increases the average CMS-HCC risk score for both rural (1.43 to1.49) and urban (1.75 to 1.78) providers, and the rural-urban gap is maintained. Providers who would be excludedbased on new size restrictions implemented in year 2 serve patient panels with slightly lower risk scores in both rural(1.38) and urban (1.71) locations as compared to those that were excluded based on year 1 size restrictions.Table 2: CMS-HCC scores by MIPS definitions, 2015RuralMeanHCCMIPS Inclusion rofProvidersMIPS Providers Year 3 1.35319114,7761.63342835,388MIPS Year 1 1.75568449,284MIPS Year 1 Providers; Year 2 Size1.4977329,8661.78812240,796MIPS Year 1 Providers; Year 1 Size,not Year 21.3829429,4041.71285208,488MIPS Year 1 Providers; Year 1 Size(Study sample from previous analyses)CONCLUSIONSProviders in rural areas serve Medicare patient panels with lower average CMS-HCC risk scores than their urbancounterparts, despite previous research demonstrating that rural populations are sicker than urban populations.7,8,9 TheCMS-HCC risk score differential holds across provider specialties, census divisions, and all groups of providers that arelikely to be required to participate in MIPS. In future studies, we will begin to explore some potential drivers of theserisk score differences. For example, we will investigate whether the HCCs that contribute to the risk scores differamong rural and urban beneficiaries, and whether there are differences in the numbers and types of claims perbeneficiary, or in the number of diagnosis codes assigned to each claim. Evaluating possible non-health related driversof CMS-HCC risk scores, such as those that might arise due to variations in coding practices, will contribute tounderstanding the extent to which the CMS-HCC risk adjustment model is achieving the desired goal of adjustingpayments to reflect expected costs. As policy-makers consider how to risk adjust payments under MIPS and otheralternative payment models—or even more broadly in Medicare Advantage and other payment models that affect postacute care providers21 and hospitals22—it will be important to consider the implications for rural providers.5
REFERENCES AND 19.20.21.22.Diagnostic cost group Medicare HCC model based on encounter data developed for CMS by contracted researchers/consultants.Pope G, Kautter J, Ellis R, Arlene A, et al. Risk Adjustment of Medicare Capitation Payments Using the CMS-HCC Model.Health Care Finance Review 2004;25(4):119-141. Available at: s/04summerpg119.pdf. Accessed April 10, 2018.Pope G, Kautter J, Ingber M, Freeman S, et al. Evaluation of the CMS-HCC Risk Adjustment Model (March 2011). ResearchTriangle Institute International. Available at: AdvtgSpecRateStats/downloads/Evaluation Risk Adj Model 2011.pdf. Accessed April 10, 2018.Detailed Methodology for the 2017 Value Modifier and the 2015 Resource Use Report (March 2017). CMS. Available at: 015-Quality-and-Resource-Use-Report-.pdf. Accessed April 10, 2018.CMS. Medicare Program; CY 2018 Updates to the Quality Payment Program; and Quality Payment Program: Extreme andUncontrollable Circumstance Policy for the Transition Year. Rules and Regulations, Federal Register November 16, 2017;82(220):53568-54229. Available at: ogram-extreme. Accessed January 15, 2018.Song Y, Skinner J, Bynum J, Sutherland J, Wennberg JE, Fisher ES. Regional Variations in Diagnostic Practices. New EnglandJournal of Medicine 2010;363(1):45-53. Available at: 1.Leading Causes of Death in Nonmetropolitan and Metropolitan Areas - United States, 1999-2014 (January 2017). Centers forDisease Control and Prevention. Available at: m. Accessed April 10, 2018.Hoffman A, Holmes M. Regional Differences in Urban and Rural Mortality Trends (August 2017). NC Rural Health Research andPolicy Analysis Center. University of North Carolina at Chapel Hill. Available at: 127. Accessed April 10, 2018.Meit M, Knudson A, Gilbert T, et al. The 2014 Update of the Rural-Urban Chartbook (October 2014). NORC Walsh Center forRural Health Analysis. Available at: ook-update.pdf. Accessed April 10, 2018.Stensland J, Akamigbo A, Glass D, Zabinski D. Rural and Urban Medicare Beneficiaries use Remarkably Similar Amounts ofHealth Care Services. Health A ffairs 2013;32(11):2040-2046. Available at: 2013.0693. Accessed April 10, 2018.Liaw WR, Jetty A, Petterson SM, Peterson LE, Bazemore A. Solo and Small Practices: A Vital, Diverse Part of Primary Care.Annals of Family Medicine January/February 2016;14(1):8-15. Available at: id 8f08b48b-6193-4dbd-85ff-c4b276b1a090.CMS. Medicare Program; CY 2018 Updates to the Quality Payment Program. Proposed Rules, Federal Register June 30, 2017;82(125):30010-30500. Available at: the-quality-payment-program. Accessed August 22, 2017.MedPAC. June 2012 Report to the Congress: Medicare and the Health Care Delivery System. Chapter 5: Serving rural Medicarebeneficiaries. Medicare Payment Advisory Commission. Available at: e-2012-report-.pdf. Accessed April 10, 2018.Medicare Fee-For-Service Provider Utilization & Payment Data Physician and Other Supplier Public Use File: A MethodologicalOverview (April 7, 2014, Updated September 21, 2017). CMS. Available at: ther-Supplier-PUF-Methodology.pdf. Accessed April 10, 2018.Medicare Physician and Other Supplier Public Use File, CY2015, Tab Delimited Format (September 22, 2017). CMS. Availableat: html. Accessed April 10, 2018.Medicare Data on Provider and Practice Specialty (MD-PPAS) User Documentation (February 2017). CMS. Available at: -documentation. Accessed April 10, 2018.ESRI. StreetMap North America; DeLorme, Automotive Navigation Data road data, and Tele Atlas, First American, UNEPWCMC, USGS; May 2013.Beginning in Performance Year 3, additional provider types may be eligible, including therapists and social workers.In Performance Year 1 (2017), providers serving fewer than 100 Part B beneficiaries or with less than 30,000 in allowable part Bcharges were exempt.Beginning in performance Year 2 (2018), providers serving fewer than 200 Part B beneficiaries or with less than 90,000 inallowable part B charges are exempt.Measure Specifications: Medicare Spending Per Beneficiary—Post-Acute Care (July 2016). Acumen, LLC. Available at: its/Downloads/2016 07 20 mspb pac ltch irf snf measure specs.pdf. Accessed April 10, 2018.Yong, R. Medicare Spending Per Beneficiary Measure (June 7, 2016). Acumen, LLC. Available at: uploads/2016/06/MSPB Slides NPC 2016May19 FINALc508.pdf. Accessed April10, 2018.This study was supported by the Federal Office of Rural Health Policy (FORHP), Health Resources and Services Administration (HRSA), U.S. Departmentof Health and Human Services (HHS) under cooperative agreement # U1GRH03714. The information, conclusions and opinions expressed in this briefare those of the authors and no endorsement by FORHP, HRSA, HHS, or The University of North Carolina is intended or should be inferred.North Carolina Rural Health Research ProgramThe Cecil G. Sheps Center for Health Services ResearchThe University of North Carolina at Chapel Hill6919-966-5011 alth
Appendix A: Additional Payment Inclusion DetailHierarchical Condition Code (HCC) scores, and related risk-adjustment models, are incorporated throughout Medicare including inMedicare Advantage (MA), CMS demonstrations, and in payment updates mandated by the Medicare and CHIP Reauthorization Act(MACRA). Because the analysis in this paper is at the individual provider level, this appendix focuses on payment changes expectedto most directly affect individual providers.In 2015, MACRA added three temporary policy adjustments to the Medicare Physician and Other Health Professional PaymentSystem. One of these adjustments is called the value-based payment modifier. This value-modifier can adjust payments upward,downward, or neutrally based on a quality composite score and a cost composite score. 1 HCC scores factor into the risk adjustment ofthis model at the Tax Identification Number (TIN) level in multiple ways: In computing the cost composite measure, HCC scores are used to adjust the per capita cost for all attributed beneficiaries,2per capita costs for beneficiaries with specific conditions,3 and a risk adjustment metric based on the HCC algorithm adjuststhe Medicare spending per beneficiary.4 For the overall value-modifier, TINs that will receive an upward payment adjustment are eligible for an additional upwardadjustment if their population is in the top 25th percentile of Medicare beneficiary’s HCC scores nationwide.1The Quality Payment Program (QPP) will replace the value-based payment modifier beginning in 2019. The QPP will require mostMedicare providers to participate in the Merit-based Incentive Payment System (MIPS) or a qualified advanced alternative paymentmodel (APM). MIPS will be a point-based system that determines adjustments on final payments based on four categories: quality,cost, improvement activities, and advancing care information. 5 MIPS will incorporate risk scores in two ways, similarly to the valuebased payment modifier: Beginning in the second year of MIPS, there will be a two-part cost component. HCC scores are used to adjust the Total percapita cost6 measure, and a metric based on the HCC score will be used to adjust the Medicare spending per beneficiary 7measure. An additional cost component measure will be added in MIPS year three, the Episode-based cost measure. HCCscores will also be used to risk-adjust this metric.8 HCC scores will also be used to adjust the final number of points that a provider receives. For the first year, a clinician’s orTIN’s average HCC score will make the provider eligible for up to 3 (out of 100) points. Three points will be enough for aneutral adjustment in year 1. In year 2, the complex bonus could be up to 5 points and incorporates a dual eligibility ratio. Inyear 2, 15 points is enough for a neutral adjustment.9The qualified APMs will also incorporate HCC scores into their payment methodologies. One example of a qualified APM is aMedicare Shared Savings Program (MSSP) Accountable Care Organization that takes on downside risk. MSSPs receive bonuses (orare assessed penalties) based on their population’s spending under (or over) a benchmark. The benchmark is calculated based on ahistorical benchmark trended forward using national spending data. HCC scores are used to adjust the historical benchmark. Eachyear, as new beneficiaries are added to the MSSP, the historical benchmark is re-adjusted using these beneficiaries’ HCC scores. Forcontinuously aligned beneficiaries, the baseline is updated based on changing demographics, and can be adjusted downward, but notupward, based on a changing HCC score.101Detailed Methodology for the 2017 Value Modifier and the 2015 Resource Use Report (March 2017). Centers for Medicare & Medicaid Services.Available at: 015-Quality-and-Resource-Use-Report-.pdf.22015 Measure Information about the Per Capita Costs for All Attributed Beneficiaries Measure, Calculated for the 2017 Value-Based PaymentModifier Program (April 2016). Centers for Medicare & Medicaid Services. Available at: -TPCC-MIF.pdf.32015 Measure Information About the Four Per Capita Costs for Beneficiaries with Specific Conditions Measures, Calculated for the 2017 ValueBased Payment Modifier (March 2017). Centers for Medicare & Medicaid Services. Available at: -CSTPCC-MIF.pdf.4Measure Information about Medicare Spending Per Beneficiary, Calculated for the 2017 Value Modifier and 2015 Annual QRURs (July 2016).Centers for Medicare & Medicaid Services. Available at: 7-MSPBM-MIF.pdf.52018 Merit-Based Incentive Program (MIPS) Cost Performance Category Fact Sheet (March 2018). Centers for Medicare & Medicaid Services.Available at: -Fact-Sheet.pdf.6Merit-Based Incentive Payment System: Total Per Capita Costs for All Attributed Beneficiaries (December 2017). Centers for Medicare &Medicaid Services. Available at: ed Incentive Payment System: Medicare Spending Per Beneficiary (December 2017). Centers for Medicare & Medicaid Services.Available at: ed Incentive Payment System: Episode-Based Cost Measurement Field Test Reports Frequently Asked Questions (October 2017).Centers for Medicare & Medicaid Services. Available at: .pdf.9Centers for Medicare & Medicaid Services. Medicare Program; CY 2018 Updates to the Quality Payment Program; and Quality PaymentProgram: Extreme and Uncontrollable Circumstance Policy for the Transition Year. Rules and Regulations, Federal Register November 16,2017;82(220):53568-54229. Available at: ogram-extreme. Accessed January 15, 2018.10Medicare Shared Savings Program: Shared Savings and Losses and Assignment Methodology (November 2017). Centers for Medicare &Medicaid Services. Available at: avings-Losses-Assignment-Spec-V4.pdf.7
Appendix B: Provider Types Included for MIPS Year 1 and MIPS Years 3 , 2015Provider TypeMIPS Y1MIPS Y3 Provider TypeMIPS Y1MIPS Y3 Addiction MedicineYYMultispecialty Cli
specialties (1.30 for rural vs. 1.43 for urban). Beneficiary average CMS-HCC risk scores also vary by provider specialty: Medical specialties serve patient panels with the highest average CMS-HCC risk scores, and providers in obstetrics-gynecology serve those with the lowest average CMS-HCC risk scores. 3 Variable Value Rural Urban P-value