Transcription
The Conversation IndexVolume 1
We’ve reached another turning point.For as long as humans have been able to communicate, we’ve been evaluating, recommendingand sharing. After thousands of years of word of mouth, these conversations began to take placeonline, where it is now digitally archived.Naturally, smart businesses got hungry. Here was a chance to capture what their customers — realpeople actually using their products and services – were saying about them. But, as has happenedso many times before, technology eventually outpaced our capacity to truly understand its impact.To companies that were hungry for social data, suddenly it seemed there was simply too much of it.Navigating the flood of social content and arriving at meaningful insights about customers becamea challenge — and still is — for many businesses.Social data isn’t slowing down, but we’re now able to get ahead of it, to make sense of it.We’ve arrived at a turning point at which social data can be captured, analyzed—and mostimportantly, acted upon—to drive true, customer-centric change across companies, and evenentire industries.But this report isn’t about social data. It’s about the people behind the data. We’re excited toshare with you what we’ve learned about them from the hundreds of billions of conversationsour technologies have been a part of.The Conversation Index you’re about to read is the first of many to come. Now, on to the insights Best,Erin Nelson (@erinclaire)Chief Marketing Officer, Bazaarvoice
Table of ContentsThe Conversation Index .2Consumer language reflects economic uncertainty .5All over the map: sentiment by region, country .6The Friday Facebook flood . 10Women fuel word of mouth . 12Controlling spending, leading conversations . 14Summer warms traveler sentiment . 18Poor service destroys product sentiment . 21One in five spread the love .22Pivot language reveals product opportunities .25As price and complexity increase, consumer .26UGC served at 3 kilohertz, volume soars .30Conclusion .32Citations .34About Bazaarvoice .35
The Conversation IndexBrands that lead, capture, and analyze customer conversationsdevelop a deeper understanding of what they must do to meetand exceed expectations and become truly customer-centricenterprises. In The Conversation Index, you’ll find the latestand most actionable customer insights, drawn from millions ofcustomer conversations.The substance of these conversations is user-generated content(UGC), an insight-rich form of social data that enables analysis atevery level of focus—from global consumer trends, to productand customer-specific sentiment, and all degrees of granularityin between.In serving over 220 billion pieces of UGC (and counting),Bazaarvoice has collected massive amounts of social data forhundreds of top brands across industries. From this pool of socialdata, our Social Analytics team has extracted select findings tobe featured in this report.The findings in this report are aggregated based on a 5 milliondata point sample of UGC indexed in Q2-2011 (April–June), fromconsumers in 210 countries around the world.2Our analysis reveals the following key takeaways:The way consumers talk about products changesduring economic downturns.Distinctions between offsite, onsite, and siloed channels arecrumbling, but some still exist. Onsite and offsite consumerbehavior is largely similar in some areas, but Facebookbehavior is unique.Those who control spending in a product category lead theonline conversation about that category.Product quality and interactions with brand representativesare inseparable in the minds of many consumers—poorcustomer service is the product sentiment killer.Innovative product improvement ideas, as well as flaws, canbe found just as readily in positive reviews as in negativereviews by searching for pivot language.Consumers seek facts and details, not opinions andsubjective comparisons, when the price and complexity ofproducts and services increase.
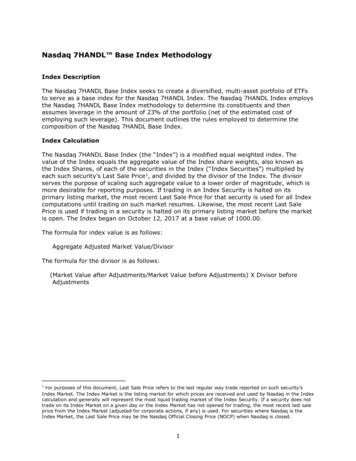
Q1 2009: Highest number of reviews mentionprice when Dow and CCI at lowest points.Dow Jones 120 Index60 10K4014% Pricereferences12%10%8%6%9K4%8K204Price reference vs. Dow Jones Industrial and Consumer Confidence IndexQ2 2011Q1 2011Q4 2010Q3 2010Q2 2010Q1 2010Q4 2009Q3 2009Q2 2009Q1 2009Q4 2008Q3 2008Q2 20080%Q1 20080 6KQ4 20072%Q3 20077K
Consumer language reflects economic uncertaintyOne in ten reviews in Q2 mentioned “price.” To understandhow economic conditions affect price sensitivity in reviews, theBazaarvoice Social Analytics team compared references to pricein customer reviews to two key economic indices around andduring the Great Recession, from July 2007 to August 2011.When comparing price references to the Consumer ConfidenceIndex, an overall correlation of -.66 was determined, meaningreviewers mention price more often when the CCI is low. TheCCI sank to its lowest point in February 2009, the same monthprice mentions hit a new high; 11.5% of all US reviews explicitlymentioned price.Mapping price references in reviews to the Dow Jones IndustrialAverage reveals an even stronger negative correlation of -.68.The pattern is nearly the same. Beginning September 2008,conversation around price skyrocketed as the Dow averagecontinued its fall. A second pattern began January 2010,continuing until October 2010, with price mentions falling as theDow average improved.During economic downturns, use UGC to promote value and easethe hesitation price-sensitivity brings. Brands should highlightreviews and answers that praise a product’s high quality for itsprice. Additionally, they should feature value-touting customercontent in online and offline advertising to reassure potentialcustomers that their money will be well spent.5
All over the map: sentiment by region, countryOverall, customers in the southwest Pacific region showed thehighest overall sentiment this quarter, followed by the NorthAsia and Europe regions.Interestingly, sentiment by country doesn’t seem to correlatewith two intuitive explanations – money and happiness.We found essentially no correlation between a country’spurchasing power and sentiment, and essentially no correlationbetween sentiment and scores on Gallup’s Global WellbeingSurvey, either.Blog: Do happier peopleleave higher product ratings?http://bv-url.com/a5r96Even geographic proximity isn’t a reliable indicator of sentiment.Moldova has the highest average rating of any country (4.54out of 5 stars), while its neighbor Ukraine has the lowest (3.31).While they share a border, the two countries are further apart inproduct sentiment than any two countries in the world,according to our data.
15 mostpositive countriesAverage ratingMoldova4.54Georgia4.52Latvia4.4515 mostnegative ed Kingdom4.34United Arab Emirates3.98New Zealand4.33Argentina3.98Puerto kraine3.31Average rating
EuropeAverage rating: 4.26North AmericaAverage rating: 4.23North AfricaAverage rating: 3.97Mexico & Central AmericaAverage rating: 4.21South AmericaAverage rating: 4.148Global average ratings by region
North AsiaAverage rating: 4.32East AsiaAverage rating: 4.09South & Southeast AsiaAverage rating: 3.95West & Central AsiaAverage rating: 4.11Sub-Saharan AfricaAverage rating: 4.16Southwest PacificAverage rating: 4.35Ratings based on a 5-star scale9
The Friday Facebook floodNearly a third (32%) of all reviews collected on Facebook in Q2were submitted on Fridays. The remaining reviews were collectedfairly evenly throughout the week.data, where 21% of reviews gathered this quarter weresubmitted on a Tuesday, the most popular day of week for thisactivity. In fact, Fridays accounted for only 11% of onsite reviewsubmissions—only Saturdays (9%) saw lower activity rates.Facebook reviewers are also moreHowever, a study of 50,000 posts from the top 14,000 pageson Facebook found that Friday posts had the highest weekdayinteraction rates2, so it’s likely that when brands invite Facebookusers to review their products, the calls to action posted onFridays are driving more review submissions than similar poststhroughout the week.positive, with a 12% higher averagesentiment for Facebook reviewsover reviews not collected on thesocial network.This Friday spike in Facebook reviews doesn’t match overallusage patterns for Facebook pages, which see the most activityon Wednesdays.1 Nor does it mirror onsite review submission10Facebook reviewers are also more positive, with a 12% higheraverage sentiment for Facebook reviews over reviews notcollected on the social network. With many of these reviewscoming from existing Facebook fans, this can be attributed to themore positive disposition of Facebook fans toward the brandsthey like. In fact, 60% of Facebook fans say they’re more likelyto recommend the brand since becoming a fan.3
Daily review submissions via Facebook11
Women fuelword of mouthWomen dominate social networks, as the majority on bothFacebook (58%) and Twitter (64%).4 This dominance is also seenin onsite social use, with women producing 60% of all UGC in Q2.Women were also more positive than men. The average rating forfemale-written reviews was 4.43 stars out of 5, as compared to themale average of 4.32 stars.Women produced60% of all UGC in Q2.Overall, consumers age 35-44 contributed the most UGC acrossBazaarvoice clients this quarter. Collectively, consumers between25 and 54 years old were the biggest content drivers, contributing70% of all UGC. The majority of social network users also fall inthis age range.4
5.016%16%15%4.511%11%Average 4.0rating fromwomen9%9%6%Averagerating 3.5from men3% 3%25-34F M35-44F MReviews from women,percent of total, by age45-54F M55-65F M66 F MReviews from men,percent of total, by ageAll reviews by gender and age13
Controlling spending,leading conversationsIn consumer packaged goods (CPG), the vertical with the highestaverage sentiment (4.68, 11% above the cross-industry average),women contributed a huge majority of UGC in Q2 (84%), andwrote 3% more content when doing so.This is likely due to the fact that women typically control CPGbudgets for their households. In the US, women control 85% ofhousehold spending and 93% of food purchases.5 It follows thatthe women researching, considering, and purchasing CPG arealso talking about and recommending these products online.Blog: Social media for the sexes: threeways to capitalize on gender differenceshttp://bv-url.com/82sk18
5.025%Average 4.5ratingfrom menAveragerating from 4.0women20%20%13%5%3.53%2%25-34F M35-44F MReviews from women,percent of total, by age45-54F M6%4%4%55-65F M66 F MReviews from men,percent of total, by ageConsumer packaged goods reviews by gender and age15
5.04.519%17%Averagerating fromwomen16%16%15%4.010%Averageratingfrom men3.51%25-34F M35-44F MReviews from women,percent of total, by age16 1%1%45-54F M4%55-65F MReviews from men,percent of total, by ageConsumer electronics reviews by gender and age66 F M
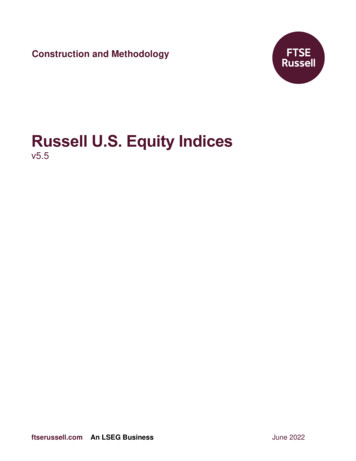
The CPG conversation peaked among 45-54 year olds,with 35-44 and 55-65 trailing just behind. CPG saw highersentiment among older generations this quarter, keeping withhistorical patterns.The consumer electronics vertical showed the opposite gendermakeup, with a large majority (77%) of word of mouth generatedby men, the plurality of which came from men age 45-54.Again, we see that those who control the budgets tend tocontrol the conversation: men spent 53% more than women onconsumer electronics in 2010.6 To influence these spenders,solicit and display UGC wherever purchase decisions are made.In addition to product and category pages online, use customerwords and product ratings in advertising, on packaging, incoupons, and via mobile to reach shoppers in stores.CPG review readers show6% higher average ordervalue than visitors whodon’t read reviews.21
Summer warmstraveler sentimentThe travel vertical saw a 4% increase in average rating in Q2to 4.46 stars on a 5 star scale, while most other verticalsonly fluctuated /- 1%. We saw a similar seasonal sentimentincrease for the travel industry in Q2 2010, and the sentimentspike is likely caused by the fact that summer is the peakseason for pleasure travel.Overall, travel had the longest average review of any verticalin Q2. Travel has always been a category that lends itself tostorytelling, so this is no surprise.Blog: Use this word of mouthmetric to create customer fanaticshttp://bv-url.com/yppj22
04.504.504.004.004.004.004.004.004.004.00Q1 Q2Wordcount71941015958Average rating by industry776611019
91% lower average rating whentagged with customer service.5.0Percent of 18%reviews withcustomer 16%service 14%mentions12%4.54.03.510%3.08%2.56%Customer service mentions by industrySporting goodsMass merchantHousewaresHome improvement1.0Consumer electronics0%Apparel1.5Financial services2%Manufacturing2.0Retail4%ALL Clients20Averageratingbasedon a 5starscaleAveragerating forreviews withcustomerservicementions
Poor service destroys product sentimentAcross industries, 6% of reviews mentioned customer servicein Q2. Overall, the average rating for these reviews was astaggering 91% lower than the general average rating. Manyconsumers are clearly unwilling to evaluate a product’s qualityseparately from their experiences with brand representatives. Agreat product won’t save brand word of mouth if the companydoesn’t support customers with good service.Financial services saw the highestportion of reviews that mentioncustomer service (17%).Financial services saw the highest portion of reviews thatmention customer service (17%), but also showed the smallestgap in average rating between service reviews and reviews notmentioning service (62%). Service industries can expect a higherrate of customer service mentions in reviews, as customers havea higher expectation of service from these businesses and aretherefore more likely to discuss service as part of the product.Historically, February sees an increase in customer servicementions in reviews. This is likely due to the surge of holiday giftpurchases and returns, which accounted for nearly one quarterof all retail returns in 2010.7Though reviews are inherently product-specific, brands shouldn’toverlook the massive opportunity to learn more about howcustomers view other elements of the brand like customerservice. Rather than waiting for and reacting to individualinquiries, proactively search for customer service issues in UGC.When appropriate, responding to service complaints in line witha review shows other customers that service teams are trulylistening to their feedback, and can present an opportunity toturn a negative experience into a positive one.Additionally, aggregated customer feedback offers insightsbusinesses can act on to improve their overall customerexperience. Analyze reviews mentioning service for key positiveand negative themes, and distribute these trends to serviceteams to reveal how to delight customers.21
One in fivespread the loveOne in five reviews in Q2 contained the word “love.” Ratings forreviews containing “love” averaged 4.55 stars—10% higher thanthe overall average.The word “easy” was found in 7% of reviews overall in Q2, andmost often in the consumer electronics (19%), automotive (16%),and financial services (16%) categories. Consumers in these morecomplicated purchase categories are typically looking for easeof use. One tenth of the reviews that contained “easy” alsocontained both “quality” and “value.”The word “easy” wasfound in 7% of reviewsoverall in Q2.Analyzing high-rated and low-rated reviews for key themesreveals exactly what customers like and dislike about a product.Brands should emphasize key words from positive reviews inproduct copy and marketing materials to highlight a product’sbest attributes.
f word4.50averagerating7%frequencyof word“difficult”1%frequencyof word3.62 avg. rating“price”4.09averageratingWord themes in correlation to ratings11%frequencyof word23
“Even though”“but wish”“HOWEVER”“Only Problem”“IF ONLY”“although.”28
Pivot language revealsproduct opportunitiesLow-rated reviews often contain ideas for improving products. Butwhen it comes to UGC, businesses shouldn’t rely on ratings alone touncover opportunities to innovate. While it’s not surprising that 86%of reviews mentioning “never again” were one- or two-star, manyreviews contain “pivot language”—critical review points within anotherwise positive review with a high rating.For example, 75% of customers who “wish” a product was betterin some way still rated the product four or five stars. And 87% ofreviews that identified a product’s “only problem” also rated theproduct four or five stars.Even the best products can get better, so don’t focus solely on lowrated products for opportunities to improve. Devote just as muchscrutiny to high-rated products for innovation suggestions. And whileit’s important to closely monitor negative reviews for potential issues,some of the best insights for improvements come from a product’sbiggest fans. Use text analysis to locate pivot language in positivereviews and uncover trends in suggestions. These insights empowerproduct teams to co-innovate better products with customers.25
As price and complexity increase,consumer questions get specificThe questions consumers asked about products in Q2 canbe divided into two broad types—seeking questions anddiscussion questions.“Seeking” questions ask for product-specific use cases andinformation, and are looking for facts rather than opinions.Example seeking questions include:“Does GPS navigation in this truck come standard?”“At what decibel do these speakers max out?”“Does this hotel offer free wireless internet?”Seeking questions were more prevalent in verticals whereproducts are more expensive and complicated. Consumers riskmore if they have less knowledge about these products, so theymake sure to ask detailed questions before they purchase. In theautomotive, travel, and consumer electronics categories,seeking questions comprised 81%, 79%, and 58% ofquestions asked, respectively.26Brands in these categories should closely monitor Q&Acommunities in near real time, and have representatives providefact-based answers to help shoppers find the right productsfor their specific needs. Analyzing trends in seeking questionsalso gives insight into which product attributes and informationbrands should emphasize in product copy.“Discussion” questions are open-ended, or concern categoriesor comparisons of products, and are often invitations to otherconsumers to weigh in with more subjective answers andrecommendations. Example discussion questions include:“What type of baby wipes do you recommend for infants?”“Which of these two sweaters looks better on my body type?”“Which of these lamps is the best, and why?”
Seeking and discussion questions27
Discussion questions53%21%58%Seeking s42%36%Discussion vs. seeking questions81%58%
Discussion questions were seen most often in verticals whereproduct price and complexity were lower, allowing more leewayto discuss subjective favorites and opinions. In the CPG, retail,and general manufacturing verticals, discussion questionscomprised 64%, 58%, and 53% of questions asked, respectively.For subjective discussion questions, answers from brandrepresentatives are less helpful and trusted than answers fromactual users. Brands in categories prone to discussion questionsshould focus more heavily on fostering peer-to-peer discussioncommunities amongst their customers. Follow up purchases andreview submissions with an email, inviting customers back to abrand site to share their trusted, first-hand product knowledgewith shoppers.Site visitors who interact withboth reviews and customerQ&A are 105% more likely topurchase. They spend 11%more than visitors who don’tinteract with UGC.33
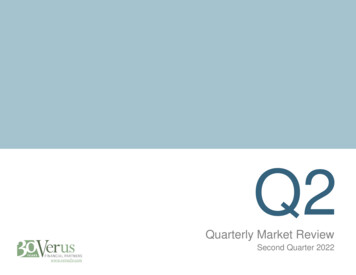
UGC served at 3 kilohertz, volume soarsOverall, UGC volume and submissions continue to soar acrossindustries. Q2 showed 34% year-over-year growth for reviewvolume. Overall average rating across all industries studied was4.22 out of 5 stars for the quarter. Retailers saw the largestincrease in volume this quarter, far outpacing other verticals.Answer volume continues to outpace question volume, keepingwith the historical pattern.These increases in volume correlate with an increase in UGCimpressions. Two hundred and seventy-six million pieces of UGCwere served to online visitors each day in Q2—that’s over 3,000pieces every second, or 3 kilohertz.Question and answer volumes likewise grew this quarter, with119% growth in questions and 129% in answers year over year.9M8M7M6M5M4M3M2M1M030Monthly review growth across all industriesJune 2011May 2011April 2011March 2011February 2011January 2011December 2010November 2010October 2010September 2010August 2010July 2010June 2010May 2010April 2010March 2010MonthlyreviewvolumetrendRunningtotal ofreviewcount(Since3/1/2010)
43,000. Occurence per second.2,200.1,322. .200. . . . .Babies bornFacebook wall postsPieces of UGCOccurrences per secondTweetsCraigslist posts31
ConclusionSocial data is a wellspring of rich customer and productintelligence. By analyzing customer conversations,businesses uncover insights to develop a holistic picture oftheir customers—who they are, what they want, and howthey talk about products and services.But these insights are only as powerful as the actions t
Average rating: 4.14 Southwest Pacific Average rating: 4.35 Sub-Saharan Africa Average rating: 4.16 North Africa Average rating: 3.97 Europe Average rating: 4.26 North Asia Average rating: 4.32 South & Southeast Asia Average rating: 3.95 East Asia Average rating: 4.09 West & Central Asia Average rating: 4.11 North America Average rating: 4.23