Transcription
Cluster and DataStream AnalysisGraham Cormodecormode@bell-labs.com
Outline Cluster Analysis– Clustering Issues– Clustering algorithms:Hierarchical Agglomerative Clustering, K-means, ExpectationMaximization, Gonzalez approximation for K-center Data Stream Analysis– Massive Data Scenarios– Distance Estimates for High Dimensional Data:Count-Min Sketch for L , AMS sketch for L2, Stable sketchesfor Lp, Experiments on tabular data– Too many data points to store:Doubling Algorithm for k-center clustering, HierarchicalAlgorithm for k-median, Grid algorithms for k-median Conclusion and Summary2
1. ClusterAnalysis3
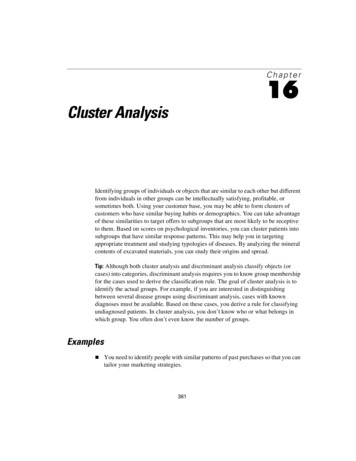
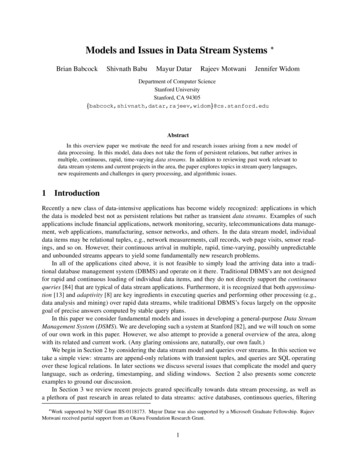
An Early Application of ClusteringJohn Snow plotted the location of cholera cases on amap during an outbreak in the summer of 1854.His hypothesis was that the disease was carried inwater, so he plotted location of cases and waterpumps, identifying the source.Clusters easy toidentify visuallyin 2 dimensions more points andhigherdimension?4
Clustering OverviewClustering has an intuitive appealWe often talk informally about “clusters”: ‘cancerclusters’, ‘disease clusters’ or ‘crime clusters’Will try to define what is meant by clustering, formalizethe goals of clustering, and give algorithms forclustering dataMy background: algorithms and theory, so will havealgorithmic bias, less statistical5
What is clustering?We have a bunch of items. we want to discover theclusters.6
Unsupervised LearningSupervised Learning: training data has labels(positive/negative, severity score), and we try tolearn the function mapping data to labelsClustering is a case of unsupervised learning: there areno labeled examplesWe try to learn the “classes” of similar data, groupingtogether items we believe should have the same labelHarder to evaluate “correctness” of clustering, since noexplicit function is being learned to check against.Will introduce objective functions so that we cancompare two different clusterings of same data7
Why Cluster?What are some reasons to use clustering? It has intuitive appeal to identify patterns To identify common groups of individuals (identifyingcustomer habits; finding disease patterns) For data reduction, visualization, understanding: picka representative point from each cluster To help generate and test hypotheses: what are thecommon factors shared by points in a cluster? A first step in understanding large data with noexpert labeling.8
Before we start Before we jump into clustering, pause to consider: Data Collection – need to collect data to start with Data Cleaning – need to deal with imperfections,missing data, impossible values (age 120?) How many clusters - Often need to specify k, desirednumber of clusters to be output by algorithm Data Interpretation – what to do with clusters whenfound? Cholera example required hypothesis onwater for conclusion to be drawn Hypothesis testing – are the results significant? Canthere be other explanations?9
Distance MeasurementHow do we measure distance between points?In 2D plots it is obvious – or is it?What happens when data is not numeric, but containsmix of time, text, boolean values etc.?How to weight different attributes?Application dependent, somewhat independent ofalgorithm used (but some require Euclidean distance)10
Metric SpacesWe assume that the distances form a metric spaceMetric space: a set of points and a distance measure don pairs of points satisfying Identity: d(x,y) 0 x y Symmetry: d(x,y) d(y,x) Triangle inequality: d(x,z) d(x,y) d(y,z)Most distance measurements of interest are metricspaces: Euclidean distance, L1 distance, L distance,edit distance, weighted combinations.11
Types of clusteringWhat is the quantity we are trying to optimize?12
Two objective functionsK-centersPick k points in the space, call these centersAssign each data point to its closest centerMinimize the diameter of each cluster: maximumdistance between two points in the same clusterK-mediansPick k points in the space, call these mediansAssign each data point to its closest centerMinimize the average distance from each point to itsclosest center (or sum of distances)13
Clustering is hardFor both k-centers and k-medians on distances like 2DEuclidean, it is NP-Complete to find best clustering.(We only know exponential algorithms to find themexactly)Two approaches: Look for approximate answers with guaranteedapproximation ratios. Look for heuristic methods that give good results inpractice but limited or no guarantees14
Hierarchical ClusteringHierarchical Agglomerative Clustering (HAC) has beenreinvented many times. Intuitive:Make each input point into an input cluster.Repeat: merge closest pair of clusters, untila single cluster remains.To find k clusters:output last k clusters.View result as binarytree structure: leavesare input points,internal nodescorrespond to clusters,merging up to root.15
Types of HACBig question: how to measure distance betweenclusters to find the closest pair? Single-link: d(C1, C2) min d(c1 C1, c2 C2)Can lead to “snakes”: long thin clusters, since eachpoint is close to the next. May not be desirable Complete-link: d(C1, C2) max d(c1 C1, c2 C2)Favors circular clusters also may not be desirable Average-link: d(C1, C2) avg d(c1 C1, c2 C2)Often thought to be better, but more expensive tocompute 16
HAC ExamplePopular way to studygene expressiondata frommicroarrays.Use the cluster treeto create a linearorder of (highdimensional) genedata.17
Cost of HACHierarchical Clustering can be costly to implement:Initially, there are Θ(n2) inter-cluster distances tocompute.Each merge requires a new computation of distancesinvolving the merged clusters.Gives a cost of O(n3) for single-link and complete-linkAverage link can cost as much as O(n4) timeThis limits scalability: with only few hundred thousandpoints, the clustering could take days or months.Need clustering methods that take time closer to O(n)to allow processing of large data sets. 18
K-meansK-means is a simple and popular method for clusteringdata in Euclidean space.It finds a local minimum of the objective function thatis average sum of squared distance of points from thecluster center.Begin by picking k points randomly from the dataRepeatedly alternate two phases:Assign each input point to its closest centerCompute centroid of each cluster (average point)Replace cluster centers with centroidsUntil converges / constant number of iterations19
K-means exampleExample due to Han and 91020
K-means issues Results not always ideal:– if two centroids are close to each other, one can“swallow” the other, wasting a cluster– Outliers can also use up clusters– Depends on initial choice of centers: repetition canimprove the results (Like many other algorithms) Requires k to be knownor specified up front, hard to tell what is best value ofk to use But, is fast – each iteration takes time at most O(kn),typically requires only a few iterations to converge. 21
Expectation MaximizationThink of a more general and formal version of k-meansAssume that the data is generated by some particulardistribution, eg, by k Gaussian dbns with unknown meanand variance.Expectation Maximization (EM) looks for parameters of thedistribution that agree best with the data.Also proceeds by repeating an alternating procedure:Given current estimated dbn, compute likelihood foreach data point being in each cluster.From likelihoods, data and clusters, recomputeparameters of dbnUntil result stabilizes or after sufficient iterations22
Expectation Maximization Cost and details depend a lot on what model of theprobability distribution is being used:mixture of Gaussians, log-normal, Poisson, discrete,combination of all of these Gaussians often easiest to work with, but is this agood fit for the data? Can more easily include categorical data, by fitting adiscrete probability distribution to categoricalattributes Result is a probability distribution assigningprobability of membership to different clustersFrom this, can fix clustering based on maximumlikelihood. 23
Approximation for k-centersWant to minimize diameter (max dist) of each cluster.Pick some point from the data as the first center.Repeat:– For each data point, compute its distance dminfrom its closest center– Find the data point that maximizes dmin– Add this point to the set of centersUntil k centers are pickedIf we store the current best center for each point, theneach pass requires O(1) time to update this for thenew center, else O(k) to compare to k centers.So time cost is O(kn) [Gonzalez, 1985].24
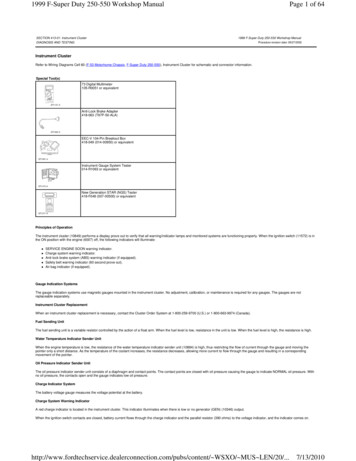
Gonzalez Clustering k 4c3ALG:Select an arbitrary center c1Repeat until have k centersSelect the next center ci 1 tobe the one farthest from itsclosest centerc2c1Slide due to Nina Mishra HP labs25
Gonzalez Clustering k 4c3c2c1Slide due to Nina Mishra HP labsc426
Gonzalez Clustering k 4Let d maxi and p in ci dist(ci,p)c3Claim: There exists a (k 1)clique where each pair ofpoints is distance d.- dist(ci,p) d for all i- dist(ci,cj) d for all i,jNote: Any k-clustering mustput at least two of thesek 1 points in the samecluster.- by pigeonholeThus: d 2OPTc2pdc1Slide due to Nina Mishra HP labsc427
Gonzalez is 2-approximationAfter picking k points to be centers, find next point thatwould be chosen. Let distance from closest center doptWe have k 1 points, every pair is separated by at leastdopt. Any clustering into k sets must put some pair insame set, so any k-clustering must have diameter doptFor any two points allocated to the same center, they areboth at distance at most dopt from their closest centerTheir distance is at most 2dopt, using triangle inequality.Diameter of any clustering must be at least dopt, and is atmost 2dopt – so we have a 2 approximation.Lower bound: NP-hard to guarantee better than 228
Available Clustering Software SPSS implements k-means, hierarchical and “two-step”clustering (groups items into pre-clusters, thenclusters these) XLMiner (Excel plug-in) does k-means and hierarchical Clustan ClustanGraphics offers 11 methods ofhierarchical cluster analysis, plus k-means analysis,FocalPoint clustering. Up to 120K items for averagelinkage, 10K items for other hierarchical methods. Mathematica – hierarchical clustering Matlab – plug-ins for k-means, hierarchical and EMbased on mixture of Gaussians, fuzzy c-means(Surprisingly?) not much variety 29
Clustering SummaryThere are a zillion other clustering algorithms: Lots of variations of EM, k-means, hierarchical Many “theoretical” algorithms which focus on gettinggood approximations to objective functions “Database” algorithms: BIRCH, CLARANS, DB-SCAN,CURE focus on good results and optimizing resources Plenty of other ad-hoc methods out thereAll focus on the clustering part of the problem (cleaninput, model specified, clear objective)Don’t forget the data (collection, cleaning, modeling,choosing distance, interpretation )30
2. StreamingAnalysis31
Outline Cluster Analysis– Clustering Issues– Clustering algorithms:Hierarchical Agglomerative Clustering, K-means, ExpectationMaximization, Gonzalez approximation for K-center Data Stream Analysis– Massive Data Scenarios– Distance Estimates for High Dimensional Data:Count-Min Sketch for L , AMS sketch for L2, Stable sketchesfor Lp, Experiments on tabular data– Too many data points to store:Doubling Algorithm for k-center clustering, HierarchicalAlgorithm for k-median, Gridding algorithm for k-median Conclusion and Summary32
Data is MassiveData is growing faster than our ability to store orprocess it There are 3 Billion Telephone Calls in US each day,30 Billion emails daily, 1 Billion SMS, IMs. Scientific data: NASA's observation satellitesgenerate billions of readings each per day. IP Network Traffic: up to 1 Billion packets per hourper router. Each ISP has many (hundreds) routers! Whole genome sequences for many species nowavailable: each megabytes to gigabytes in size33
Massive Data AnalysisMust analyze this massive data: Scientific research (compare viruses, species ancestry) System management (spot faults, drops, failures) Customer research (association rules, new offers) For revenue protection (phone fraud, service abuse)Else, why even measure this data?34
Example: Network DataNetworks are sources of massive data: the metadataper hour per router is gigabytesFundamental problem of data stream analysis:Too much information to store or transmitSo process data as it arrives: one pass, small space:the data stream approach.Approximate answers to many questions are OK, ifthere are guarantees of result quality35
Streaming Data QuestionsNetwork managers ask questions that often maponto “simple” functions of the data. Find hosts with similar usage patterns (cluster)? Destinations using most bandwidth? Address with biggest change in traffic overnight?The complexity comes from limited space and time.Here, we will focus on clustering questions, whichwill demonstrate many techniques from streaming36
Streaming And ClusteringRelate back to clustering: how to scale when data ismassive? Have already seen O(n4), O(n3), even O(n2)algorithms don’t scale with large data Need algorithms that are fast, look at data only once,cope smoothly with massive dataTwo (almost) orthogonal problems: How to cope when number of points is large? How to cope when each point is large?Focusing on these shows more general streaming ideas.37
When each point is large For clustering, need to compare the points. Whathappens when the points are very high dimensional? Eg. trying to compare whole genome sequences comparing yesterday’s network traffic with today’s clustering huge texts based on similarityIf each point is size m, m very large cost is very high(at least O(m). O(m2) or worse for some metrics)Can we do better? Intuition says no randomizationsays yes!38
Trivial Example1 0 1 1 1 0 1 0 1 1 0 1 1 0 0 1 0 1 Simple example. Consider “equality distance”:d (x,y) 0 iff x y, 1 otherwiseTo compute equality distance perfectly, must take lineareffort: check every bit of x every bit of y.Can speed up with pre-computation and randomization:use a hash function h on x and y, test h(x) h(y)Small chance of false positive, no chance of false negative.When x and y are seen in streaming fashion, computeh(x), h(y) incrementally as new bits arrive (Karp-Rabin)39
Other distancesDistances we care about: Euclidean (Lp) distance— x- y 2 ( i (xi – yi)2 )1/2 Manhattan (L1) distance— x- y 1 i xi – yi Minkowski (Lp) distances— x- y p ( i xi – yi p )1/p Maximum (L ) distance— x–y maxi xi – yi Edit distances: d(x,y) smallest number of insert/deleteoperations taking string x to string y Block edit distances: d(x,y) smallest number of indels& block moves taking string x to string yFor each distance, can we have functions h and f so thatf(h(x),h(y)) d(x,y), and h(x) x ?40
L distanceWe will consider L distance.Example: [2,3,5,1] – [4,1,6,2] [2,2,1,1] 2Provably hard to approximate with relative error,so will show an approximation with error ε x- y 1First, consider subproblem: estimate a value in a vectorStream defines a vector a[1.U], initially all 0Each update change one entry, a[i] a[i] count.In networks U 232 or 264, too big to storeCan we use less space but estimate each a[i]reasonably accurately?41
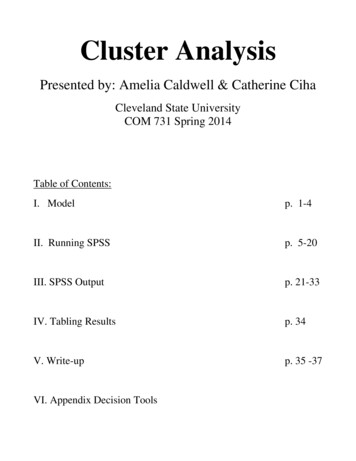
Update AlgorithmIngredients:– Universal hash fns h1.hlog 1/δ {1.U} {1.2/ε}– Array of counters CM[1.2/ε, 1.log2 1/δ]h1(i) count counti,counthlog 1/δ(i)log 1/δ count count2/εCount-Min Sketch42
ApproximationApproximate â[i] minj CM[hj(i),j]Analysis: In j'th row, CM[hj(i),j] a[i] Xi,jXi,j Σ a[k] hj(i) hj(k)E(Xi,j) Σ a[k]*Pr[hj(i) hj(k)] Pr[hj(i) hj(k)] * Σ a[k] εN/2 by pairwise independence of hPr[Xi,j εN] Pr[Xi,j 2E(Xi,j)] 1/2 by Markov inequalitySo, Pr[â[i] a[i] ε a 1] Pr[ j. Xi,j ε a 1] 1/2log 1/δ δFinal result:with certainty a[i] â[i] andwith probability at least 1-δ, â[i] a[i] ε a 143
Applying to L By linearity of sketches, we haveCM(x – y) CM(x) – CM(y)Subtract corresponding entries ofthe sketch to get a new sketch. Can now estimate (x – y)[i] using sketchSimple algorithm for L : estimate (x-y)[i] for each i,take max. But too slow!Better: can use a group testing approach to find all i’swith (x-y)[i] ε x –y 1, take max to find L Note: group testing algorithm originally proposedto find large changes in network traffic patterns.44
L2 distanceDescribe a variation of the Alon-Matias-Szegedyalgorithm for estimating L2 by generalizing CM sketch.Use extra hash functions g1.glog 1/δ {1.U} { 1,-1}Now, given update (i,u), set CM[h(i),j] u*gj(i)Estimate a 22 medianj i CM[i,j]2 Result is i g(i)2ai2 h(i) h(j) 2 g(i) g(j) ai aj g(i)2 -12 12 1, and i ai2 a 22 g(i)g(j) has 50/50 chance of being 1 or –1 : in expectation is 0 linearprojectionAMS sketch45
L2 accuracyFormally, one can show that the expectation of eachestimate is exactly a 22 and variance is bounded byε2 times expectation squared.Using Chebyshev’s inequality, show that probabilitythat each estimate is within ε a 22 is constantTake median of log (1/δ) estimates reduces probabilityof failure to δ (using Chernoff bounds)Result: given sketches of size O(1/ε2 log 1/δ) can ε) a 22 withestimate a 22 so that result is in (1 probability at least 1-δ [Note: same Chebyshev-Chernoff argument used manytime in data stream analysis]46
Sketches for Lp distanceLet X be a random variable distributed with a stabledistribution. Stable distributions have the property thata1X1 a2X2 a3X3 anXn (a1, a2, a3, , an) pXif X1 Xn are stable with stability parameter pThe Gaussian distribution is stable with parameter 2Stable distributions exist and can be simulated for allparameters 0 p 2.So, let x x1,1 xm,n be a matrix of values drawn froma stable distribution with parameter p.α stable distribution47
Creating SketchesCompute si xi · a, ti xi · bmedian( s1 - t1 , s2 - t2 , , sm - tm )/median(X)is an estimator for a - b pCan guarantee the accuracy of this process: will bewithin a factor of 1 ε with probability δ ifm O(1/ε2 log 1/δ)Streaming computation: when update (i,u)arrives, compute resulting change on s.Don’t store x -- compute entries ondemand (pseudo-random generators).linearprojectionStable sketch48
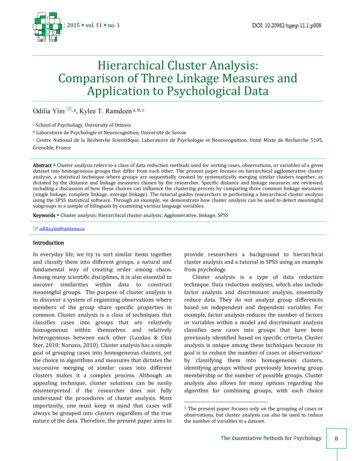
Experiments with tabular dataAdding extra rows orcolumns increases the sizeby thousands or millions ofreadingsThe objects of interest aresubtables of the dataeg Compare cellphone trafficof SF with LAThese subtables are alsomassive!49
L1 TestsWe took 20,000 pair of subtables, and compared themusing L1 sketches. The sketch size was less than 1Kb. Sketches are very fast and accurate(can be improved further by increasing sketch size) For large enough subtables ( 64KB) the time saving“buys back” pre-processing cost of sketch computation50
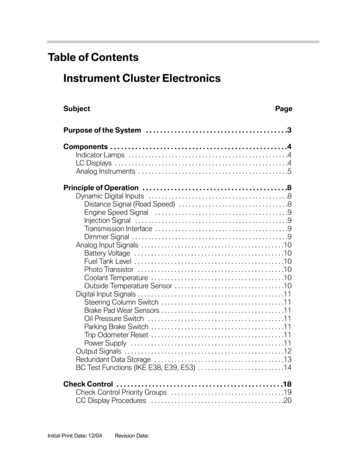
Clustering with k-meansRun k-means algorithm,replacing all distancecomputations withsketch computationsSketches are much fasterthan exact methods, andcreating sketches whenneeded is always fasterthan exact computation.As k increases, the timesaving becomes moresignificant.For 8 or more clusters,creating sketches whenneeded is much faster.51
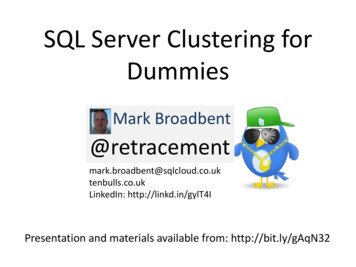
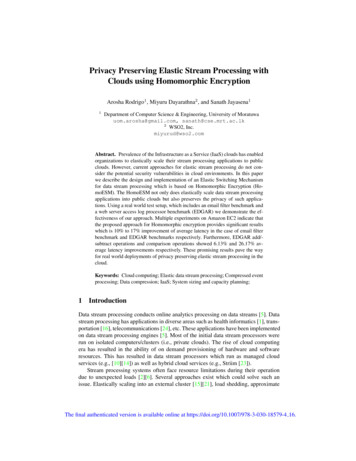
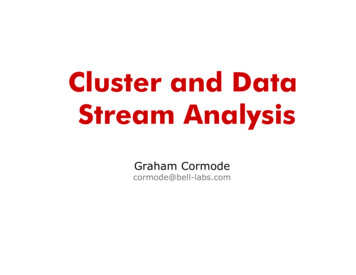
Case study: US Call DataOne day's data clustered under p 2.0, p 1.0, p 0.2500:0004:00p 2.008:0012:0016:0020:0000:0004:00p 1.008:0012:0016:0020:0000:00p 0.2504:0008:0012:0016:0020:0000:0052
Case study: US Call DataWe looked at the call data for the whole US for asingle day p 2 shows peak activity across the countryfrom 8am - 5pm local time, and activity continuesin similar patterns till midnight p 1 shows key areas have similar call patternsthroughout the day p 0.25 brings out a very few locations thathave highly similar calling patterns53
Streaming Distance SummaryWhen each input data item is huge, can approximatedistances using small sketches of the dataSketches can be computed as the data streams in Higher level algorithms (eg, nearest neighbors,clustering) can run, replacing exact distances withapproximate (sketch) distances.Different distances require different sketches– have covered d , L , L2 and Lp (0 p 2)Partial results known for other distances, eg.edit distance/block edit distance,earth movers distance etc.54
Outline Cluster Analysis– Clustering Issues– Clustering algorithms:Hierarchical Agglomerative Clustering, K-means, ExpectationMaximization, Gonzalez approximation for K-center Data Stream Analysis– Massive Data Scenarios– Distance Estimates for High Dimensional Data:Count-Min Sketch for L , AMS sketch for L2, Stable sketchesfor Lp, Experiments on tabular data– Too many data points to store:Doubling Algorithm for k-center clustering, HierarchicalAlgorithm for k-median, Gridding algorithm for k-median Conclusion and Summary55
Stream Clustering Many PointsWhat does it mean to cluster on the stream when thereare too many points to store?We see a sequence of points one after the other, andwe want to output a clustering for this observed data.Moreover, since this clustering changes with time, foreach update we maintain some summary information,and at any time can output a clustering.Data stream restriction: data isassumed too large to store,so we do not keep all the input,or any constant fraction of it.56
Clustering for the streamWhat should output of a stream clustering algorithm be?Classification of every input point? Too large to be useful?Might this change as more input points arrive?– Two points which are initially put in different clustersmight end up in the same oneAn alternative is to output k cluster centers at end- any point can be classified using these centers.Input:Output:57
Gonzalez RestatedSuppose we knew dopt (from Gonzalez algorithm for kcenters) at the startDo the following procedure:Select the first point as the first centerFor each point that arrives:– Compute dmin, the distance to the closest center– If dmin dopt then set the new point to be a newcenterdopt58
Analysis Restateddopt is given, so we know that there are k 1 pointsseparated by dopt and dopt is as large as possibleSo there are k points separated by doptNew algorithm outputs at most k centers: only includea center when its distance is dopt from all others.If k centers output, then k points separated by dopt, contradicting optimality of dopt.Every point not chosen as a center is dopt from somecenter and so at most 2dopt from any point allocatedto the same center (triangle inequality)So: given dopt we find a clustering where every point isat most twice this distance from its closest center59
Guessing the optimal solutionHence, a 2-approximation -- but, we aren’t given doptSuppose we knew dopt was between d and 2d, then wecould run the algorithm. If we find more than k centers,then we guessed dopt too lowSo, in parallel, guess dopt 1, 2, 4, 8.We reject everything less than dopt, so best guess is 2dopt: our output will be 2*2dopt/dopt 4 approxNeed log2 (dmax/dsmallest) guesses, dsmallest is minimumdistance between any pair of points, as dsmallest doptO(k log(dmax / dsmallest) may be high, can we reduce more?60
Doubling AlgorithmDoubling alg [Charikar et al 97] uses only O(k) space.Each ‘phase’ begins with k 1 centers, these aremerged to get fewer centers.Initially set first k 1 points in stream as centers.Merging: Given k 1 centers each at distance at leastdi, pick one arbitrarily, discard all centers within 2diof this center; repeat until all centers separated byat least 2diSet di 1 2di and go to phase i 1Updating: While k 1 centers, for each new pointcompute dmin. If dmin di, then set the new point tobe a new center61
Analyzing merging centersAfter merging, every pair of centers is separated by atleast di 1Claim: Every point that has been processed is at most2di 1 from its closest centerProof by inductionBase case:The first k 1 (distinct) points are chosen as centersSet d0 minimum distance between any pairEvery point is distance 0 from its closest centerAnd trivially, 0 2d062
Finishing the Induction 2di 2diEvery point is at most 2di 1 from its closest centerInductive case: before merging, every point that hasbeen seen is at most 2di from its closest centerWe merge centers that are closer than 2diSo distance between any point and its new closestcenter is at most distance to old center distancebetween centers 2di 2di 4di 2di 163
Optimality RatioBefore each merge, we know that there are k 1 pointsseparated by di, so dopt diAt any point after a merge, we know that every point isat most 2di 1 from its closest centerSo we have a clustering where every pair of points in acluster is within 4di 1 8di of each other8di / dopt 8dopt/dopt 8So a factor 8 approximationTotal time is (amortized) O(n k log k) using heaps 64
K-mediansk-medians measures the quality based on the averagedistance between points and their closest median.So: Σp1 d(p1,median(p1))/nWe can forget about the /n, and focus on minimizingthe sum of all point-median distancesNote here, outlier points do not help us lower boundthe minimum cluster sizeWe will assume that we have an exact method for kmedians which we will run on small instances.Results from Guha, Misra, Motwani & O’Callaghan ‘0065
Divide and conquerSuppose we are given n points to cluster.Split them into n1/2 groups of n1/2 points.Cluster each group in turn to get k-medians.Then cluster the group of k-medians to get a final set.The space required is n1/2 for each group of points, andkn1/2 for all the intermediate medians.Need to analyze the quality of the resultant clusteringin terms of the optimal clustering for the whole set ofpoints.66
AnalysisFirstly, analyze the effect of picking points from theinput as the medians, instead of arbitrary pointsConsider optimal solution. Point p is allocated tomedian m.Let q be the point closest to m from the inputd(p,q) d(p,m) d(q,m) 2d(p,m)(since q is closest, d(q,m) d(p,m))So using points from the input at most doubles thedistance.67
AnalysisNext, what is cost of dividing points into separategroups, and clustering each?Consider the total cost ( sum of distances) of theoptimum for the groups C, & the overall optimum C*Suppose we choose the medians from the points ineach group.The “optimum” medians are not present in each group,but we can use the closest point in each group to theoptimum median.Then C 2C* using the previous result.68
How to reclusterAfter processing all groups, n1/2 sets of k-medians.For each median, use “weight”: number of points wereallocated to it. Recluster using the weighted medians.Each point p is allocated to some median mp, which isthen reclustered to some new median op.Let the optimal k-median for point p be qpmppopCost of the reclustering is Σp d(mp,op)qp69
Cost of reclusteringmppopCost of reclustering Σp d(mp,op) Σp d(mp,qp)qpBecause op is the optimal median for mp, then the sum ofdistances to the qps must be more.Σp d(mp, qp) Σp d(mp, p) d(p,qp) cost(1st clustering) cost(optimal clustering) C C*If we restrict to using points from the original dataset,then we at most double this to 2(C C*).Total cost 2(C C*) C 8C* using previous result70
Approximate versionPrevious analysis assumes optimal k-median clustering.Too expensive; in practice, find c-approximation.So C 2cC* and Σp d(mp,op) cΣp d(mp,qp)Putting this together gives a bound of[2c(2C C*) C]/C* 2c(2c 1) 2c 4c(c 1)This uses O(kn1/2) space, which is still a lot. Use thisprocedure to repeatedly merge clusterings.Approximation factor gets worse with more levels(one level: O(c), two: O(c2), i: O(ci))71
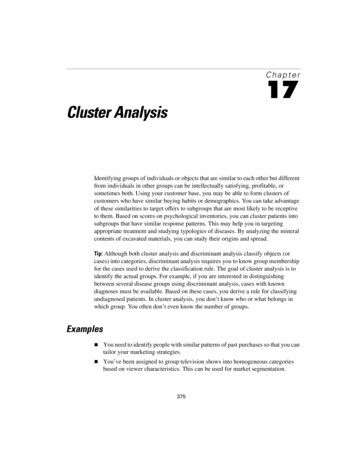
Clustering with small Memorykkkk A factor is lost in theapproximation with each levelof divide and conquerkIn general, if Memory nε, need1/ε levels, approx factor 2O(1/ε)k If n 1012 and M 106, thenregular 2-level algorithm If n 1012 and M 103 then need 4levels, approximation factor 24 kkkk Slide due to Nina Mishrak72
Gridding ApproachOther recent approaches use “Gridding”:Divide space into a grid, keep count ofnumber of points in each cell.Repeat for successively coarser grids.Show that by tracking information ongrids can approximate clustering: (1 ε)approx for k-median in low dimensions[Indyk 04, Frahling Sohler 05]12131511Don’t store grids exactly, but usesketches to represent them (allowsdeletion of points as well as insertions).73
Using a gridGiven a grid, can estimate the cost of a givenclustering:Cost of clustering r number of points not covered by circle of radius r r points not covered in grid by coarse circleNow can search for best clustering (still quite costly) 74
Summary of resultsHave seen many of the key ideas from data streaming: Create small summaries that are linear projections ofthe input: ease of composability [all sketches] Use hash functions and randomized analysis (withlimited independence properties) [L2 sketches] Use probabilistic random generators to compute same“random” number many times [Lp sketches] Combinatorial or geometric arguments to show thateasily maintained data is good approx [Doubling alg] Hierarchical or tree structure approach: composesummaries, summarize summaries [k-median algs]Approximates expensive computations more cheaply75
Related topics in Data StreamsRelated data mining questions from Data Streams: Heavy hitters, frequent items, wavelet,histograms – related to L . Median, quantile computation – connects to L Change detection, trend analysis – sketches Distinct items, F0 – can use Lp sketchesv1 1g1 g2
SPSS implements k-means, hierarchical and "two-step" clustering (groups items into pre-clusters, then clusters these) XLMiner (Excel plug-in) does k-means and hierarchical Clustan ClustanGraphicsoffers 11 methods of hierarchical cluster analysis, plus k-means analysis, FocalPointclustering. Up to 120K items for average