Transcription
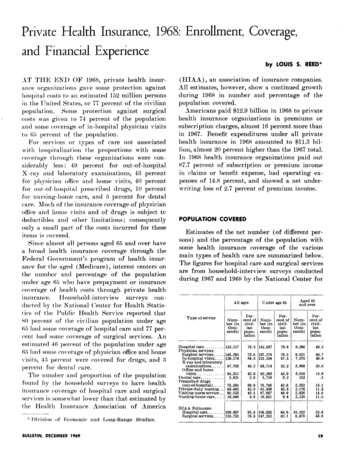
Private Health Insurance, 1968: Enrollment, Coverage,and Financial Experienceby LOUIS S. REED*.IT THE ENI OF 1968, private health insurance organizationsgave some protection againsthospital costs to an estimated 152 million personsin the ITnited States, or 77 percent, of the civilianSome protect,ion against surgicalpopulation.costs was given to 74 percent, of t,lie populationand some coverage of in-hospital physician visitsto 6.5 percent of the population.For services or t,ypes of care not associatedwit11 llospitnlizatioilthe proportionswith somecoverage through these organizationswere tollsiderablyless : 49 percent for out,-of-hospitalX-ray and laboratoryexaminations,13 percentfor p11Jsici:ni oficct and home visik, 40 percentfor out -of-hospitalprescribed drugs, 10 percentfor nursing-homecare, and 3 percent for dentalcare. JLuch of the insurame coverage of physicianoffice aud home visits and of drugs is subject tcdeductibles and other limitations;consequentlyonly a small part of the costs incurred for theseitems is covered.Since almost all persons aged 65 and over havea broad health insurance coverage through theFederal Government ?s program of health insurance for the aged (Medicare), interest centers onpercent,age of the populationt#he number andunder age 65 who have prepayment or insurancecoverage of health costs through private ed by the National Cent,er for Health Statistics of the Public Health Service reported that80 percent of the civilian populat,ion under age65 Ilad some coverage of hospital care and 77 percent had some coverage of surgical services. Anestimated 46 percent of the population under age65 had some coverage of physician office and homevisits, 43 percent were covered for drugs, and 3percent for tt llti lcare.The number and proport,ion of the populationfound by the household surveys to have healthinsurance co\-erage of hospit,al care and surgicalservices is sonle\ h:tt lower than that estimated bythe Heaith InsuranceL4ssociation of america:: ng-RangeStndies.(HTAA) , an association of insurance companies.911 estimates, however, show a continued growthduring 1968 in number and percentage of hhepopulation covered.Americans paid 12.9 billion in 1968 to privatelieahh insurance organizationsin premiums orsubscription charges, almost 16 percent more thanin 1967. Benefit expendit,ures under all privatehealth insurance in 1968 amounted to 11.3 billion, almost, 20 percent higher than the 1967 total.In 1968 health insurance organizationspaid out87.7 percent of subscriptionor premium incomein claims or benefit expense, had operating expenses of 14.8 percent, and showed a net underwrit’ing loss of 2.7 percent of premium income.POPULATION COVEREDEstimates of the net number (of different persons) and the percentage of the population withsome health insurance coverage of the variousmain types of health care are summarized below.The figures for hospital care and surgical servicesare from household-interviewsurveys conductedduring 1967 and 1968 by t,he Nat,ional Center forAll/-TypeHospitalcare.-. .Physicianservices:Surgicalservices .In-hosuitalvisits-.X-ray and laboratoryexaminations.Office and homevisit. . . .Dpntalcare.--. . .Prescribeddrugs(out-of-hospital). homecare-.Under--.Perxnt ofcivilianpm&of service-- ----agesAged 65and over--age 65-PerofcivilianPOPUletionNumber (inthousands)NUUI-, ant-i ,er(in IthouE;ands)Perc ent ,2955,71945.93.23,01610215.6.539.942.045.59.6 AEstimatesHospitalcare-. . . . 169,497Surgicalservice. .155,725-88.832.1L--110.1623,473-I52.643.819
HIAAbases its estimates on gross enrollmentswith deduct,ions for multipleor duplicatoqcoverages.Since most persons aged 65 and over hadcoverage at the end of 1968 for hospital careunder Medic,are and 96 percent had coverage ofphysician services m der Medicare, any privatehealth insurance coverage held by the aged iscomplementaryto Medicare--thatis, it’ pays ingreater or lesser degree for health expenses notcovered in full or at all by Medicare. At the endof 1968, about. half of all the aged had somclcoverage of hospital care under private healthinsurance and a slightly smaller proportionhat1some coverage of surgical services.The number of persons enrolled for each of10 services by the different types of health insurance organizationsare shown in tables 1 to 3, together with estimates of t.he net number of difl’erent. persons having some coverage of each of thestlservices.Dat,a in table 2 for those under age 65 show lhatt,he Blue Cross plans reported a total enrollmentfor hospital care at the end of 1968 of 62.8 million.Blue Shield plans not. cooperating or affiliatedwith Blue Cross report)ed an enrollment of 2.3million for hospital care. Total Blue Cross-BlueHealth Statistics. The figures for the other services are based on the gross total of enrollmentsreported by health insurance organizations,withestimated deductions for multiple or duplicatorycoverages that are believed to be reasonable inthe light of the extent) of multiplecoveragesfor hospital care and surgical services.It, should be emphasized t.hat these are estimatesof t,he net, number of different persons wit,h somecoverage of the various services and t’hat theextent of coverage of these services-as measured,for example, by the proportionof consumer expenditures met by insurance benefits-rangesfromsubstantial protect,ion to very little. For physician office and home visits, out-of-hospitalprescribed drugs, private-dutynursing, and nursinghome care, the vast proportionof the coveragecomes under major medical policies. As indicatedlater, privat)e health insurance meet,s less than5 percent of the consumer expendituresfor allhealth services other than those for hospital careand physician service.It will be noted that t,he estimates given herefor the numbers of persons with some coverageof hospital care, surgical services, and physicianin-hospit,al visit.s in almost all cases are lowerthan the correspondingHIAAestimates. TheTABLEnumberl.-Privateof differenthealth insurance enrollment as of December 31, 1968: Numberpersons covered by type of plan and specified type of care-TypePhysician.-. .Rlue Cross-BlueShield. . . . . . . . . . . . .Blue Cross.-. -. . . .BlueShield. . . . . . . . .Insurancecompanies -.mm. . . . . . . . . .Grouppolicies.-mm . . . . . . .Individualpolicies. . . . . . . Independentplans. . . . . . .Community. . . . . .Employer-employ -union-.-. . . . .Privategroup clinic. . .Dentalsociety. .- . .Netnumberof differentmated by NCHS-ORS.-emPercentof civilianHIAA. . . .Percentof civilianpersons. . .population. . . .populationcovered,as esti. . . . .1. .I--.Gross enrollmentas percentof net uumberof dififerent persons covered,as estimatedbyNCHS-ORS. . . . . . . . . . . . . .HIAA. . . . . . . . .L Baaed20on Bureauof the Censusestimate.- .2114.2121.2113.9109.6108.7-of 198,759,QOO BS of Jan.-5,821183,14235 243,076482,662175420ml1,467“2. . .o---87,572.of 3,538::%I.InIwspitalvisitsSurgical-.gross eof planof persons of all ages and estimatesi:E7. .8-l,lQ69SOCIALSECURITY
TABLEZ.-Privatehealth insurance enrollment,rmmber of different persons coveredas of December31, 1968: Numberof persons under age 65 and estimates[In thousands]TPhysicianrservices-Typeof 5,61926,3008,0353,9353,910196numberof differentpersonscovered,as estimated byNCHS-ORS. . . . . . . .Percentof civilianpopulationI. .-.IIIAA. . . .Percentof civilianpopulationI. . .142,83779.6159,33588.8(:ross enrollmentas percentof net numberof different persons covered,as estimatedbyNCHS-OR5. . . . . . . . . . . .IIIAA. . . . 53,9353,380190I- 843,8351,64095904101.438‘-“Z. . 2,4001,8207%%ttgcare--80,5855,719of 282.1122.6114.3-1 Basedon Bureauof the Censusestimateof ?79,433,006as of Jan.-1 Of this total enrollment,82 percent is under groupcontractsand 18 percent is under nongroup contracts.Alittle more than half of the nongroup enrollmentis undergroup conversioncontracts,issued to persons who onleaving their group convertedto a .916,9219.4. 105.0100.0105.0105.0. . . . .105.0102.0-1, 1969.Shield enrollmentfor hospital care was thus65.1 million.’Vnder group policies, insurance companies reported 74.1 million persons covered for hospitalcare. IJnder individualpolicies they reported36.4 million policyholders and family dependents.(Some policyholdersheld more than one policycovering hospital care with t,he same company andsome had policies with more than one company,so the number of policyholderenrollments is considerably greater than the net, number of differentpersons wit,li coverage.)Independent plans-allorganizations providingllealth care benefits on a prepayment or insurancebasis other than Blue Cross-Blue Shield plans orinsurance companies-coveredan estimated 6.8million persons for hospital care, about one-thirdunder communityplans, and two-thirdsunderplans operated by welfare funds, employers, employee associations, or unions.The gross total of enrollments for hospital carereported by or e&imated for all organizations wasBULLETIN,121,10467.5122,05468.0182.4 million.The National Center for HealthStatistics in its 1968 household survey found that142.8 million different persons had hospital careinsurance (adjust,ed to reflect the end-of-yearsituation). Thus the gross enrollments were 127.8percent of the number of net, different personscovered-anindicationthat 40.7 million, or approximately 22.3 percent’, of the 182.5 million grossenrollments were multiple or duplicatory-thatis,coverages in excess of one held by any one person.Most multiple coverage comes from a husband’scovering his wife and children as dependentsunder the insurance at, his place of work, with hiswife covering him and the children as dependentsunder the insurance at. her place of work. Thissituat,ion, of course, occurs more frequently whenthe employer pays the full cost, for both employeeand dependents. A second major source of multiple coverage is t,hat of a person with group coverage under a Hlue Cross plan or an insurance company who purchases an insurance company individual policy to supplement his group coverage.The third major source of multiplecoveragescomes from persons not eligible for group coverage, who hold two or more insurance companyindividualpolicies. Often, a person whose individualpolicy taken out some years ago now21
TABLE 3.-Privatehealth insurance enrollmentnet number of different persons coveredas of December31, 1968: Kumberof persons aged 65 and over and estimatesof[In thousands1IIservicesInhos tsallsboratoryexaminations“;;;aHospitalcareType of pIallPhysician ; , ITotalgross enrollment11,048.Blue Cross-BlueShield . . .Blue Cross-. . -. . BlueShield. . . . .InsurancecompaniesGrouppolicies. . . .ndividuslpolicies .Independentplans. .Community. . . society. . . .- . 2134,3162,1971,494i03485165310102,@3Q.numberof differentpersons covered,as estimated byNCHS-ORS. . . . . . . . . . . . . . .Perwntof civilianpopulation1. . . . . . . . . .HIAA. . . . Percentof civilianpopulationI-. . 138. . .111 . ;,o& . . M1:400134 m . m “o52375316510200101029- 1001002.1x11.:2.82614. r2,12511.0101.1101.t251i0180120560145./1NetGross enrollmentas percentof net numberof different persons covered.as estimatedbyNCHS-ORS. . . . . . . . . . .HIAA. . . . .1 Basedon Bureauof the Censusestimate9,28048.010,16252.6119.1108.7-Iof 19,326,lWQ as of 1, 1969.provides meager benefits against today’s hospitaland medical costs may find it better t,o supplement,t,hat policy with a new one, instead of cancellingt.he old and obtaining all his coverage under a newsingle policy. ,4 considerable share of all insurance company individualpolicies are believedto be supplementary to other coverages.Sources of the DataThe data for the Blue Cross and Blue Shieldplans are those compiled by the Blue Cross Association and the NationalAssociationof BlueShield plans from data reported by the individualplans.” The data for insurance companies are compiled by the HIAAfrom itsannual surveys of the number of persons covered by insurance companies under group andindividualpolicies.(The figures include estimates, based on their premium volume, for asmall number of companies not responding to theHIAA.)The dat,a for independentplans are2 For more detailed data, includingdata for the individualplans, see LouisS. Reed, WillineCarr,andMaureenQ. Dwyer,Enrollmentand Fitlancesof RlucCross awl RZw Shield Plans, 1968, Ofice of Research andStatistics,Research and StatisticsNote No. 22, 1969.223,98920.6estimates of t.he Office of Research and Statisticsbased on its annual surveys of these plans. Thelast full survey of all known plans of this typewas made in 1965 to obtain 1964 data. Estimatesfor the years since then, including196H, havebeen made on the basis of year-to-year changesin a small number of the larger plans.:’ The Officeof Research and Statistics is currentlymakinganot,her survey of all known independent plans,but data from this survey are not yet available.The NCHS-ORS est,imate of the net, nmnber ofpersons mlder age 65 with hospital coverage atthe end of 1968 (142.8 million or 79.6 percent. ofthe civilian population)is based on the householdsurvey conducted during 1968 by the Nat.ionalCenter for Health Statistics. The sample for thissurvey included about 134,006 persons in 42,000households. Detailed findings are to 1 publishedby the Center.That survey fomld that 78.2 percent of the noninst,itutionalpopulationunder age 65 reportedt.hat they had hospital insura nce, 20.5 percent,reported that they did not have such insurance,and 1.3 percent did not, know whether they had3 Louis8. Reed and WillineCarr, ZudcpcndcntHcalflrPlansin 1968, PreliminaqjE’stinratc n, Officeof Research and Statistics.Research and StatisticsNoteSo. 17. 1969.Znaurancc
insurance or not. Analogous results for surgicalinsurance were: ‘76.6 percent with insurance, 21.9pcrcelit without insurance, and 1.5 percent whodid not know. In both cases t,he “don% knows”were distributedin the same proport)ion as thosewho reported having or not having insurance. Theresulting data were then adjusted to apply to thetotal civilian populationon the assumption thatnone of the institutionalpopulationhad insuri\llW.(ThisiLS IlIIlptiOl1,ofcourse, is not fullyvalid since some of those in institut,ions, particularly those in nursing and rest homes have insurance. h’o reliable data on this point are available,but it is believed that the overall proportionisslll: ll.)4 The data were next, adjusted to reflectthe situation at, the end of the year, with theprobal le growth in coverage during the yeartake11 into i\c onllt.For insurance coverage of persons aged 65ant1 o\‘er, no data from the 1968 household survey are available. The 1968 figure for the agedsllown here is an estimate based on the findingsof tile household survey during the period tJulyI)cceml)er 1967 and on the increase in gross totalenrollments bet.ween the two periods.It will be seeu that the gross total enrollmentsfor hospital care coverage among the populationunder age 65 is 12X percent of the number of persons with hospital insurance as found by the 1968K(‘FIS survey. The analogous ratio for surgicalservices is 12X percent. The estimates of the netnunlber of persons with coverage of the otherservices have beeu made by assuming the ratios ofgross enrollmentsto the net, number covered.These ratios are believed to be reasonable, whenone takes into account the fact that the extentof multiple coverage is apparently much greaterfor hospital care and surgical services than it isfor tllc other it,enls of health care. The ratios usedwere 110 percent for physician in-hospital visits,107 percent for X-ray and laboratory examinations, 105 percent for physician office and homevisits, drugs, private-dutynursing, and visitingnurse service; it was assumed that there is as yetno multiple coverage of dental care.The corresponding estimates of net nymber ofpersons aged 65 and over who have coverage of* The snrvry of the aged nlade by the Social Security- \dlllinistratiollof aged personsBULLETIN,in 196.3 foundin institutionsDECEMBER 1969that less thanhad any health10 percentinsurance.services other than hospital care and surgery aredeveloped in a similar manner but with a lowerextent of multiplecoverages assumed. Theestimates for persons of all ages have been madeby adding together the estimates for personsunder age 65 and for persons aged 65 and over.Comparison with the HIAAestimates is provided here since in the past they have been theonly annual est,imates of the net number of persons with health insurance coverage. The HIAAmakes estimates only for hospital care, surgicalexpense, and what it, calls “regular medical expense’? or “nonsurgicalmedical expense”-thatis, basic coverage of physician visits in the hospital, of physician visits in the office, home, andhospital, or out-of-hospitalX-ray and/or .laboratory examinations.In I the past it has beenassumed that’ the number with this coverageequaled the number with coverage of in-hospitalphysician visit,s, but, this assumption is less certain now.The HIAAest,imates are based upon data ongross enrollmentsthat approximatethose reported here5 and on its own estimates of t,heextent of multiple or duplicatorycoverages. Overthe years, the HIAAestimates have generallyrun consistently higher than those based on household-interviewsurveys. G It should be noted, however, that the recent HIAA estimates for personsaged 68 and over are lower than the estimatesbased on household-interviewsurveys.The difference between gross enrollments andthe est)imate of the net number of persons coveredcould reflect (a) the extent of multiple or duplicatory coverages, (b) overestimationof their enrollment by I3lue Cross-Rlue Shield plans or ins HIAA data for insurancecompanies are those givenhere: its data for Blue Cross-Blue Shield plans are notderived from official sources and differ from those provided to the Office of Research and Statisticsby the BlueCross and Blue Shield nationalassociations;the datafor independentplans are those provided by the Office ofResearch and Statistics.extent that HIAAadds tokenestimates of the number of students covered under collegeand universityhealth services.(The Office of Researchand Statisticsexcludes these students because they arenot covered the year around nlywhile on campus.)(i Fora detaileddescriptionof the sourcesandmethodologyof the HIAA estimates and possible explanations of the differencesbetween these estimates and thefindings of household surveys see Louis S. Reed, The Exfcnt of HealthInsuranceCoverage in the UnitedStates(Research Report No. lo), Office of Research and Statistics, Social SecurityAdministration,1965.-23
4.-PercentageTABLEdistributionof total gross enrollmentI !Age sicianservices--r-- .100.0 . II100.0I100.0I100.0l36.4/35.1/7L 27.2/.total. . . . . .100.0 . . BlueCross-BlueShield. . . . Insurancecompanies. . . . . . . . . . . . . Grouppolicies. . . . . . . . . . . . . Individualpolicies. . . . . . Independentplans. . . . . . . Aged65sndover,totsl.-.-.- . . . 35.760.640.620.03.7loo.0- 0100.0100.0loo.0- ntof the numberBlueShieldplansdonotmain-of dependentsunderfamilycontractsbutmakeestimateson the basis ofsami)le grou:)s. Insurance companies uncler group policiesnever know the precise number of dependents covered butestimate the number on the basis of assumed factors ofdependents per employee with dependent coverage. In bothcases, enrollmentfigures are thus approximate.With respect to individualpolicies,some insurancewmpaniesdo not maintainprerise counts of the number of policyholdersand familydependentsand may orerestimateenrollmentby failingto take accurate account of .025.368.862.95.96.061.031.x17.714.07.2loo.0- 45::loo.0100.030.260.054.8undersurance companies,7 or (c) underreportingthe household surveys.It should be understoqd that exact precisionin stating the number and percent of the population having health insurance is not now possible.,411 figures are approximations.Table 4 shows the percentage distributionofgross total enrollment, among the carriers in 1968.For persons of all ages, Blue Cross-Blue Shieldhas R6 percent of the total enrollment for hospitalcare, insurance companies 60 percent, and independent. plans 4 percent., with enrollment undergroup policies of insurance companies about. twicethat under individualpolicies.These relationshipsvary among the differentservices. The share of Blue Cross-Blue Shieldplans in t,he total is smaller for most of the ot,herservices (except, nursing-homecare) than theirshare of hospital care enrollment;for insurancea preciselM).O17.578.271.96.24.4.653.752.9i Mosti-Visitingnnrse17.9::::----loo. hield.Insurancecompanies.Grouppolicies. . .Individualpolicies. ospital)--/---Undersge65,1968of plan. . . . .-./by age group, among 12.7100.0loo.034.953.749.14.711.4x5.x::i 7Y.h-companiesthe share for the other services isunder individualpolicies ofsmall for servinsurance companies is relativelyices other than hospital care and surgical services.The share of the independent plans is larger forot,her services other t,han it is for hospital care.hlmost half of the enrollmentfor dental carcais in the dental society plans.Among the aged, Blue Cross-Blue Shield p1a11 have a larger proportion of the total enrollmentsfor hospital care and surgica,l services &an insm ante companies have. The majority of insurancecompany enrollment is under individualpolicies.For most of the other services the carriers’ sharesof enrollment are diflerent:the Blue Cross-I3lucShield plans have a smaller proportion,the l)ercentage covered under group insurance polick1s greater, and t’here is relativelylittle coveragcbunder individualpolicies.It will be noted that all these data are presented in a different way than they were in theearlier articles in this series. This year the grossenrollment for insurance companies is the total ofthe enrollments under group and individualpolicies; in previous years the tota enrollmentreported for insurance companies has been theHIBb’sestimate of the net number of personscovered by insurance companies, after deductiollfor duplicatingpolicies among insurance conpanies.greater.EnrolhentSOCIALSECURITY
HistoricalDataData on enrollment of health insurance organizations and estimates of the net number ofpersons who had some coverage of hospital careand surgical services during the period 1940-68are presented in tables 5 and A. These figures arediflerent from those that were shown in previousyears in two major respects: First, the grossenrollments are the total of enrollments for allcarriers-thatis, with no dedtict,ion for duplication among insurance companies; second, dataare shown on net. number of persons covered asshown by various household surveys from t,ime totime during the entire period.The major trends in enrollmenthave beenrepeatedly described in previous articles. Growt,hof Blue Cross-Blue Shield enrollment, continuesat about t’he same rate as in recent years, as doesTABLE5.-Hospitalbenefits:Gross enrollment.and estimatesenrollmentunder group policies of insurancecompanies. Growth in enrollmentunder individual policies of insurance companies seems tounder the combe slowing down. Enrollmentmunity independent plans cont,inues to expandplans, it apSlOWl ; under employer-employeeThe current Office of Reljexrs to be declining.search and Statistics survey of independent planshas found that many formerly self-insured groupshave taken out coverage with Blue Cross-BlueShield plans or insurance companies.The fairly constant difference of several percentage points bet.ween the proportionsof thepopulationwith insurance as indicated by thehousehold surveys and by the HIAAestimatesstands out clearly. A new feature in the series isthe ratio of the gross total enrollments to t,heestimates of net e&ollment, by HIAA.The HIAA estimates made no adjustment forof net number of differentpersons covered,all ages, 1940-68[In thousands]Gross niesI,Independentplansnumberof differentpersons covered,as estimatedby-of 39,41:41,3&43 ) 68,109,21118,6i128, Fi134 ( 93.5:57,9659,6160.6962,4263,66&,a67,5170,51’ Numberof personspopulation.Percentages1967 and 1968 data.BULLETIN,estimatedprojectedDECEMBER 1969by applyingpercentagesto total civilianto end of year and rounded,except for? HIAAestimateexceeds gross enrollmentdata includeestimatedenrollmentof collegefor early years because HIAAand universityhealthservices.25
enrollments and estimates of net population covered for the two age groups are therefore suppliedin tables 7 and 8. To provide a background fordata since the inaugurat,ion of Medicare in mid1966, figures since 1960 have been developed. Forthe populationunder age 65, gross t,otal enrollments for hospital care rose 24 percent between1962 and 1968, and enrollments for surgical careincreased 25 percent. During the same periodthe increase in the net number of persons withcoverage, as measured by the household surveys,was 19 percent, for hospital care and 21 percentfor surgical care.The number and percentage of the populat,ionaged 65 and over wit’11 private health insurancereached its maximum in 1965; it) fell off with theadvent of Medicare.Total enrollmentswere,however, only 18 percent, less at the end of 1966than they were at the end of 1965-an indicationthat the great majorityof older persons whoduplicatorycoverages-morethan one policy orcontract held by any one individual-before1947.The Associationbegan making deductions forduplicatorycoverage in arriving at, its estimat,esin that year. Its estimate of the proportionofduplicatorycoverages, as shown by the ratio ofgross total enrollments to the estimated net number of covered persons, gradually increased untila level of about 114 percent was reached around1960. This ratio, as found by the various household surveys, is much larger-runningat, thelevel of 120-130 percent for hospital care ,and110-120 percent for surgery.As mentionedearlier, some of the difference between gross enrollments and net covered populationfound byhousehold surveys may result from overstatementof enrollments.Because of Medicar
Private Health Insurance, 1968: Enrollment, Coverage, and Financial Experience by LOUIS S. REED* .IT THE ENI OF 1968, private health insur- ance organizations gave some protection against . health insurance in 1968 amounted to 11.3 bil- lion, almost, 20 percent higher than the 1967 total. In 1968 health insurance organizations paid out .