Transcription
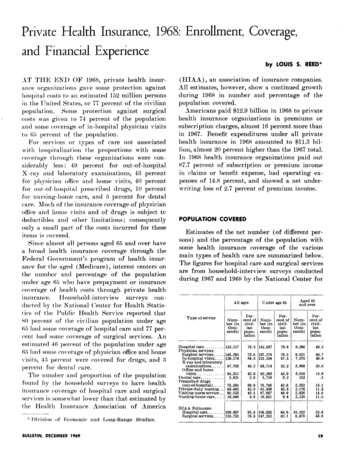
Private Health Insurance in 1973: A Review ofCoverage, Enrollment, and Financial ExperienceIby MARJORIE SMITH MUELLER*In 1973, about three-fourths of the civilzan population were covered by private health insurance forsubstantzalportaons of their costs for hospital andsurgwal care. Lesser numbers u?ere cotiered at least6% some part for other health care costs, usuallyafter payment of deductibles and coznsurance.Privateinsurersreturned 21.6 billion (or 88 percent) of subscribers’ premiums in the form of suchpayments.Insurancecompanies continuedto dominate the market in providingcoverage for hospitaland physicians’ services, prescriptiondrugs anddental care, and most nursing serticesThe economx stabzlixatzon program continued tobe a factor throughout 1973 in. the slower rate ofgrowth of both income and benefits. The gap between growth rates of income and benefits narrowed, as well.IN 1973, 3.2 MILLIONmore Americans gainedeconomic protection through private health insurance against their costs for hospital care; 2.34.2 million more persons gained some coveragefor physicians’ services and health care servicesprovided outside the hospit,al.The health insurance industry-BlueCrossBlue Shield, the insurance companies, the independent community, employer-employee-union,and private group clinic plans, and health maintenance organizations(HMO’s) -meta highproportion of hospital and surgical care costsfor three-fourths of the population and a mideranging portion of expenditures for other sortsof medical and health care for smaller proportions of the population. Insurance paid for mostof the cost of in-hospital physicians’ visits andout-of-hospital X-ray and laboratory examinations in behalf of ‘73 percent of Americans.Thirty-four percent had some coverage for homeand office visits, 60 percent for prescribed out-ofhospital drugs, and 10 percent for dental care.A third of all Americans had coverage fornursing-home care ; 57-59 percent had some protection against the costs of other nursing services.*Divisionof HealthInsurancesearch and StatisticsThe authorA. Piro.BULLETIN, FEBRUARY 1975Studies, Office of Rewas assisted by PaulaThe trend toward broad comprehensive coverage of health care services is unmistakable. Thedepth of coverage, however, is a function of benefit levels, exclusions, restrictions, and dollar costsmet. Konhospital related services covered byprivate health insurance plans are almost alwayssubject to deductible and coinsurance paymentsby the insured. Hospital and surgical care plansfrequently have age limits, deductible and copayment provisions, and/or maximum payments forservices. Hospital coverage usually has somelimitations with respect to duration of benefits,kinds of illnesses eligible for care and treatment,and other special conditions; surgical coverageoften involves waiting periods, restrictions onspecific services or conditions, and exclusions.Virtually all persons aged 65 and over havehealth insurance coverage, mainly through theFederal Government’s Medicare program. As ofJanuary 1, 1973, the total number enrolled forhospital care under Medicare was 21.0 million ;for supplementary medical insurance the numberwas 20.4 million. These figures are based on anactual count from the health insurance entitlement master file. In 1973, 12 million (57 percent)of the aged bought private insurance, in mostcases to supplement or complement their Medicare coverage. Private health insurance plans forthe aged mainly fill some or all of the gaps inthe Medicare program-deductibles,coinsurancepayments, drugs, etc.Despite the growth of private insurance in thehealth care field, an est,imated 41 million Americans under age 65 have no economic protectionthrough private insurance against hospital costs;42 million have no insurance for surgical cate.The health insurance industry’s own estimatesare much lower: 17 million without, hospital insurance, 28 million without surgical insurance.Undoubtedly, some Americans who could affordto buy private health insurance choose not to doso. Many other persons receive assistance withthese costs through such programs as Medicaid(medical assistance), the civilian health and21
medical care program for the uniformed services(CHAMPUS), the Veterans Administration programs, State disability insurance programs, andworkmen’s compensation.In fiscal year 1973, for example, Medicaid payments were made in behalf of an estimated 20.9million persons. These were, for the most part,children (45.2 percent) and the poor, includingpersons aged 65 and over (16.8 percent). Someof the latter were undoubtedly covered by Medicare; their Medicaid payments were for care notauthorized under Medicare. Some Medicaid recipients may also have had private health insurance that did not cover all their care or hadexhausted their benefits. It is known, however,that in 1974 the Meclicaid program still excludedan estimated 9 million poor persons. Only 40percent of the poor in the labor force had evenlimited private insurance against health carecosts, and fewer than 10 percent had insuranceagainst nonhospital services.l Because the degreeof overlap in coverage by public and private plansis not known, the number of persons who have noeconomic protection against health care costs isnot easily determined.Office of Research and Statistics (ORS) estimates of the net number and the proportion ofthe population having private health insurancecoverage for hospital care and surgical servicesare used in this article together with the estimatesof the Health Insurance Association of America(HIAA).Both sets of estimates shorn a continued growth during 1973 in the number andpercentage of the population covered. The readerwill note that the ORS and HIAA estimates arefrequently several percentage points apart, probably due to differences in reporting methods. Thetrue figures lie somewhere in the range betweenthe two sets of estimates.Consumer expenditures for private health insurance in 1973 totaled 24.5 billion in premiumsand subscription charges, up 9.7 percent from1972. Benefit expenditures by pkivate health insurance organizations reached 21.6 billion, 10.7percent higher than the 1972 total. The organizations paid out a little more than 88 percent ofpremium income in benefits and 13.7 percent went’ apterThe 1975 Budget, Thefor operating expenses, with a resulting netunderwriting loss of 1.8 percent of premiums.POPULATIONCOVERAGEORS estimates of the net number of differentpersons and the percentage of the populationwith private insurance coverage in 1973 for hospital care, various physicians’ services, and othermajor types of care are summarized in table 1.Although more than t,hree-fourths of the population mere covered for hospital and surgical careand close to that proportion for most other physicians’ services, the actual dollar protection forthese services ranged widely: 75 percent of allconsumer expenditures for hospital care was metby private insurance but only 48 percent was metby insurance for physicians’ services, and only 7percent for other types of care. The small proportion of reimbursement for the latter reflectsnot only the proportionately lower rate of coverage-only10 percent of the population hadcoverage for dental care and only 34 percent hadinsurance for physicians’ home and office visitsbut also the limited benefit levels for such services. Until basic health insurance plans becomemore comprehensive in scope and/or major medical insurance and extended benefits are moreTABLE1 -Estimatesof net number of different persons underprivatehealth insurance plans and percent of populationcovered, by age and specified type of care, as of December 31,1973ITypeAll gxalservices-.Undersge 65.of vices.In-hospitalviskx-.X- ray and laboratory examinations --Office and homevlslts - -.-.IPercentof ci ihenz::tionNbuem(inIAged 65and overPercentOf civilian%?(inthouands)tbousands)sptlon--75 8146,08978 012,38667 475 173 4145,352144,69277 677.211,6618,869E!152,79773 1143,99576 98,80240 870,03821,62633 610 4Z:%35 211 44.158234‘ff124,971118,80569 866 9120,987115.175%3.9343,6302iiii:117,87262,62162 93344,8166,53122 330 9169,416SOCIALSECURITY
widely held, the bulk of the cost for these healthcare services will continue to fall directly on theconsumer.son not eligible for group coverage holds two ormore individualinsurance policies, usually tosupplement each other because of limited benefits.Blue Cross plans over the country had 72million persons under age 65 enrolled for hospital care at the end of 1973 (table 3). BlueShield plans had an additional 2 million personsenrolled for that type of care. The commercialcarriers covered 82 million persons under grouppolicies and an additional 47 million personsunder individual policies. Independent community, employer-employee-union, and private groupmedical clinics provided hospital care for anestimated 8.6 million persons.The gross enrollment for surgical care approached the level of hospitalization insurance.Blue Shield plans accounted for 64 million persons under age 65, with nonaffiliated Blue Crossplans reporting an additional 3.7 million persons.Group insurance policies issued by the companiesaccounted for 83 million persons; an additional34 million were covered by individual policies.Independent plans covered above 11.5 million. Thevast majority of their enrollment is throughemployment, groups-onlya small percentage enrolled through individualmemberships. BlueCross-Blue Shield enrollment figures include bothgroup and nongroup subscribers.ENROLLMENTGross enrollments-thetotal numbers of persons enrolled by all types of health insuranceorganizations for each of 11 services-are reported-in tables 2-4. Estimates of the net number of diferent persons covered-wit,h duplication withinthe industry and among the insurers eliminatedare reported as calculated by ORS and by HIAA.The gross enrollment for persons of all ages forhospital care was 225 million (table 2). According to ORS projections of the 1972 HouseholdInterview Survey, 158 million different personswere covered for hospital care in 1973. Thus, 67million or approximately 30 percent of grossenrollment represented multiple or duplicatorycoverage. HIAA estimated such net coverage at182 million. Multiple coverage occurs chiefly inthese ways : (a) When both spouses are employedand both have group insurance through theiremployer ; (b) when a person with group coverage purchases an individual insurance policy tosupplement his group plan; and (c) when a per-TABLE 2.-Enrollmentunder private health insurance plans for ersons of all ages and estimatespersons covered, by type of plan and specsed type of care, as o P December 31, 1973ITypeHospitalcareof inationsl-4Pre-officend homevisitsDentalcares %ii(out f.ospital)225,948207,124-Blue Cross-BlueShield74”.l3;;;%:Blue CrossBlue 3,45984,026oroup0lides -- ---B ual up clinic‘145Dentalservice corporation- -. .---- -numberof differentpersonscovered, as estimatedbyORSPercentof civilianpopulationr----RIAAPercentof rvicey elxcarevisioncare---gross enrollmentof different[In thousamls]8ervicesTotalof the net 5.4171,7283,99911:22n6,9305,145145. - 5597;:;gJL7522.0697:9136.2182:99o2.6352010. .x2‘7767%‘i 7;2,yg. --Netenrollmentas percentof differentersons coveredas estimatedbyois- - - I - - -- -- -HIAL:.::.:-:- --153,48173 4158 124c:i118i?i8 1 1 2.0123.6132.0122.3118.0119.0118 8Cl163 5PIloo 0(9.e. .w *e.mm .v*w-r Datanot available.BULLETIN, FEBRUARY 19753 Basedon Bureauof Censusestimateof 203,954,COO as of Jan.1,1974.23
A total of 13.3 million persons aged 65 andolder were enrolled for hospital care, 5-11 millionfor various physicians’ services (table 4). Only4 millionwere enrolled for drugs. Most privateinsurance coverage was purchased by those aged65 and older in an effort to fill the gaps in theTABLE 3.-Enrollmentunder private health insurance plans for persons under age 65 and estimatespersons covered,by type of plan and specified type of care, as of December 31, 1973[In thousands]TypeHospitalc*reof plan3urgiCalservicesservicesx :-rayInh;;tg81Igross enrollmentBlue Cross-BlueShieldBlue CrossBlue ShieldInsurancecompanies.licles - - - -------- ----8”ual policiesEi?IndependentplansCommunity- - -- -- - .Employer-employee-unionPnvategroup chnic. .Dentalservice corporation.211.765:d%1:917.,.numberot differentpersonscovered, as estimatedbyOR8 .Percentof civIlianpopulationz---HIAAPercentof 16,850a .;;;11:4626,6726,664126-* -- - .Z%10:5475,6724,749126.-- . -.146,08978 .2143.15576.4Grossenrollmentas ,7664:963126143,99576 965,88035 2‘2 2113:9132,175123. . -b:OfB1.6483,4328.1;,67;6,5626,471126.- -- -- - .-145 0124 4134 9123 0118 8120.0loo. 0(9f Basedon Bureauof the Censusestimateof 187,370,OOO as of JanTABLE 4.-Enrollmentunder private health insurance plans for persons aged 65 and over and estnnatesferent persons covered, by type of plan and specified type of care, as of December 31, 1973[In thousands]Physicians’-xof plankrgicalservicesgross enrollment13.283---L-Blue Cross-BlueShield I7,484Blue Cross.-.-.---.---. .------.-----7,;;Blue Shield loyee mployer-union.“iiPrivategroup chnrcDentalservice corporationnumberof dif?erentpersonscovered, as estimatedbyORSPercentof cw hsnpopulations.HIAA.Percentof i;.-ray‘ d9,902OffiWand homevisits3%19.-- -of difInursingVisiting- kI,42:SOS306676of the net number1,1974.-i-services-Total6,8188!)3807¬ available.Type63,873of differenlO - - r’ra -e -t- t byTHIAA::.: ::.:::.:1 reOWceand ,10982,27246,8378,5993,3566,119124- .and‘“tE:xaminations-Totalof different--rPhysicians’of the net number477--102vbE2,5021,6161,4042259 18178IP9178- .4622“E2430fii12-.- -.047.-.----emNetenrollmentas percentof differentersons coveredas estimatedbyOL -------t-------- l 1 1100.0(‘1102 0(9. --. -- - -.- ---Cross107.2112.395 3110.6112 5(‘1115.7(9102(9aI. --1 Includes2 Mainly24disabledcoveragepersons under age 65of Medxaredeductibles.1 Data not available4 Based on Bureauof theCensusestimateof 21,584,COO as of Jan.1, 1974.SOCIAL SECURITY
TABLE L-Percentage distributionfied type of care, as of Decemberof total gross enrolhnent31, 1973PhysIcfans’Age groupTotal,andtypeof planall ages .Blue Cross-BlueShieldIusurancecompanies-Group policies .Individualpohcies .Independentplans .Underage 65, total-Blue Cross-BlueShieldInsurancecompanies.Qroup pohcies ---- -- - .IndwidualpoliciesIndependentplaIlsAged65 andover,total.-.Blue vi 8”ual policiesIndependentplans-3Hospitalweloo 036 269 737 122641In-hospitallcta 036 367 9;10736under privateservicesloo 0VisitingnurseserviceDental reii!i!3i:Nhyzeecareloo 0loo 01M) 0loo 0loo 030 259 952 3!J i29130567.1ii:F%i!8”;68626’5ii39 i::iiloo 0loo 0loo 0loo 0190 0190 0loo 0loo 035 061 038 922140346‘E :38 1.E i32 7tit29 261 1;y %2886267 8229 7ii:53941 9!o”‘6’ i‘oe :“i 42 :E-7:9739 Ii:t190 0loo 0109 0loo 0loo 0loo 0loo 0Ei11 67212 887 960732 529 468317” i76 1i 6-62 549 035 863749 048 76627 6310 66116 7lo” :103 86 .---- .- 3966 339 43: :43SharesDataFor all ages, insurance coverage for hospitaland surgical care-in terms of total enrollmentsBULLETIN, FEBRUARY 1975I34 369 2“ii 2Private insurers continued to share the marketon about the same basis as in 1972 (table 5).Insurance companies held well over half the totalgross enrollment for all types of care exceptnursing-home care. Enrollment in individual policies was substantial for hospital and surgical carebut represented only a fraction of group coveragefor all other services. Blue Cross-Blue Shield. claimed 2840 percent of the enrollment for allservices except dental care (8 percent) and nursing-home care (57 percent). Independent planshad only 4 percent of the market for hospitalcare and drugs, 6-10 percent for physicians’ services, and 40 percent for dental care. The distribution pattern was about the same for enrollmentof persons under age 65, but Blue Cross-BlueShield dominated the market with respect toenrollments of persons over age 65, except inthe area of drugs, dental care, and private-dutynursing.HistoricalOfRce andby age, type of plan, and speci-plans,loo 0%Medicare program-deductiblesand coinsurancepayments, as well as at least some of the servicesnot covered by the Federal program.EnrollmentIlaboratory8health insuranceE-3013 04 4 ----:i%i:4loo02by type of insurer and the net number of personsand percentage of population covered from 1940to the present-is detailed in tables 6 and ‘7. BlueCross-Blue Shield enrollment rose 4 percent in1973. In the previous 7 years, the annual gain was3-5 percent, except in 1971 when the increasedropped to 1 percent for hospital care and 2 percent for surgical care. Insurance company individual policies continued to grow at a faster ratethan group coverage-6 percent for hospital insurance and 8 percent for surgical services, compared with a 1-2-percent gain in group policies.In 1973, HIAA again revised downward itsestimates of net coverage for 1965-72 to reflectmore current information with respect to theextent of duplicate coverage and to take intoaccount revised estimates for nonreporting companies. The remaining several percentage pointsdifference betTyeel HIAA net estimates and estimates based on the household surveys probablyresult from a combination of overreporting byhealth insurance organizations and underreporting in the household surveys. Thus, gross enrollments for hospital and surgical care, as estimatedby HIAA, have been running 15-23 percent aboveHIAA’s net in the 10 years before 1973, and thehousehold interview estimates have ranged from28 percentto 41 percent above the National Centerfor Health Statistics (NCHS) net for hospitalcare and from 20 percent to 31 percent abovenet for surgical benefits.25
TABLE 6.-Hospitalbenefits: Gross enrollment under private health insurancenet number of different persons covered, by type of plan, 1940-73plans for persons of all ages and estimatesof theIIn thousands]II“,“pye ndependentcompaniesplans‘,1”,!-TotalBlueI Weldenrollments;71tpTotalua1policiesCiCSdedial 422.30539,02985,405EEi ;gKE7&0581,6412,6003.70010.50439,601E3.160i%;i ;g 6440.06542.0082%&0:879TABLE7.-Surgicalbenefits.of Gross8067i.-.-- . ---615320g4660140129,800BlueCrossTotal- -73 975 9--ij-8-----: 96207,1241 See footnote2672 373 4-114 6114 1:20’114 9476 6;; ; :-:---- ----116 1116 4ii;116 i6::::;;:i:; :136 2;;::i;120 6i123122 6in net enrollmentplans for persons of all ages and estimatesnumbercovered,of differentas 9503.2002%18: 684;.3 E3:4w;.g8: .2502,420---Householdsurveysplansfromof theQrossenrollmentersonsE 3067,91660,44363,2792x!70):39572,43375,1361, m;;4:09871:03878,516In- 1Per-Percentofcfivz-Number“ztNumberi% :;p;95: E33: 23135,830footnote2, 014,5004,4766,300110%za:ooo6,057E“210. - -. ---. -.- -. -. . . .Hfo idby-HIAA1, - 2,89054,16638,856-mm-v.*,, --.I: : 1970.197L.1972-m.1973*.106112 8583 684 985 6172,306176,800178,417182,079Ii10097 2:t167:858.--ii:in 5--j - -- -145,454150,888-i -osj-NetCrossBhleldTotal1955.2:FJI---I 612,a1232,06876,639105.452mates for 1965 and later years have been revised.* Estimatedby alying HIAApercentageIncrease1972 to 1973 to the w CHS figure for 1972enrollmentsEndOfyear19s.L:- --------*0EP,BlueBlue:%--I-l-- -- ---4.790;;a;ationpeoz60126,04767 0188 - -61 -- *itiunderprivate health insuranceby type of plan, 1940-73-Numbe]al - - 130,007Eienrollmentpersons 1LniC1,4456,646 2,9M6,994:%:7,1026,937 1:830;a& 1,9541,8596:9841 Numberestimatedby applyingpercentagesto total cvihanpopulationPercentagesprojectedto end of year and roundedfor 1962 and 1973s Estimateexceeds gross enrollmentfor early years becauseHIAAdataincludeestimatedenrollmentof college and universityhealth servicesEsti-net number1Percentofc;z-------PriTtEp4 1 - --9 635 8 I -*- - .89 593 8I loo 364 0 . 114 6I;;;A 65 212Oo:b2865 0,----- -- -- - -- -- -- -;;f:;:;E:;4”;:E 113 969 7114 6148:082iii-osi -- 6164.81974 9768g ;121 11200-iis-s‘116 3:;; ;g-ii -s-;;;‘iii-; -iii-i.156:913-- -o‘7472 25-- --73 9- ----7673 16134:440n;,;;;;81.1:z8 See footnote3. table132 0:122 36.SOCIAL SECURW
HouseholdInterviewSurveysThe net number of different persons and thepercentage of population covered, for personsunder age 65 and for persons aged 65 and older,are presented in table 8. The estimates are basedon household interview surveys conducted by theNCHS in 1962, 1967, 1970, and 1972 for hospitalcare and surgical services, and in 1970 and 1972for physicians’ visits in home and office. Figuresfor 1973 are ORS projections of NCHS 1972findings.Data with respect to those aged 65 and overare significant in that they show a sharp drop inprivate insurance coverage in the first full yearof Medicare but a steadily rising number andpercentage of that age group buying health insurance since that period. As noted earlier, privateinsurance plans available to those aged 65 andolder are designed primarily to complement theMedicare program by filling the gaps-deductibles, coinsurance payments, and in some instancesservices not paid for by Medicare. Other plans,however, provide flat weekly or monthly payments to the aged-only if they are hospitalizedto be used by the insured according to his financial needs.Benefit *StructureThe benefit structure of private health insurance continued to broaden in 1973. Ss table 9shows, the net coverage is expanding steadily inthe nonbasic type of benefits-drugs, dental care,nursing services, X-ray and laboratory examinations-havingmore than doubled for all ages inthe past 11 years in every one of these categories.Dental insurance increased 21 times ; nursinghome care covered 14 times as many persons. Forpersons who are under age 65, the expansion intononhospital, nonsurgical benefits reflects primarilygroup coverage of workers where unions havenegotiated comprehensive and supplementarymajor medical insurance plans, extended-benefitsplans, and supplementary major medical plans byBlue Cross-Blue Shield, and comprehensive grouppractice prepayment plans. A good portion ofthe expansion in dental insurance, however, canbe claimed by the independent dental servicecorporations, which have grown rapidly in thepast several years.BULLETIN,FEBRUARY1975TABLE 8.-Benefitsfor hospital care and hysicians’ services:Net number of different persons covered, g y age, as estimatedby household surveys, 1962-73[NumbersIn elservicesIYearOWce andhome visitsPeroetent lent f;‘;;tion-1962. - - -.;66i&:::.:-:1970.:.:.1972 --.1973 --Aged1962 ----1967 ---1970 - ---1972 - 1973 - --- -54 19,1258.64710,45211.9441 12,3367,7928,3769,49611,203;: :66’ 4’ 67.4I65 andr11.561over46.2 .44.1 . --- --17.3!Ey 19.1 53:6’ 4:15319.311 Estimatedb 972 to 1973 to rs CHS figures for 1972f In the CurrentMedicareSurveyof the Social SecurityAdministration,69.9 percent of those enrolledfor su plementarymedicalinsurancewere reorted ss havingprivatehospitalPnsurance,50 4 percentas havingsurgicalas of Jan 1, 1974PnsuranceSourceData reportedby variousNationalCenterfor 62-72Major MedicalCoverageTable 10 reveals, for persons of all ages, theannual growth since 1960 in the net number ofdifferent persons under major medical plans byinsurance companies and in the total Blue CrossBlue Shield enrollment for such coverage. Insurance policies are written as supplementarymajor medical or comprehensive group policies,with the ratio more than 2 to 1 in 1973. Coverageof Blue Cross-Blue Shield plans written as majormedical plans supplementing a basic policy outnumbered comprehensive extended-benefit planscoverage 10 to 1.In 1973, almost 83 million different personswere covered by insurance companies under majormedical plans; Blue Cross-Blue Shield plans covered about 37 million persons. About 10 millionmore persons were covered in 1973 for majormedical expense than had such insurance in 1972;73 percent of the expansion occurred in Blue CrossBlue Shield plans. Although insurance companiescontinued to write more than twice as much majormedical coverage as the Blue Cross and BlueShield plans, the commercial carriers’ share of27
9 -Estimatesof the net number of differentage and specified type of care, 1962-73TABLEpersons under nsuranceIplans andpercentof populationIIIof year.Nyg mr(in thousands)-- ----.1965 -- - - -- ---- .;;w-;- - - --.- - - - --- ----.1968.-.-.-.---------.1969.-.---------. !g.- - - -- - -- - - --- -.- - ---------.1972.---.-.---------.1973. --- - ---.Pyg2ytof civilianpopulationI:;‘3”19 454(‘1lb! 174133: 914145,689148.614l(i.26312 253l&475:; : :70 0 1 173 967,8328 68770:03s65 035 07224148 0247 0[i,’(‘I75?la 6671 756497062 2t:h4(I)73 675 172 2373 4:; :73 1(‘I32 733 59(‘I74 975 aUnderNy erI%611liI.5051’411 309146:089l!? 448145:35277 078 975 277 6(‘I736(‘)77 078 0(‘I76(I)76 077 6Number(in thousands)1967. 1970.--.-.-.-.---.----1971 - -1972-1973-. -- - --- ---P”;9”6”7”” of civihanpopulatron-- -- --- I19691970- - - - ---1971 -1972.1973-.- --- --- - ----’?Gyg10,452(1)11,94412,3868:80245 044151 446 7(‘)56 457 418 720 638 337 437 336 6408(l)b2 9536‘1 0454:158xi3:934(9(‘i93119 32.3812,1254,0825,021El.2026,4736. b312,4702,8262,2232.176K:4:0254,4884,8161::14 9::16 i21515161815151616996588a3131417181906684;5 zlb 211 0iii”725 025 830 3not availablethe market has been slowly diminishing since1068 when they held almost four times as much.Enrollmentin Group-PracticePrepaymentPlansEnrollment in independent group-practice prepayment plans for the period 1053-73 is shown283,5181.8382,5322,9253,230t417241El465 and over3,6543,9898,376(‘1fit13161821a3iif58 0646Aged8,547f%Z115:17539 042 847 950052 2fM873 874 476 176 1,694143,995133,706139,061136.907141,572I-1 Dataage 65(in ---1970. - --- -.-.--------Percentof -1972- -- --- -1973 -- - -38,63645.46069,15226 027 633 736 239 944 749 762 163759 8(‘1 1 73 218,51012,21015,34817,90421,626in table 11. Enrollment for
health insurance coverage, mainly through the Federal Government's Medicare program. As of January 1, 1973, the total number enrolled for hospital care under Medicare was 21.0 million ; . TABLE 2.-Enrollment under private health insurance plans for ersons of all ages and estimates the net number different persons covered, by type of plan .