Transcription
TSX: ALSInvestor Day - May 2021Renewable Energy Clean Steel Potash Copper Lithium Nickel Cobalt
FORWARD-LOOKING STATEMENTThis document includes certain statements that constitute “forwardlooking statements” and “forward-looking information” within themeaning of applicable securities laws (collectively, “forward-lookingstatements”). Forward-looking statementsinclude statementsregarding Altius Minerals Corporation’s (“Altius”) intent, or the beliefsor current expectations of Altius’ officers and directors. Such forwardlooking statements are typically identified by words such as “believe”,“anticipate”, “estimate”, “project”, “intend”, “expect”, “may”, “will”,“plan”, “should”, “would”, “contemplate”, “possible”, “attempts”,“seeks” and similar expressions. Forward-looking statements mayrelate to future outlook and anticipated events or results.By their very nature, forward-looking statements involve numerousassumptions, inherent risks and uncertainties, both general andspecific, and the risk that predictions and other forward-lookingstatements will not prove to be accurate. Do not unduly rely onforward-looking statements, as a number of important factors, manyof which are beyond Altius’ control, could cause actual results to differmaterially from the estimates and intentions expressed in suchforward-looking statements.Forward-looking statements speak only as of the date thosestatements are made. Except as required by applicable law, Altius doesnot assume any obligation to update, or to publicly announce theresults of any change to, any forward-looking statement containedherein to reflect actual results, future events or developments,changes in assumptions or changes in other factors affecting theforward-looking statements.Non-IFRS MeasuresAttributable revenue, adjusted EBITDA and adjusted operating cashflow is intended to provide additional information only and do nothave any standardized meaning prescribed under IFRS and should notbe considered in isolation or as a substitute for measures ofperformance prepared in accordance with IFRS. Other companies maycalculate these measures differently. For a reconciliation of thesemeasures to various IFRS measures, please refer to our ManagementDiscussion and Analysis. 2
Cyclical Thoughts
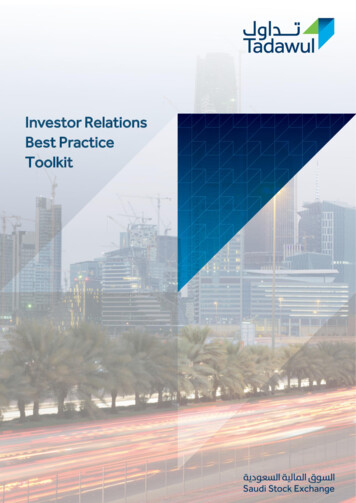
Dr. Copper - Global Structural Demand Since 1950World Refined Copper Usage (000’s metric tonnes) 3x as many people, each using 3x as much copper means 9x more copper usageConsider our increasing reliance on all things electrical and electronic and nothing about today or tomorrow’s increased copper usage should seemsurprising: Electric lights and heat, machines for processing and manufacturing, water and sanitation systems, refrigerators, ovens, washers and dryers, airconditioners, dishwashers, microwaves, TV, phones, computers, internet, etc. have all gained widespread adoption over this timeframe. Powergeneration and grid infrastructure has obviously grown accordingly. And now power generation is becoming more renewable energy focused and electric powered transport is gaining adoption – both of which aremore copper intensive than the technologies they are replacing.TSX: ALS OTCQX: ATUSF 4
Structural and Cyclical Price TrendsDuring the second half of the last century the real price of copper fellconsistently despite strong global demand growthAverage Annual Copper Price (US /t) Technology breakthrough in the mid-60’s (SX-EW) allowed many giantcopper deposits in the Andes to become economic Economies of scale then took hold and traditional small to mediumscale underground mines were eclipsed by large-scale open pit mines“Super-Cycle”Around the start of this century a developing world-based demand surgewas underestimated by the market while existing mine depletionaccelerated – resulting supply deficits lifted prices out of the long-termdown-trend during what became known as the “super-cycle” Miners / investors happily responded to the higher prices by developingthe next best available set of deposits These were lower grade or deeper and came with a structurally higherdevelopment cost and marginal break even pointNote the lengthening of cycle durations over time, which is likely reflective ofincreasing lead times for supply responses (permitting, social licencing, morecomplex projectsTSX: ALS OTCQX: ATUSF 5
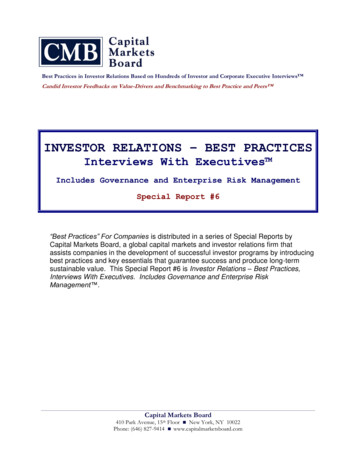
Geologic Inflation Through the “Super-Cycle”Capex, Opex and Incentive Pricing 7.00* Incentive Price is estimated usingindustry average new build capitalintensity and operating costs to derive a15% IRR resultCapex: 300% 6.00 5.00 4.00Incentive: 235% 3.00 2.00Opex: 166% 1.000Avg. Capex/lbAvg. Operating Cost (C3) / 2003200220012000 -Incentive Price Requirement Geologic Inflation - Average capital intensity and operating costs per pound moved significantly upward as industry necessarily shifted to lowergrade and deeper ore Other inflationary pressures (gov’t taxes and royalties, wages, equipment, etc.) also built quickly as prices moved up Resulting incentive price moved into the 3.50- 4.00 range from the 1.00 to 1.25 rangeCost inflation impacts mitigate the marginal benefits of higher resulting price increases for operators - but royalties are exposed only to the pricebenefitsTSX: ALS OTCQX: ATUSFSources: SNL Financial, internal estimates 6
Dr. Copper in 2021– “2005 - 2006 Déjà Vu?”?Incentive PriceActual Price20172018201920202021Spot Price AmountAbove / Below IncentiveSources: SNL Financial, internal estimates, dashed lines an informed guess 8 years of “super-cycle” incentive conditions ultimately resulted in short term oversupply and a price decline to below incentivization levels Sustained overshoot typically required and then new investments should sanction enmasse (and the supply surge will follow 5-7 years later) Prices then stayed below incentive for 8 years – new marginal operating cost curvesupport found at around 2/lb vs 1 prior cycle Incentivization now breached and market has real supply / demand deficit issueslooming - but capital returns over capital growth investing narrative still prevails for time being amongst most mining company ownersThe new investments will be in more difficult projects on average than the last set,likely furthering the inflation of LT incentive pricing requirements - suggesting alonger-term structural up-trend around which shorter cyclical trends should oscillateTSX: ALS OTCQX: ATUSFSource: S&P Market Intelligence, internal estimatesRevenue based royalties insulated from higher costs but full price beneficiaries 7
Cyclical PositionHow is Altius Positioned as a Long-Term, Contrarian Investor?Cycle IIICycle II (Super-Cycle)Cycle ITopInterpretedCyclicalPositionWe currently appear to bewithin relatively earlyinnings (end of 3rd?) of thenew us’s bets are largely in: Bottom of cycle royalty acquisitions now delivering stronger revenues onprice-based increasesIncentivization conditions for operator funded growth investments inexisting operations (brownfield) emerging and we expect the currentlyextreme “returns of capital” focused narrative to begin to shift shortly inresponse to changing shareholder demands towards growth – many ofour royalty assets are obvious investment targets due to strong margincurve positions and large existing resourcesTSX: ALS OTCQX: ATUSF investor sentiment conditions for new mining project development(greenfield) also becoming permissive – we hold royalties and equityinterests related to several advanced stage projects that featurecompelling economics and sponsorship Speculative and mining company capital flooding back into exploration –our portfolio holdings seeing an outsized share of this with severalpositioned for potential discovery, larger company takeover interest, etc. 8
Royalty Business Lookback
Altius’s Long-Term, Counter-Cyclical Royalty Growth FocusDisciplined Royalty Acquisition HistoryCycle IIICycle II (Super-Cycle)Cycle IRoyalty AcquisitionInterpreted Cyclical Position 1.14/share 1.03/sharePotash, Thermal (Electrical) Coal 0.81/share 0.61/shareCopper, ZincNickel, Copper, CobaltPotash RenewableEnergy 0.39/shareLithiumRenewableIron OreCopperEnergy 0.04/shareOperating CF /share2000TSX: ALS OTCQX: ATUSF2005201020152020 10
Revenue to Date, NAV Relative to Purchase PriceHistoric AcquisitionAcquisitionDatePurchasePrice (Note 1)Current Net Asset Value(Analyst Average)(Note 3)Realized Revenue & NAVVoisey's Bay2003 13.6 million 36.0 million 19.1 million 55.1 millionChapada Stream2016 76.8 million 53.3 million 115.0 million 168.3 millionPotash Portfolio2014 & 2018 138.2 million 74.5 million 223.3 million 297.8 millionIOC2017 & 2019 54.0 million 42.0 million 117.0 million 159.0 millionCalinan Merger2015 70.9 million 63.0 million 73.0 million 136.0 millionCoal Portfolio2014 & 2020 200.6 million 111.2 million 25.2 million 136.4 millionAltius Renewable Royalties (ARR)2019 & 2020 85.0 million- 180.0 million 180.0 million 639.1 million 380.0 million 752.7 million 1,132.7 millionRealized NetRevenue (Note 2)Note1.Purchase price is based on cash purchase price in CAD. For the acquisition of Callinan Royalties in 2015, the purchase price excludes cash and consideration allocated to non-royalty related assets. (see Note9, 2016 Annual Financial Statements), and includes the cost to exercise the option increasing the Gunnison Gross Sales Royalty (exercised in 2018). The main producing royalty in Callinan is 777 with theGunnison development stage royalty also part of that acquisition.2.Realized revenue is the cumulative (since acquisition) reported revenue up to March 31, 2021. For the Chapada copper stream, reported revenue is net of the 30% copper purchase cost, as per the contract.3.Analyst average NAV by asset based on analysts reports from March – April 2021. The Callinan NAV consensus is based on NAV ascribed to 777 and to Gunnison.TSX: ALS OTCQX: ATUSF 11
Royalty Revenue GrowthRevenue Per RevenueShares 1.86 1.62 1.56 1.08 0.88 0.83FY 2015FY 2016 0.22FY 2014FY 2017201820192020Per-share growth accretion since 2014 mostly reflective of period of counter-cyclical M&AFocus now cyclically shifting to price appreciation and organic volume growth basedTSX: ALS OTCQX: ATUSF 12
Organic Royalty Growth Drivers
Royalty Exposures Well Aligned With Macro Growth TrendsSustainability Thematic Providing Strong Investment Tailwinds For Underlying AssetsMacro-TrendTransition to RenewableEnergy RoyaltiesElectrification andStorageSoil Quality/AgriculturalYield ImprovementsLowerEmissionSteel MakingTSX: ALS OTCQX: ATUSFAltius Royalty ExposureAltius Renewable Royalties Corp.TSX:ARRCu, Ni, Li, CoNatural Potash FertilizerClean Iron Ore ProductsPublic subsidiary ARR funding the development of a portfolio of more than 25 GWof new renewable energy projects as electrical coal royalties approach regulatoryphase outCopper, which is essential to EV and renewable energy transitions, representsour largest revenue exposure. Growing exposure to key battery metals - nickel,lithium and cobaltPotash fertilizer royalties relate to a portfolio of top-tier Canadian mines that areintegral to meeting the increasing demand for sustainable food productionwithout additional deforestationRoyalties relate to high-purity iron ore products - that minimize pollution fromsteel production 14
Commodity / Market Exposures 15
Royalty Asset Lives Unrivalled in SectorLarge Resources Are A Strong Predictor of Future Production ExpansionsIronIOCVoisey’sBay77724Perpetual resources allow unlimited life extensions30 3Vanscoy127 Total: 107 Years Total: 757 Years Total: 1,318 Years Total: 1,128 YearsM&I: 698Years49Allan31Reserve Mine Life (Years)TSX: ALS OTCQX: ATUSFTotal: 390 YearsM&I: 46 Years59CoryRocanvilleM&I: 182 Years Inferred: 81 Years 60EsterhazyPotashSignificant expansion drilling on-goingand capacity expansion under study8Curipamba development1ARRGeneseeHumphrey South in permitting (20242071)Higher prices / lower cut-off grade potentially createssignificant additional resource; Further exploration s111024M&I: 698 Years Inferred: 571 YearsM&I: 413 Years Inferred: 684 YearsM&I Resource Life (Years)Inferred Resource Life (Years)Mine lives calculated based on current mineral inventory and 2020 throughput. Coal asset lives denote the expected plant closure and not based on mineral inventory.Life of ARR assets based on industry estimated project lives of new wind and solar generation projects. 16
Strong Underlying Mine timated OperatingMarginNutrienAll OperationsPotash 353498%MosaicAll OperationsPotash 353469%HudbayManitobaCopper 4.70466%ExcelsiorGunnisonCopper 4.70440%LundinChapadaCopper 4.70327%ValeVoisey's BayNickel 8.09122%Rio TintoIOCFe Concentrate 235460%Rio TintoIOCFe Pellet 301285%Notes All amounts in USD, with units being Cdn/ metric tonne for potash, USD per pound for base metals and USD per tonne for iron ore. Chapada margin calculated using Lundin’s guidance of 2021 C1 cash costs of copper per pound (NI43-101 report October 10, 2019) after precious metal by-product credits. Chapada cash costs do not include theeffects of copper stream agreements which will be a component of the copper revenue and will impact realized revenue per pound. Nutrien and Mosaic per tonne margins calculated by taking FOB Midwest Spot over Cost of Product Manufactured. COPM Potash COGS for the 2020 excluding depreciation and amortization expense andinventory and other adjustments divided by the production tonnes for the period. For Mosaic, we used the 2020 four quarter average actuals cash costs of production (excluding brine) – MOP ( /tonne) Voisey’s Bay margin calculation using SNL Modeled Cost Curve for Total Cash Cost per pound of nickel net of by-product credits. IOC margin based on Altius modeled 45/t cash costs for concentrate and 65/t cash costs for pellet. Gunnison is expected to be in Phase I commercial production in 2021. Total cash cost pe pound of copper is derived from the Base Case of the Feasibility Study dated January 16, 2017 Manitoba Operations margin calculated using Hudbay’s annual actuals for the year ended December 31, 2020. Cash cost per pound of copper produced, net of by-product credits.TSX: ALS OTCQX: ATUSF 17
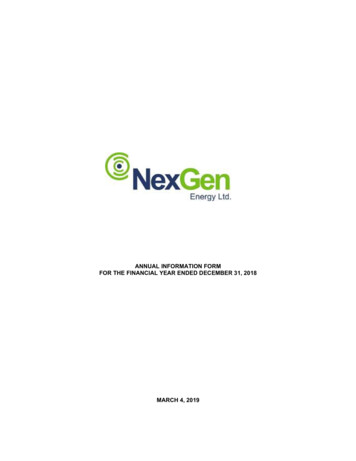
Iron OreIron Ore Price (US /t) 200 150 100 50 0May2020AugNovFebIron Ore 62% Fe Fines CFR QingdaoMay2021
The Greener Steel TransitionLabrador Trough Structural Advantage Iron ore input impurity levels greatly impact the efficiency of steel making blastfurnace plants and in so doing directly influence relative pollutive and basicoperational cost structure components The “cost of emissions” is becoming more acutely factored into steelmakingeconomics – a trend that seems more likely to accelerate than abate These two factors go most of the way to explaining the heightened structuralquality pricing differentiation that has been developing in the market over therecent past number of years Average iron ore quality is decreasing and driving up the underlying averagestructural cost of steelmaking – the majority of incremental global iron oreproduction capacity incentivized during the previous cycle came from inferiorquality ore deposits than those from the previous generation The Labrador Trough produces amongst the very lowest impurity level iron ores ofany significant district in the world today – and it is rare in its significant room forcompetitive production growthIron OreIronOxygenIron to Impurities RatioLow Quality58%25%17% Impurities(Ratio) 3.4:1“Benchmark’Quality62%27%11% Impurities(Ratio) 5.6:1High-Quality66%28%6% Impurities(Ratio) 11:1The relative impurity content of 58% vs 66% grade iron ore is almost 3 times higherIron Ore Price vs. Quality 250/t20%16% 225/t12% 200/t8% 175/t4% 150/tImpurities Content (%) The most common iron ores contain hematite and/or magnetite (iron oxides) andother mineral and elemental level impurities to varying degrees0%58%62%66%Iron Content (%)“Altius, with almost two decades of investing experience in the potential of the Labrador Trough, now provides its shareholders with a combination of production,development and exploration level growth exposure to this increasingly important iron ore mining district”TSX: ALS OTCQX: ATUSF 19
Altius and the Labrador Trough – Royalty Growth PotentialIOC (Operator: Rio Tinto)IOC is amongst the highest margin iron ore operations in the world at current product pricesNear-term Growth PotentialNameplate capacity at IOC was increased to 23Mt/a following a significant capitalinvestment program during the previous market cycle but it has struggled to bring actualproduction levels beyond the 18-19Mt/a levelA more than 20% increase in production levels would result if IOC were to succeed inattaining nameplate capacityCurrent market pricing and demand conditions for IOC product types are providing a strongincentive to make the necessary incremental investments and it has allocated 165Mtowards “de-bottlenecking” type growth and development investments in 2021It is also worth noting that in 2020, IOC’s parent, Rio Tinto, opened new product handlingfacilities in China that are intended to blend heavily discounted, low-quality ore types fromits Australian operations with premium, ultra-high purity IOC concentrates – suggestingperhaps an increasing relevance for IOC within Rio Tinto’s broader iron ore businessMedium-term Growth PotentialIn January IOC also filed the environmental registration for the Humphrey South ExtensionProject which is expected to provide a new source of low grind energy ore to maximizeconcentrator throughput. The expected project life is 47 years beginning in 2024Longer-term Growth PotentialSignificant additional potential resources have been identified from within the IOC landpackage that could potentially support a much larger scale expansion. These options werepublicly commented on by IOC (see graphic to right) during the prior cyclical period of strongsupply incentivization conditionsTSX: ALS OTCQX: ATUSFSource: Slide from an April 2013 public presentation by former IOC President and CEO Zoë Yujnovich titled:“The Labrador Trough and IOC’s Competitive ocs/upload/sys docs/201304 The Labrador Trough and IOCs Competitive Advantage.pdf 20
Altius and the Labrador Trough – Royalty Growth PotentialKami (Operator: Champion Iron)The Kami project is a low-impurity feasibility stage opportunity located within the core productionarea of the Labrador Trough mining districtAltius's project generation team completed the early exploration programs that broadly outlinedthe iron ore deposits at Kami before then vending the project in exchange for corporate equity anda retained 3% gross sales royalty during the prior market cycleThe original buyer of the Kami project, Alderon Iron Ore, defaulted on a project secured debt, whichled to successfully established nearby producer, Champion Iron, recently acquiring the projectthrough a recent receivership processThe most recently updated Alderon feasibility study for Kami was completed in 2018 and indicatedits ability to economically produce approximately 7.8 Mt/a of premium-quality iron oreconcentrates2018 Feasibility StudyAnnual Production (65.2% Fe Con)Initial Capex7.84 MtpaUS 982.4MCash Operating Cost (FOB)Capital Intensity 30.72/t of concentrate 125/t2P Reserves Rose PitMine Life517.2 Mt @ 28.8% Tfe23 YearsSource: Alderon Iron Ore Corp.NI 43-101 Technical Report, October 31, 2018Champion is currently in the process of revising the scope of the Kami Project and updating priorfeasibility studies.Should Kami be developed Altius’s underlying royalty has the potential to become a very materialnew cash flowing asset within its portfolioTSX: ALS OTCQX: ATUSFAltius holds a3% Gross Sales Royalty (GSR)on the Kami Project(FOB Sept Iles price basis) 21
Champion Iron (CIA-TSX/ASX; CIAFF-OTCQX)Altius Minerals Corporation– Investor DayGreen Steel Transition - Labrador Trough Structural AdvantagePREMIUM PRODUCT TIER 1JURISDICTIONHIGH QUALITYINFRASTRUCTURE 22
DisclaimerChampion IronThis presentation (the “Presentation”) contains information about Champion Iron Limited (“Champion Iron”, “Champion” or the “Company”), current as at the date hereof or as at such earlier date as may be specified herein. This Presentation does not constitute orform part of and should not be construed as, an offer to sell or issue or the solicitation of an offer to buy or acquire securities of the Company or any of its subsidiaries or affiliates or any other person in any jurisdiction or an inducement to enter into investmentactivity, does not constitute marketing material in connection with any such securities and there is no current offering or soliciting for the sale of securities in any jurisdiction.This Presentation and the information contained herein may not be reproduced or distributed to others, at any time, in whole or in part, for any purpose, and may not be used for any other purpose, without the prior written consent of the Company, and allrecipients agree that they will keep confidential all information contained herein not already in the public domain and will use this Presentation solely for information purposes. Acceptance of this Presentation by any person constitutes an agreement to be bound bythe foregoing terms.In making any future investment decision, you must rely on your own examination of the Company, including the merits and risks involved. This Presentation should not be construed as financial, legal, tax, accounting, investment or other advice or a recommendationwith respect to any potential investment. You should consult your own advisors as needed to make an investment decision and determine whether it is legally permitted to make an investment under applicable legal investment, securities or similar laws orregulations.This Presentation may contain “forward-looking information” or “forward-looking statements”, which include all statements other than statements of historical facts, including, without limitation, any statements preceded by, followed by or that include the words“will”, “would”, “aim”, “aimed”, “will likely result”, “is likely”, “are likely”, “believe”, “expect”, “expected to”, “will continue”, “will achieve”, “anticipate”, “estimate”, “estimating”, “intend”, “plan”, “contemplate”, “seek to”, “seeking to”, “trying to”, “target”, “proposeto”, “future”, “objective”, “goal”, “project”, “should”, “can”, “could”, “may”, “will pursue” or similar expressions or the negative thereof. Without limiting the generality of the foregoing, all statements in this Presentation, other than statements of historical fact, thataddress future events, developments or performance that the Company expects to occur, including management’s expectations regarding (i) the Company’s growth; (ii) the Company’s environmental footprint; (iii) the Phase II expansion of the Bloom Lake Mine, itstechnical parameters, expected construction timeline, capital expenditures, costs, NPV and IRR; (iv) the DR product potential and its impact on securing new customers and expanding product offering; (v) the estimated future operation capacity of the Bloom LakeMine; (vi) the completion of the construction for a potential expansion of the Bloom Lake Mine; (vii) the life of mine of the Bloom Lake Mine; (viii) the Company’s product quality and its Green House Gas emissions and its ability to service the Electric Arc Furnacemarket; (ix) the Company’s ability to transition capacity to DR pellet feed; (x) the Kami project acquisition and related port capacity; (xi) the industry demand; (xii) Champion Iron Limited’s ability to advance the Phase II expansion project and its funding, completiontimeline, impact on nameplate capacity, expected capital expenditures and project economics; (xiii) additional port capacity expected from the Kami project acquisition; (xiv) the local support and announced agreement to invest in SFPPN with the Government ofQuébec and its ability to support expansion plans; and (xv) measures, and the effectiveness thereof, implemented or expected to be implemented to mitigate the risk and contain COVID-19 and the potential impacts on Champion’s business, financial condition andfinancial results of the outbreak of the COVID-19 pandemic are forward-looking statements. Such forward-looking information and statements included in this Presentation are not guarantees of future performance and should not be unduly relied upon. Suchinformation and statements, including the assumptions made in respect thereof, involve known and unknown risks, uncertainties and other factors that may cause actual results or events to differ materially from those anticipated in such forward-looking informationor statements, as well as those factors discussed in the section entitled “Risk Factors” of the Company’s 2020 Annual Information Form and the risks and uncertainties discussed in the Company’s quarterly activities report for the fiscal year ended March 31, 2020 andthe management’s discussion and analysis for the fiscal year ended March 31, 2020, all of which are available on SEDAR at www.sedar.com, the ASX at www.asx.com.au and the Company’s website at www.championiron.com. The forward-looking information andstatements contained in this Presentation are based on assumptions Champion’s management believes to be reasonable and speak only as of the date of this Presentation, and none of the Company or any of its affiliates, agents, advisors or representatives (includingdirectors, officers and employees) intend or have any duty or obligation to supplement, amend, update or revise any of the forward-looking statements contained in this Presentation.On June 20, 2019, the Company released the results of the Feasibility Study for the Bloom Lake Phase II expansion project reported in the National Instrument 43-101 – Standards of Disclosure for Mineral Projects (“National Instrument 43-101”) technical reportentitled “Bloom Lake Mine – Feasibility Study Phase 2” by BBA Inc., Soutex and WSP Canada Inc., having an effective date of June 20, 2019 and filed on August 2, 2019 (the “Phase II Feasibility Study”). The Company is not aware of any new information or data thatmaterially affects the information included in the Phase II Feasibility Study and confirms that all material assumptions and technical parameters underpinning the estimates in the Phase II Feasibility Study continue to apply and have not materially changed. The PhaseII Feasibility Study dated August 2, 2019 is available at www.sedar.com.The non-IFRS financial performance measures included in this Presentation include: total cash cost or C1 cash cost, all-in sustaining costs (“AISC”), average realized selling price, earnings before interest, tax, depreciation and amortization ("EBITDA"), adjusted netincome and adjusted earnings per share ("adjusted EPS"). These measures are intended to provide additional information and should not be considered in isolation, or as a substitute for, measures of performance prepared in accordance with IFRS. These measures donot have any standardized meaning prescribed under IFRS and therefore may not be comparable to other issuers.Nothing described in this Presentation has been or will have been recommended, approved or disapproved by any securities regulatory authority of any state, province or any other jurisdiction, nor has any such securities regulatory authority passed upon theaccuracy or adequacy of this presentation or this Presentation.Reference to P62: Platts TSI IODEX 62% Fe CFR China;Qualified Person and data verification: Mr. Nabil Tarbouche, Senior Geologist at Quebec Iron Ore Inc., a wholly-owned subsidiary of the Company (P.Geo.) is a “qualified person” as defined by National Instrument 43-101 and has reviewed and approved the disclosureof the scientific and technical information related to Bloom Lake contained in this Presentation (the “Bloom Lake Information”). Mr. Tarbouche’s review and approval does not include statements as to the Company’s knowledge or awareness of new information ordata or any material changes to the material assumptions and technical parameters underpinning the Phase II Feasibility Study. Mr. Tarbourche is a member of the Ordre des Géologues du Québec. Mr. Tarbouche consents to the inclusion in this Presentation of theBloom Lake Information in the form and context in which it appears. Certain other information contained in this Presentation has been obtained from published sources prepared by third parties and has not been independently verified and no representation orwarranty, expressed or implied, is made with respect to, and no undue reliance shall be placed on, the information or opinions contained herein or in any verbal or written communication made in connection with this Presentation.This Presentation has been authorized for release to the market by the CEO of Champion Iron Limited, David Cataford.All information quoted “per tonne” refer to per dry metric tonne (“dmt”).All amounts are in Canadian dollars unless otherwise stated. 23
Corporate OverviewChampion IronLARGEST PUBLICLY LISTED PURE-PLAY HIGH-GRADE IRON ORE PRODUCER GLOBALLY Top Tier JurisdictionEstablished production in region since the 50’s2nd largest hub of high-grade export globallyAccess to infrastructure Nearly US 4 Billion invested7.4 Mtpa nameplate capacityOngoing Phase II construction expected to double productionHigh-grade 66.3% Fe with low impurities20-year mine life Proven management team10.7% insider ownership1 First 9-months of FY21 net average realized selling price US 116.3/t*First 9-months of FY21 total Cash cost US 40.4/t FOB* 1,060.8M Revenue in last 4 quarters 598.5M EBITDA in last 4 qu
Sources: SNL Financial, internal estimates 6 Geoloic Inlation Throuh the "Super -Cycle" . Altius Renewable Royalties (ARR) 2019 & 2020 85.0 million - 180.0 million 180.0 million Note 1. Purchase price is based on cash purchase price in CAD. For the acquisition of Callinan Royalties in 2015, the purchase price excludes cash and .

![Welcome [dashdiet.me]](/img/17/30-day-weight-loss-journal.jpg)