Transcription
Quantum GIS User GuideVersion 0.6 ’Simon’Gary E. ShermanTim SuttonRadim Blazek (GRASS)Lars Luthman (GPS Plugin)December 2004
CONTENTS1 Introduction1.1 Major Features . . . . . . . . . . . . . . . . . . . . . . . . . . . . . . . . . . . . . . . . . . . .1.2 Whats New in 0.6 . . . . . . . . . . . . . . . . . . . . . . . . . . . . . . . . . . . . . . . . . .1122 Getting Started2.1 Installation . . . . . . . . . . . . . . . . . . . . . . .2.2 Sample Data . . . . . . . . . . . . . . . . . . . . . .2.3 Starting QGIS . . . . . . . . . . . . . . . . . . . . .2.3.1 Command Line Options . . . . . . . . . . . .2.4 The QGIS Main Window . . . . . . . . . . . . . . .2.4.1 The QGIS menu bar . . . . . . . . . . . . . .2.4.2 Toolbars . . . . . . . . . . . . . . . . . . . . .2.4.3 The QGIS map legend . . . . . . . . . . . . .2.4.4 The QGIS map view . . . . . . . . . . . . . .2.4.5 The QGIS map overview . . . . . . . . . . . .2.4.6 The QGIS map status bar . . . . . . . . . . .2.5 Rendering . . . . . . . . . . . . . . . . . . . . . . . .2.5.1 Scale Dependent Rendering . . . . . . . . . .2.5.2 Controlling Map Rendering . . . . . . . . . .2.5.3 Stopping Rendering . . . . . . . . . . . . . .2.5.4 Suspending Rendering . . . . . . . . . . . . .2.5.5 Setting Layer Add Option . . . . . . . . . . .2.5.6 Updating the Map Display During Rendering.33333455566667777783 Working with Vector Data3.1 Shapefiles . . . . . . . . . . . . . . . . .3.1.1 Loading a Shapefile . . . . . . .3.1.2 Loading a MapInfo Layer . . . .3.1.3 Loading an ArcInfo Coverage . .3.2 PostGIS Layers . . . . . . . . . . . . . .3.2.1 Creating a Stored Connection . .3.2.2 Loading a PostGIS Layer . . . .3.2.3 Using the Query Builder . . . . .3.2.4 Importing Data into PostgreSQL3.3 The Vector Properties Dialog . . . . . .3.3.1 Vector Symbology . . . . . . . .3.4 Attribute Actions . . . . . . . . . . . . .3.4.1 Defining Actions . . . . . . . . .3.4.2 Using Actions . . . . . . . . . . .3.5 Editing . . . . . . . . . . . . . . . . . .3.5.1 Editing an Existing Layer . . . .3.5.2 Creating a New Layer . . . . . .999101010111212131414141516161617.i.
4 Working with Raster Data4.1 What is raster data? . . . . . . . .4.2 Raster formats supported in QGIS4.3 Loading raster data in QGIS . . .4.4 Raster Properties . . . . . . . . . .4.4.1 Symbology Tab . . . . . . .4.4.2 General Tab . . . . . . . . .4.4.3 Metadata Tab . . . . . . .4.4.4 Pyramids Tab . . . . . . . .1919191920212121225 GRASS5.1 Starting QGIS with GRASS .5.1.1 From GRASS shell . .5.1.2 Outside GRASS shell5.2 Loading GRASS Data . . . .5.3 Vector Data Model . . . . . .5.4 Digitizing and Editing Tools .5.4.1 Toolbar . . . . . . . .5.4.2 Category Tab . . . . .5.4.3 Settings Tab . . . . .5.4.4 Symbology Tab . . . .5.4.5 Table . . . . . . . . .5.4.6 Region Tool . . . . . .232323232324242425262626266 Using Plugins6.1 An Introduction to Using Plugins . . . . . . .6.1.1 Finding and Installing a Plugin . . . .6.1.2 Managing Plugins . . . . . . . . . . .6.1.3 Data Providers . . . . . . . . . . . . .6.1.4 Core Plugins . . . . . . . . . . . . . .6.2 Using the GPS Plugin . . . . . . . . . . . . .6.2.1 What is GPS? . . . . . . . . . . . . .6.2.2 Loading GPS data from a file . . . . .6.2.3 GPSBabel . . . . . . . . . . . . . . . .6.2.4 Importing GPS data . . . . . . . . . .6.2.5 Downloading GPS data from a device6.2.6 Uploading GPS data to a device . . .6.2.7 Defining new device types . . . . . . .6.3 Using the Delmited Text Plugin . . . . . . . .6.3.1 Requirements . . . . . . . . . . . . . .6.3.2 Using the Plugin . . . . . . . . . . . .2727272728282929293030303232333334.7 Help and Support38A Supported Data FormatsA.1 Supported OGR Formats . . . . . . . . . . . . . . . . . . . . . . . . . . . . . . . . . . . . . .A.2 GDAL Raster Formats . . . . . . . . . . . . . . . . . . . . . . . . . . . . . . . . . . . . . . . .393939B Gnu Public LicenseB.1 Quantum GIS Qt exception for GPL . . . . . . . . . . . . . . . . . . . . . . . . . . . . . . . .4145
C QGIS Installation GuideC.1 Introduction . . . . . . . . . . . . . . . .C.1.1 Installing Windows Version . . .C.1.2 Installing Mac OSX Version . . .C.1.3 Building from Source . . . . . . .C.2 Getting QGIS . . . . . . . . . . . . . . .C.3 PostgreSQL . . . . . . . . . . . . . . . .C.4 GEOS . . . . . . . . . . . . . . . . . . .C.5 PostGIS . . . . . . . . . . . . . . . . . .C.6 GRASS . . . . . . . . . . . . . . . . . .C.7 GDAL/OGR . . . . . . . . . . . . . . .C.8 Qt . . . . . . . . . . . . . . . . . . . . .C.9 Building QGIS . . . . . . . . . . . . . .C.9.1 Quick and Dirty . . . . . . . . .C.9.2 Configuring QGIS the Right WayC.10 Building Plugins . . . . . . . . . . . . .46464646464747494950505252535355
QGIS Tips12345678910111213Example Using command line arguments . . . . . . . . . .Viewing the Layer Menu . . . . . . . . . . . . . . . . . . . .Zooming the Map with the Mouse Wheel . . . . . . . . .Layer Colors . . . . . . . . . . . . . . . . . . . . . . . . . . . .QGIS User Settings and Security . . . . . . . . . . . . . .Changing the Layer Definition . . . . . . . . . . . . . . . .Importing Shapefiles Containing PostgreSQL ReservedGathering Raster Statistics . . . . . . . . . . . . . . . . . .GRASS Data Loading . . . . . . . . . . . . . . . . . . . . . .Learning the GRASS Vector Model . . . . . . . . . . . . .GRASS Edit Permissions . . . . . . . . . . . . . . . . . . . .Crashing Plugins . . . . . . . . . . . . . . . . . . . . . . . . .Plugins Settings Saved to Project . . . . . . . . . . . . .iv. . . . . . . . . . . . . . . . . . . . . . . . .Words. . . . . . . . . . . . . . . . . . . . . . . . .4569111213222424262728
CHAPTER 1: IntroductionWelcome to the wonderful world of Geographical Information Systems (GIS)! Quantum GIS (QGIS) is anOpen Source Geographic Information System. The project was born in May of 2002 and was establishedas a project on SourceForge in June of the same year. We’ve worked hard to make GIS software (whichis traditionaly expensive commerical software) a viable prospect for anyone with basic access to a PersonalComputer. QGIS currently runs on most Unix platforms, Window, and OS X. QGIS is developed using theQt toolkit (http://www.trolltech.com) and C . This means that QGIS feels snappy to use and has apleasing, easy to use graphical user interface.QGIS aims to be an easy to use GIS, providing common functions and features. The initial goal was toprovide a GIS data viewer. QGIS has reached that point in its evolution and is being used by many fortheir daily GIS data viewing needs. QGIS supports a number of raster and vector data formats, with newsupport easily added using the plugin architecture (see Appendix A for a full list of currenly supported dataformats). QGIS is released under the GNU Public License (GPL). Devloping QGIS under this license meansthat you can (if you want to) inspect and modify the source code and guarantees that you, our happy userwill always have access to a GIS program that is free of cost and can be freely modified. You should havereceived a full copy of the license with your copy of QGIS, and is also available as Appendix B.Note: The latest version of this document can always be found .1Major FeaturesQGIS has many common GIS features and functions. The major features are listed below.1. Support for spatially enabled PostgreSQL tables using PostGIS2. Support for ESRI shapefiles and other vector formats support by the OGR library, including MapInfofiles3. Identify features4. Display attribute table5. Select features6. Label features7. Persistent selections8. Save and restore projects9. Support for raster formats supported by the GDAL library10. Change vector symbology (single, graduated, unique value, and continuous)11. SVG markers symbology (single, unique value, and graduated)12. Display raster data such as digital elevation models, aerial photography or landsat imagery13. Change raster symbology (grayscale, pseudocolor and multiband RGB)14. Export to Mapserver map file1
QGIS User GuideVersion 0.615. Preliminary digitizing support16. Map overview17. Plugins1.2Whats New in 0.6QGIS is still under development. In this release many new features have become available including:1. GEOS support in the OGR provider to refine selection of features via identify. This improves over theprevious method of feature selection which used a simple MBR intersection check.2. PostGIS editing support in provider3. Vector dialog redesign to improve usability4. Improvement in project handling (loading and saving)5. Scale dependent rendering6. User option to load layers with out drawing them, thus allowing you to set scale dependency, etcwithout waiting for the initial draw to complete7. Interrupt drawing of features by hitting ESC8. Attribute actions - the ability to run an external program based on the contents of an attribute fieldin a layer9. Create new vector layer (shapefile) for editing10. Windows installer Mac OSX binary11. New options in the graticule builder plugin12. Enhancements to the GPS plugin13. Man page14. Save delimited text as shapefile15. Improved Delimited Text plugin, including preview of text file16. Improved SPIT handling of PostgreSQL reserved words and shapefiles with multiple geometry types17. Display SQL query used to create a PostGIS layer18. PostgreSQL query builder19. Ability to redefine the query used for PostgreSQL layers from the layer properties dialog20. North arrow, scalebar, and copyright plugins save their state in the project file21. Datasets with UTF8, Kanjii and CJK filenames now load properly2
CHAPTER 2: Getting StartedThis chapter gives you a quick overview of running QGIS and examining data available on the QGIS webpage.2.1InstallationInstallation of QGIS is documented in Appendix C. The Installation Guide is distributed with the QGISsource code and is also available at http://qgis.org. Under Windows and Mac OSX, QGIS is available asa standard installer package for these platforms.2.2Sample DataIf you do not have any GIS data handy, you can obtain a dataset for Alaska from the QGIS web site athttp://qgis.org. The Alaska data set will be used as the basis for many of the examples and screenshotsprovided in this document.2.3Starting QGISAssuming that QGIS is installed in the PATH, you can start QGIS by typing: qgis at a command promptor by double clicking on the QGIS application link (or shortcut) on the desktop. Under MS Windows, startQGIS using the Start menu shortcut, and under Mac OSX, double click the icon in your applications folder.2.3.1Command Line OptionsQGIS supports a number of options when started from the command line. To get a list of the options, enterqgis --help on the command line. The usage statement for QGIS is:Usage: /home/gsherman/qgis06 rc/bin/qgis [options] [FILES]options:[--snapshot filename]emit snapshot of loaded datasets to given file[--lang language]use language for interface text[--project projectfile] load the given QGIS project[--help]this textFILES:Files specified on the command line can include rasters,vectors, and QGIS project files (.qgs):1. Rasters - Supported formats include GeoTiff, DEM3
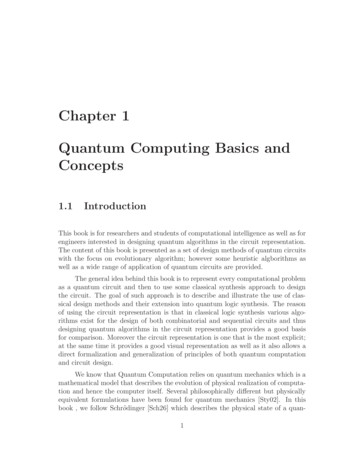
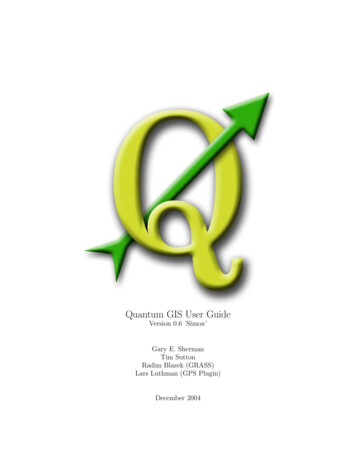
QGIS User GuideVersion 0.6and others supported by GDAL2. Vectors - Supported formats include ESRI Shapefilesand others supported by OGR and PostgreSQL layers usingthe PostGIS extensionTip 1 Example Using command line argumentsYou can start QGIS by specifying one or more data files on the command line. For example, assuming you are inyour data directory, you could start QGIS with two shapefiles and a raster file set to load on startup using thefollowing command:2.4qgis ak shade.tif alaska.shp majrivers.shpThe QGIS Main WindowWhen QGIS starts, you are presented with the main window as shown below.Figure 2.1: Main windowNote - Your window decorations (title bar, etc.) may appear different depending on youroperating system and window manager The QGIS main window is divided into five areas:1. The menu bar2. The tool bar3. The map legend4
QGIS User GuideVersion 0.64. The map view5. The map overview6. The status barThese six components of the QGIS interface are described in more detail in the following sections2.4.1The QGIS menu barThe menu bar provides access to various QGIS features using a standard windows heirachical menu. Thetop-level menus and a summary of some of the functions provided are: File (project open, save, export image, properties)Layer (add, show, hide layers)View (zoom, refresh)Tools (plugin manager, preferences)Plugins (menus added by plugins as they are loaded)Help (documentation and web links)2.4.2ToolbarsThe toolbars provide access to most of the same functions as the menus, plus additional tools for interactingwith the map. Each toolbar item has popup help available. Hold your mouse over the item and a shortdescription of the tool’s purpose will be displayed.2.4.3The QGIS map legendThe map legend area is used to set the visibility and z-ordering of layers. Z-ordering means that layers listednearer the top of the legend are drawn over layers listed lower down in the legend. The checkbox in eachlegend entry can be used to show/hide that layer.Tip 2 Viewing the Layer MenuYou can display the context menu for any layer in the legend by right-clicking on the layer name. The context menucontains items for working with the layer and viewing its properties.Each legend entry can show the following mini icons:This is a raster layer that has pyramids built for it to improve rendering efficiency (see Section 4.4.4).This is a raster that has no pyramid layers (see Section 4.4.4).This layer is shown in the overview map area as well as in the main map window.This is a vector layer that is currently enabled for editing.5
QGIS User Guide2.4.4Version 0.6The QGIS map viewThis is the ’business end’ of QGIS - maps are displayed in this area! The map displayed in this window willdepend on the vector and raster layers you have chosen to load (see sections that follow for more info onthis). The map view can be panned (shifting to focus of the map display to another region), zoomed in andout, and supports various other actions as described in the toolbar description above. The map view andthe legend are tightly bound to each other - the maps in view reflect changes you make in the legend area.Tip 3 Zooming the Map with the Mouse WheelYou can use the mouse wheel to zoom in and out on the map. Place the mouse cursor inside the map area and rollit forward (away from you) to zoom in and backwards (towards you) to zoom out.2.4.5The QGIS map overviewThe map overview area provides a full extent view of layers added to it. Within the view is a rectangleshowing the current map extent. This allows you to quickly determine which area of the map you arecurrently viewing. Note that labels are not rendered to the map overview even if the layers in the mapoverview have been set up for labelling.2.4.6The QGIS map status barThe status bar shows you your current position in map coordinate (e.g. meters or decimal degress) as themouse pointer is moved accross the map view. The status bar also shows the view extents of the map viewas you pand and zoom in and out. A progress bar in the status bar shows progress of rendering as each layeris drawn to the map view. In some cases such as the gathering of statistics in raster layers, the progress barwill be used to show the status of lengthy operations. At the end of the status bar is a small checkbox whichcan be used to temporarily prevent layers being rendered to the map view )see Section 2.5 below.2.5RenderingBy default, QGIS renders all visible layers whenever the map canvas must be refreshed. The events thattrigger a refresh of the map canvas include: Adding a layerPanning or zoomingResizing the QGIS windowChanging the visibility of a layer or layersQGIS allows you to control the rendering process in a number of ways.6
QGIS User Guide2.5.1Version 0.6Scale Dependent RenderingScale dependent rendering allows you to specify the minimum and maximum scales at which a layer will bevisible. To set scale dependency rendering, open the properties dialog by double-clicking on the layer in thelegend. On the General tab, set the minimum and maximum scale values and then click on the Use scaledependent rendering checkbox.You can determine the scale values by first zooming to the level you want to use an noting the scale valuein the QGIS status bar.2.5.2Controlling Map RenderingMap rendering can be controlled in the following ways:1. Stopping rendering during drawing of the map canvas2. Temporarily suspending rendering3. Setting an option to control the visibility of layers when they are added2.5.3Stopping RenderingTo stop the map drawing, press the ESC key. This will halt the refresh of the map canvas and leave the mappartially drawn. It may take a bit of time between pressing ESC and the time the map drawing is halted.2.5.4Suspending RenderingTo suspend rendering, click the Render checkbox in the lower right corner of the statusbar. When the Renderbox is not checked, QGIS does not redraw the canvas in response to any of the events described in Section?. Examples of when you might want to suspend rendering include: Add many layers and symbolize them prior to drawingAdd one or more large layers and set scale dependency before drawingAdd one or more large layers and zoom to a specific view before drawingAny combination of the aboveChecking the Render box enables rendering and causes and immediate refresh of the map canvas.2.5.5Setting Layer Add OptionYou can set an option to always load new layers without drawing them. This means the layer will be addedto the map, but its visibility checkbox in the legend will be unchecked by default. To set this option, choosePreferences from the Settings menu and click on the Rendering tab. Check the New layers added to the mapare not displayed checkbox. Any layer added to the map will be off (invisible) by default.7
QGIS User Guide2.5.6Version 0.6Updating the Map Display During RenderingYou can set an option to update the map display as features are drawn. By default, QGIS does not displayany features for a layer until the entire layer has been rendered. To update the display as features are readfrom the datastore, choose Preferences from the Settings menu and click on the Rendering tab. Set thefeature count to an appropriate value to update the display during rendering. Setting a value of 0 disablesupdate during drawing (this is the default). Setting a value too low will result in poor performance as themap canvas is continually updated during the reading of the features. A suggested value to start with is 500.8
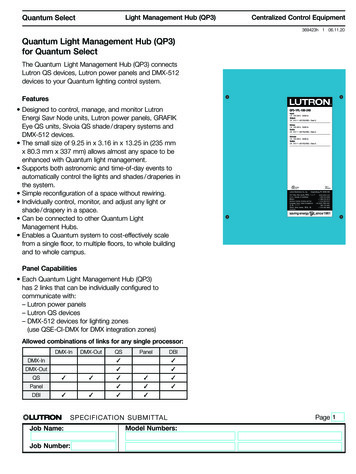
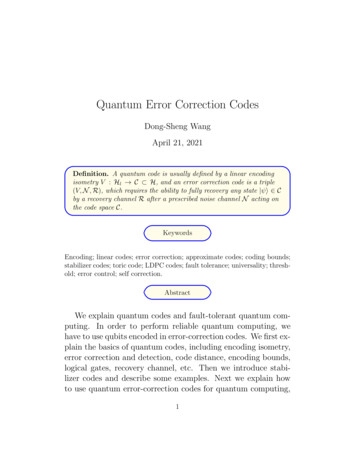
CHAPTER 3: Working with Vector DataQGIS supports vector data in a number of formats, including shapefiles, MapInfo mif, and PostGIS layersin a PostgreSQL database. Support for additional data types is provided by plugins, for example delimitedtext.This section describes how to work with two common formats: shapefiles and PostGIS layers. Many of thefeatures available in QGIS work the same regardless of the vector data source. This is by design and includesthe identify, select, labeling, and attributes functions.3.1ShapefilesShapefile support is provided by a library of functions (OGR http://www.remotesensing.org/gdal/ogr).See Appendix A.1 for a list of supported formats.A shapefile actually consists of a minimum of three files:1. .shp file containing the feature geometries2. .dbf file containing the attributes in dBase format3. .shx index fileThe technical specification for the shapefile format can be found l.3.1.1Loading a ShapefileTo load a shapefile, start QGIS and click on the Add a vector layer toolbar bar button. This sametool can be used to load any of the formats supported by the OGR library.Clicking on the tool brings up a standard open file dialog (Figure 3.1) which allows you to navigate the filesystem and load a shapefile (or other supported data source). Selecting a shapefile from the list and clickingOk loads it into QGIS. Figure 3.2 shows QGIS after loading the country.shp file.Tip 4 Layer ColorsWhen you add a layer to the map, it is assigned a random color. When adding more than one layer at a time,different colors are assigned to each.Once loaded, you can zoom around the shapefile using the map navigation tools. To change the symbologyof a layer, open the layer properties dialog by double clicking on the layer name or by right-clicking on thename in the legend and choosing Properties from the popup menu. See Section 3.3.1 for more informationon setting symbology of vector layers.9
QGIS User GuideVersion 0.6Figure 3.1: Open OGR Data Source Dialog3.1.2Loading a MapInfo LayerTo load a MapInfo layer, click on the Add a vector layer toolbar bar button and change the file type filterto MapInfo (*.mif *.tab *.MIF *.TAB) and select the layer you want to load.3.1.3Loading an ArcInfo CoverageLoading an an ArcInfo coverage is done using the same method as with a shapefiles and MapInfo layers.Click on the Add a vector layer toolbar button to open the layer dialog. Navigate to the coverage directoryand select one of the following files (if present in your oadloadloada label layer (polygon labels, or standing pointsa polygon centroid layeran arc (line) layera polygon layerPostGIS LayersPostGIS layers are stored in a PostgreSQL database. The advantage of PostGIS is the spatial indexing,filtering, and query capability. Using PostGIS, vector functions such as select and identify work moreaccurately than with OGR layers in QGIS. To use PostGIS layers you must:1. Create a stored connection in QGIS to the PostgreSQL database (if one is not already defined)2. Connect to the database3. Select the layer to add to the map10
QGIS User GuideVersion 0.6Figure 3.2: QGIS with the countries Shapefile Loaded4. Optionally provide a SQL where clause to define which features to load from the layer5. Load the layer3.2.1Creating a Stored ConnectionThe first time you use a PostGIS data source, you must create a connection to the PostgreSQLdatabase that contains the data. Begin by clicking on the Add a PostGIS Layer toolbar button.The Add PostGIS Table(s) dialog will be displayed. To access the connection manager, click on the Newbutton to display the Create a New PostGIS Connection dialog. The parameters required for a connectionare shown in Table 3.1. Once the parameters have been filled in, you can test the connection by clicking onthe Test Connection button. To save the password with the connection information, check the Save Passwordoption.Tip 5 QGIS User Settings and SecurityYour customized settings for QGIS are stored based on the operating system. On Linux/Unix, the settings arestored in your home directory in .qt/qgisrc. On Windows, the settings are stored in the registry. Depending on yourcomputing environment, storing passwords in your QGIS settings may be a security risk.11
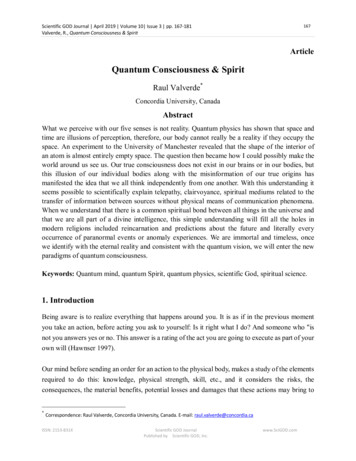
QGIS User GuideVersion 0.6Table 3.1: PostGIS Connection 2A name for this connection. Can be the same as DatabaseName of the database host. This must be a resolvable host name the same as wouldbe used to open a telnet connection or ping the hostName of the databasePort number the PostgreSQL database server listens on. The default port is 5432.User name used to login to the databasepassword used with Username to connect to the databaseLoading a PostGIS LayerOnce you have one or more connections defined, you can load layers from the PostgreSQL database.Of course this requires having data in PostgreSQL. See Section 3.2.4 for a discussion on importingdata into the database.To load a layer from PostGIS, perform the following steps:1.2.3.4.If the PostGIS layer dialog is not already open, click on the Add a PostGIS Layer toolbar buttonChoose the connection from the drop-down list and click ConnectFind the layer you wish to add in the list of available layersSelect it by clicking on it. You can select multiple layers by holding down the shift key while clicking.See Section 3.2.3 for information on using the PostgreSQL Query Builder to further define the layer.5. Click on the Add button to add the layer to the map3.2.3Using the Query BuilderThe PostgreSQL Query Builder allows you to define a subset of a table and add it as a layer in QGIS. Forexample, if you have a towns layer with a population field you could select only larger towns by enteringpopulation 100000 in the SQL box of the query builder. Figure ? shows an example of the query builderpopulated with data from a layer in PostgreSQL.The query builder lists the layer’s database fields in the list box on the left. You can get a sample of thedata contained in the highlighted field by clicking on the Sample button. This retrieves the first 25 distinctvalues for the field from the database. To get a list of all possible values for a field, click on the All button.To add a selected field or value to the query, double-click on it. You can use the various buttons to constructthe query or you can just type it into the SQL box.To test a query, click on the Test button. This will return a count of the number of records that will beincluded in the layer. When satisfied with the query, click Ok. The SQL for the where clause will be shownin the SQL column of the layer list.Tip 6 Changing the Layer DefinitionYou can change the layer defintion after it is loaded by altering the SQL query used to define the layer. To do this,open the vector layer properties dialog by double-clicking on the layer in the legend and click on the Query Builderbutton on the General tab. See Section 3.3 for more information.12
QGIS User GuideVersion 0.6Figure 3.3: PostgreSQL Query Builder3.2.4Importing Data into PostgreSQLData can be imported into PostgreSQL using a number of methods. PostGIS includes a utility calledshp2pgsql that can be used to import shapefiles into a PostGIS enabled database.QGIS comes with a plugin named SPIT (Shapefile to PostGIS Import Tool). SPIT can be used toload mutliple shapefiles at one time and includes support for schemas. To use SPIT, open the PluginManager from the Tools menu and load the plugin by checking the box next to the SPIT plugin and clickOk. The SPIT icon will be added to the plugin toolbar.To import a shapefile, click on the SPIT tool in the toolbar to open the dialog. You can add one or more filesto the queue by clicking on the Add button. To process the files, click on the Import button. The progressof the import as well as any errors/warnings will be displayed as each shapefile is processed.Tip 7 Importing Shapefiles Containing PostgreSQL Reserved WordsIf a shapefile is added to the queue containing fields that are reserved words in the PostgreSQL database a dialogwill popup showing the status of each field. You can edit the field names prior to import and change any that arereserved words (or change any other field names as desired). Attempting to import a shapefile with reserved wordsas field names will likely fail.13
QGIS User Guide3.3Version 0.6The Vector Properties DialogThe vector properties dialog provides information about a layer, symbology settings, an
CHAPTER 2: Getting Started This chapter gives you a quick overview of running QGIS and examining data available on the QGIS web page. 2.1 Installation