Transcription
Volume 3 Issue 4April 2021EditorialPower System Overview & Analysis All India Demand Met Profile2 Region-wise Demand Met Profile2 All India Renewable Energy (RE) GenerationProfile3 Short-term Energy Transactions3 Monthly Short-term (ST) Purchase and SaleQuantum across States4Power Market Overview & Analysis DAM – Market Clearing Price (MCP) & MarketClearing Volume (MCV)4 Term-Ahead Market (TAM)5 RTM - Market Clearing Price (MCP) andMarket Clearing Volume (MCV)5 Green Term-Ahead Market (G-TAM)5 RTM Vs DAM on Market ClearingPrice (MCP)6Regulatory & Policy Perspective POSOCO-NLDC Detailed Guidelineson Ramping Assessment EAL's Opinion78Markets behave in response to newly discoveredinformation, and the pace of that response reflects marketefficiency. EAL's analysis (PC: Vol.3, Issue.2)highlighted a consistent behavioural observation thatRTM prices were found to be proportionally higher thanthe DAM discovered price for the same time block acrossmore days in a month, particularly during the late nightand early morning hours. Power Market seems to haveassimilated this information. Understandably, March2021 recorded significantly fewer days with RTM pricesbeing higher than the DAM prices during the mentionedhours of the day (see page 6).The increasing share of variable RE (VRE) places stresson the thermal generators, which need to respond tovariability in demand as well as VRE generation.Adequate ramping capability of thermal generatingunits, particularly those based on coal and lignite, iscrucial to ensure system security and stability. CERC's(Terms and Conditions of Tariff) Regulations, 2019provides for additional RoE for higher rampingcapability while penalising any short fall.EAL's analysis of the Guidelines for Assessment ofRamping Capability of ISGS issued by POSOCO-NLDCpoints towards at least five instances of relaxations in theoverall framework. For example, 15% relaxation inmeasuring the proportion of time blocks having attainedthe ramping target in spite of the exclusion of the blocksunder exigencies, ramp rate tolerance of 10% only forunder-achievement of ramping target, and a minimum of60-90 blocks/month (2-3 blocks/day) required todemonstrate the ramping capability. EAL suggestsreconsideration of various relaxations to ensure that thebeneficiaries and, hence, the consumers are not undulyburdened by the additional RoE and there is fairtreatment of performance shortfall as well.Anoop SinghFounder & Coordinator, Energy Analytics LabRegister at eal.iitk.ac.in to access data and resourcesStay Home, Stay Safe.Energy Analytics Lab (EAL)Department of Industrial and Management EngineeringIndian Institute of Technology Kanpur, Kanpur – 208016 (India) 2021 EAL, IIT Kanpur
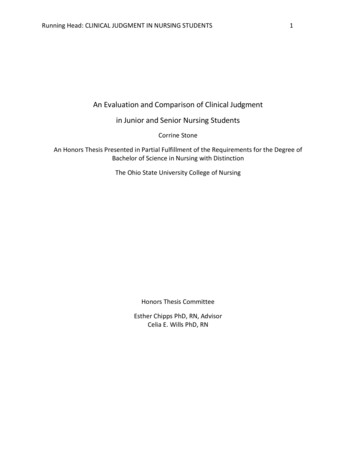
Power Chronicle2Power System Overview & AnalysisAll India Demand Met ProfilethFrom January to March quarter, all India peak demand reached 190 GW (10:30 - 10:45) on 30 January 2021,about 8.05% higher than the previous year's peak demand recorded at 175.84 GW (07:45 - 08:00) on 18thFebruary 2020, during the same quarter.Region-wise Demand Met Profile 2021 EAL, IIT Kanpur
Power Chronicle3Significant variation in demand profile canbe seen across the months of January,February and March of some regions.Southern and Western region witnessedsignificant decline in electricity demandduring night hours in January.In March, almost no variation in demand isseen till evening in the Eastern region;however, demand has increased in nighthours.Demand and generation profiles at national, regional and state-level can be accessed on EAL's web portal.All India Renewable Energy (RE) Generation ProfilethAll India peak RE generation reached 32.22 GW (12:00 - 12:15) on 30 March 2021, about 9.78% higher than theprevious year's peak of 29.35 GW (12:30 – 12:45) on 22nd January, 2020 during the same quarter.Short-term Energy Transactions 2021 EAL, IIT Kanpur
Power Chronicle4Monthly Short-term (ST) Purchase and Sale Quantum across StatesPower Market Overview & AnalysisDAM – Market Clearing Price (MCP) & Market Clearing Volume (MCV) 2021 EAL, IIT Kanpur
Power Chronicle5Term-Ahead Market (TAM)The weighted average clearing price observed in Intra-day market during January to March quarter is higher incomparison to the Day-Ahead Contingency market. Also, the proportion of sell bids is much higher whencompared to purchase bids placed in the Term-Ahead Market.RTM – Market Clearing Price (MCP) & Market Clearing Volume (MCV)Green Term-Ahead Market (G-TAM)The weighted average clearing price of Non-Solar is higher in comparison to Solar in Day-Ahead transactionduring January to March quarter. Also, the proportion of sell and purchase bids in Solar is higher when comparedto the bids placed in Non-Solar.Note: The above power market overview and analysis are based on the data obtained from IEX. 2021 EAL, IIT Kanpur
Power Chronicle6RTM Vs DAM on Market Clearing Price (MCP)The price difference between RTM and DAM is calculated only in cases where the former exceeds thelatter. The block-wise RTM price exceeds the DAM price for about 51.60%, 51% and 31% of the days forthe month of January, February and March, respectively.For block (22:00 - 22:15), 97% of the days in the month of January, RTM prices surpass DAM prices.Maximum difference between RTM and DAM price was observed to be 1152.96/MWh (10:45 -11:00),1130.24/MWh (19:45 - 20:00) and 1514.04/MWh (20:30 - 20:45) in January, February and March,respectively.Note: The above RTM vs DAM on MCP is based on the data obtained from IEX. 2021 EAL, IIT Kanpur
Power Chronicle7Regulatory & Policy PerspectivePOSOCO-NLDC Detailed Guidelines on Ramping AssessmentPOSOCO-NLDC released "Detailed Guidelines for Assessment of Ramping Capability of Inter StatethGenerating Stations (ISGS)" on 30 Dec., 2020.The document lays down a detailed procedure for evaluation of ramping capability for providing additional(reduction of) RoE for achieving (failure to achieve) minimum ramping rate of 1%/min*. The detailedguideline for assessment of ramping is summarized below.1. Generators to declare "Declared Ramp Up and Ramp Down Rate (MW/Block)" to the concerned RLDC.2. The RLDC prepares a schedule based on declared capacity, technical minimum and declared ramp rate,taking into account the impact of Automatic Generation Control (AGC). The Scheduled Ramp Rate (SRRt)due to change in injection schedule across time blocks is given as:SRRt Net Injection Schedulet – Net Injection Schedulet-1Net Injection Schedulet Final Injection Schedulet AGC MWtwhere, AGC MWt is the 15-minute average of (AGC Setpoint – Unit Load Setpoint) for tth time block.3. Actual Ramp Rate (ARR) is: ARRt Actual Average Generationt – Actual Average Generationt-14. Td/Tm measures ability of the generator to achieve the declared ramping rate ( 1%) excluding period ofexigencies. Furthermore, a generating station achieving the declared ramping rate at least during 85% ofsuch time blocks would be eligible for further evaluation for additional RoE (See Figure 1). Reduction inRoE would not be applicable even if the declared ramping rate has been achieved during 85% of such timeblocks. Td is the number of blocks when both "Declared Ramp Up and Ramp Down Rate" are 1%. Tm istotal number of time blocks in the period of computation.5. E/D and F/D ratios represent the proportion of time blocks in which a generating station is able to achieveits SRR and a minimum ramp rate of 1%, respectively. To account for exigencies, an ISGS achieving theramp rate SRR at least for 75% of D is eligible for additional RoE. E/D and F/D proportion is used forgiving additional (reduction of) RoE by 0.25% as per Tariff Regulations, respectively.where, D is the number of blocks, when SRRt 1% in the net injection schedule; E is a subset of D withARRt SRRt, and if SRRt-1 0.5% and ARRt 50% of SRRt; and F is the subset of D when ARR 1%, and ifSRRt-1 0.5%, and ARRt 0.5%.6. Change in RoE shall be effected only when D 60*M for calculating E/D, or D 90*M for calculatingF/D to ensure ISGS have sufficient opportunity toT /Tdemonstrate ramping capability (Figure 1). Where, M is NoSTART0.85the number of months.dmYes7. Actual Average Ramp Rate (AARR) is average of ARR inblocks D, when SRR is 1%.When SRRt-1 0.5%: AARR shall be incorporated asbelow:if (AARR SRR)then AARR AARRelseD90*M?NoYesF/D0.7560*M D 90*MNoYesYesNoReduction in RoE by0.25%E/D0.75NoYesAdditional RoE (%) (Integer (AARR)-1)*0.25No Change inRoEAARR Min (2*AARR, SRR)endNote *: Here onward, unit of the ramp rate is written as % instead of %/min.STOPFigure1: Flow chart of RoE calculation for ISGS 2021 EAL, IIT Kanpur
Power Chronicle8EAL's Opinion'Gate closure' for declaring ramping capability should be specified in line with that used for scheduling.Table 1: Various relaxations for ramping assessment of ISGSTd/Tm 0.85 - Clause 4 (4): A threshold limit of 0.85 assumes that 15% of the time blocks across the yearwitness exigencies. This would be a significant over-estimation for most of the generating stations.Furthermore, the blocks with DC 0 or schedule technical minimum are already excluded from Tm. Sincevarious exigencies can be identified and recorded, such time blocks can then be excluded while calculatingTd/Tm.The guidelines seem to suggest that number of time blocks (Td) considered already exclude exigencies. If so,the threshold limit of 0.85 would not at all be justified. It is also important to note that the generating stationsare allowed full recovery of fixed charges at 85% of availability.Calculation of E and F for ARRt 50% of SRRt - Clause 4 (5): While calculating E, a SRR of 0.5% in apreceding time block assumes that the concerned generating station would experience technical challengesin bolstering up its ramping, for example, from 0.5% (t-1) to 1% (t) in the subsequent time block. It is likelythat generating stations may often be subjected to such incrementally higher ramp rate. While, an increase inSRR from 0.51% to 1.0% may be justified, whereas 0.5% to 0.9% may not be.The 50% relaxation applicable for subsequent time block may often result in ARR 0.5. For example, itwould be ironic that an ARR of 0.4% (against SRR of 0.8%) would be acceptable for a subsequent timeblock. While preceding time block may have already witnessed SRR or ARR 0.5%. We suggest that thisrelaxation should be lowered, and the resultant qualifying ARR ( to be counted in E) should at least be 0.5%.This relaxation should only be applicable in case of SRR 0.5% and ARR 0.5% (i.e. not if ARR 0.5%).Ramp rate tolerance of 10% - Clause 4 (6): The perceived randomness (of physical systems) inherentlyassumes a skewed distribution, wherein a 10% shortfall in ARR is condoned but 10% over-achievement ofARR is incentivized. From the perspective of beneficiaries, a similar tolerance should then also be providedon over achievement of ARR i.e., an ARR 1.1% should be counted as ARR 1%, thus saving payment ofincentive.D 60M for E/D and D 90M for F/D - Clause 4 (10): The provision for additional RoE or reduction inRoE is applicable across the whole year, whereas higher (scheduled) ramping capability needs to bedemonstrated only 2-3 blocks/day, and which may be achievable in an economical manner.Cumulative impact of relaxations: The relaxation in key parameters (Tm, Td/Tm, E & F, E/D & F/D, ramprate tolerance) towards assessment of demonstrated ramping results in cumulative relaxation of 23.5% to66.25% while calculating eligibility for additional (penal) RoE.The overall framework merits further discussions to address some of the identified issues to ensuring that theguidelines are fair and equitable, while also providing sufficient incentive (penalty) for over (under)performance of ramping capability. Analysis of system/generator-wise data should provide input for same.We request your feedback for making EAL and this newsletter more relevant to the sector.Log on to our portal or write to us at:Team Power ChronicleEnergy Analytics Lab (EAL)Department of Industrial and Management EngineeringIndian Institute of Technology KanpurE-mail: eal@iitk.ac.inPhone: 0512-259 6448Dr. Anoop Singheal.iitk.ac.inProfessor, Dept. of IMEIndian Institute of Technology KanpurFounder & Coordinator, CER and EALWebsite: www.iitk.ac.in/ime/anoops/Other Initiativescer.iitk.ac.inems.iitk.ac.inDisclaimer: Though due care and caution has been taken during the compilation and reporting of data, EAL or IIT Kanpur do not guarantee theaccuracy, adequacy or completeness of any information published herein. Any opinions, analyses or estimates contained in this document representthe judgement of Energy Analytics Lab at this time and are subject to change without notice. Readers of this newsletter are advised to seekprofessional advice before taking any course of action or decision based on the contents presented here. EAL or IIT Kanpur do not accept anyresponsibility for the consequences of the same.Register at eal.iitk.ac.in to access data and resources 2021 EAL, IIT Kanpur
latter. The block-wise RTM price exceeds the DAM price for about 51.60%, 51% and 31% of the days for the month of January, February and March, respectively. For block (22:00 - 22:15), 97% of the days in the month of January, RTM prices surpass DAM prices. Maximum difference between RTM and DAM price was observed to be 1152.96/MWh (10:45 -11:00),


![[MS-XLSX]: Excel (.xlsx) Extensions to the Office Open XML .](/img/31/ms-xlsx.jpg)
