Transcription
Space Sci Rev (2018) 214:96https://doi.org/10.1007/s11214-018-0531-4The Heat Flow and Physical Properties Package (HP3 )for the InSight MissionT. Spohn1 · M. Grott1 · S.E. Smrekar2 · J. Knollenberg1 · T.L. Hudson2 · C. Krause3 ·N. Müller1 · J. Jänchen1 · A. Börner4 · T. Wippermann5 · O. Krömer5,6 ·R. Lichtenheldt7 · L. Wisniewski8 · J. Grygorczuk8 · M. Fittock5,9 · S. Rheershemius5 ·T. Spröwitz5 · E. Kopp4 · I. Walter4 · A.C. Plesa1 · D. Breuer1 · P. Morgan10 ·W.B. Banerdt2Received: 23 February 2018 / Accepted: 26 July 2018 / Published online: 2 August 2018 The Author(s) 2018Abstract The Heat Flow and Physical Properties Package HP3 for the InSight mission willattempt the first measurement of the planetary heat flow of Mars. The data will be taken atthe InSight landing site in Elysium planitia (136 E, 5 N) and the uncertainty of the measurement aimed for shall be better than 5 mW m 2 . The package consists of a mechanicalhammering device called the “Mole” for penetrating into the regolith, an instrumented tetherwhich the Mole pulls into the ground, a fixed radiometer to determine the surface brightnesstemperature and an electronic box. The Mole and the tether are housed in a support structure before being deployed. The tether is equipped with 14 platinum resistance temperaturesensors to measure temperature differences with a 1-σ uncertainty of 6.5 mK. Depth is determined by a tether length measurement device that monitors the amount of tether extractedfrom the support structure and a tiltmeter that measures the angle of the Mole axis to thelocal gravity vector. The Mole includes temperature sensors and heaters to measure the regolith thermal conductivity to better than 3.5% (1-σ ) using the Mole as a modified line heatThe InSight Mission to Mars IIEdited by William B. Banerdt and Christopher T. RussellB T. Spohntilman.spohn@dlr.de1DLR Institute of Planetary Research, Rutherfordstr. 2, 12489 Berlin, Germany2Jet Propulsion Laboratory, California Institute of Technology, Oak Grove Drive, Pasadena,CA 91109, USA3DLR MUSC Space Operations and Astronaut Training, Linder Höhe, 51147 Köln, Germany4DLR Institute of Optical Sensor Systems, Rutherfordstr. 2, 12489 Berlin, Germany5DLR Institute of Space Systems, Robert-Hooke-Str. 7, 28359 Bremen, Germany6Present address: Astrium, Bremen, Germany7DLR Institute of System Dynamics and Control, Münchener Strasse 20, 82234 Wessling, Germany8Astronika Sp. z o.o., ul. Bartycka 18, 00-716 Warszawa, Poland9Present address: OHB, Bremen, Germany10Colorado Geological Survey, 1801 19th Street, Golden, CO 80401, USA
96Page 2 of 33T. Spohn et al.source. The Mole is planned to advance at least 3 m—sufficiently deep to reduce errors fromdaily surface temperature forcings—and up to 5 m into the martian regolith. After landing,HP3 will be deployed onto the martian surface by a robotic arm after choosing an instrument placement site that minimizes disturbances from shadows caused by the lander and theseismometer. The Mole will then execute hammering cycles, advancing 50 cm into the subsurface at a time, followed by a cooldown period of at least 48 h to allow heat built up duringhammering to dissipate. After an equilibrated thermal state has been reached, a thermal conductivity measurement is executed for 24 h. This cycle is repeated until the final depth of5 m is reached or further progress becomes impossible. The subsequent monitoring phaseconsists of hourly temperature measurements and lasts until the end of the mission. Modelcalculations show that the duration of temperature measurement required to sufficiently reduce the error introduced by annual surface temperature forcings is 0.6 martian years for afinal depth of 3 m and 0.1 martian years for the target depth of 5 m.Keywords Mars · Heat flow · Regolith · Thermal conductivity · Temperature gradient ·Surface temperature · Radiometer · Thermal inertia1 Introduction1.1 Scientific ObjectivesPlanets in general and terrestrial planets such as Mars in particular can be regarded as engines that convert heat into mechanical work (geology) and magnetic field energy (e.g.,Spohn 2015). Heat was stored in their interiors during accretion and differentiation early onand has been generated by the decay of the long-lived radiogenic isotopes of U, Th and Kever since. Heat is transferred to the surface of terrestrial planets by conduction through thelithosphere including the crust where it can be measured as the surface heat flow. Measuringthe surface heat flow of Mars is the main task of the Heat Flow and Physical PropertiesPackage (HP3 ) onboard the InSight mission. The instrument described in the present papermeasures the surface temperature and the temperature gradient as well as the thermal conductivity in the topmost 5 m of the Martian regolith. The surface heat flow is calculated fromthe temperature gradient and the thermal conductivity. The rate of advance of the probe todepth places constraints on the mechanical properties of the regolith.While thermal conduction through the lithosphere characterizes regions lacking tectonism and volcanism, heat transport by convection dominates in the sub-lithospheric mantleand possibly in the core. Convection is the mechanism by which heat can be converted intomechanical work and is fundamental to dynamo mechanisms that generate magnetic fieldsin planetary cores. The heat flow from the interior of a planet is indicative of the rates ofinternal heat and mass transfer but also of the concentration of radiogenic elements and thusthe composition of the planet. Numerical modeling of heat transfer in planetary interiorssuggests that the rate of heat production can be estimated from the surface heat flow. Plesaet al. (2015) find the ratio between the integrated interior heat production rate and the surface heat flow—termed the bulk Urey ratio—to likely be 0.6 for present Mars. Comparisonwith published Urey ratios for Earth must be considered carefully as these are often mantleUrey ratios (ratio between heat flow from the mantle and the mantle heat production rate)that tend to be smaller than bulk planet Urey ratios. Estimates for the Earth bulk Urey ratiorange mostly from 0.3 to 0.5 (see Jaupart and Mareschal 2015 for a recent review). Heat
InSight HP3Page 3 of 33 96piping through volcanism, for instance, (e.g., Breuer and Spohn 1993; Nakagawa and Tackley 2012) may be causing a smaller bulk Urey ratio for Earth, which is significantly morevolcanically active than Mars at present.Estimates of the martian surface heat flow in the literature vary. Most are based on coolingmodels using parameterized convection schemes and compositional models (e.g., Stevensonet al. 1983; Spohn et al. 2001; Hauck and Phillips 2002; Fraeman and Korenaga 2010; Grottet al. 2010; Morschhauser et al. 2011) or fully dynamical convection schemes (e.g., Kieferand Li 2009; Plesa et al. 2015, 2016a). Others use estimates of the thickness of the lithosphere, its basal temperature and thermal conductivity (e.g., McGovern et al. 2002, 2004;Grott et al. 2005, 2007; Ruiz et al. 2009; Phillips et al. 2008). All these models are rathercrude estimates, using reasonable albeit not directly measured quantities. In any case, theestimates suggest the martian present day surface heat flow to be around 20–30 mW m 2 ,for some geochemical models (Lodders and Fegley 1997) even 50 mW m 2 . A simple comparison with the Earth average surface heat flow of 95 mW m 2 (e.g., Jaupart and Mareschal2015) confirms an estimate of roughly 35 mW m 2 observing that for the same compositionthe surface heat flow should scale with the radius of the planet times its average density.For present-day Mars, tidal dissipation and dynamo action are negligible as sources andsinks of heat. As a comparatively small planet without operating plate tectonics, Mars isbelieved to have cooled by thickening of its massive lithosphere and convective vigour in themantle is believed to have decreased compared to earlier epochs such as the Noachian whenthe planet was much more volcanically active (e.g., Greeley and Spudis 1981; Spohn et al.1998). Thermal evolution models suggest that the surface heat flow should have decreasedwith the convective vigour but also because the radiogenic heat production rate decreaseswith time (e.g., Breuer and Moore 2015) by roughly a factor of 1.5 to 2 since the Noachian.Surface heat flow varies between geological provinces on Earth. For example, at midoceanic ridges, where upwelling mantle flow reaches the surface, heat flow is up to several100 mW m 2 while on continental shields, where a thick lithosphere covers the convectingmantle, a few 10 s of mW m 2 are observed (see Jaupart and Mareschal 2015 for a recentreview). In addition to the mantle contribution, the variation of the surface heat flow is astrong function of the variation of the thickness of the crust and lithosphere. The variationwith the lithosphere thickness has been used to estimate paleo-heat flow values on Mars(e.g., Schultz and Watters 2001; McGovern et al. 2002, 2004; Grott et al. 2005; Kronberget al. 2007; Ruiz et al. 2009; Hauber et al. 2010). The crust is generally understood as beinga product of partial melting of the mantle. Heat producing elements, because of their valencestates and large ionic radii, tend to be enriched in partial melt and therefore crustal rock isenriched as compared with mantle rock (e.g., Taylor 2008; Hofmann 2014), likely forming adominating contribution to the surface heat flow. On a planet like Mars where the convectingmantle is covered by a thick lithosphere, variations in surface heat flow may largely reflectvariations in crustal thickness as has been suggested by e.g., Plesa et al. (2016a). SEIS(Lognonné et al. 2018) will measure the crustal thickness to within 10 km, whereas atpresent the uncertainty is a factor of two, at least.Unfortunately, the heat flow from the interior of a terrestrial planet is small in comparisonwith the solar flux, and surface temperature variations are mostly caused by variations in insolation and atmospheric heat transfer. Therefore, the surface heat flow cannot be measureddirectly as infrared luminosity as has been done for giant planets (e.g., Guillot and Gautier2015) or for Io (e.g., Spencer et al. 2000). Rather, the surface heat flow is calculated froma measurement of the near surface temperature gradient and the regolith thermal conductivity (Bullard 1939, 1954, see also Hagermann 2005 and Jaupart and Mareschal 2015 forreviews) taking the tacit assumption that the surface heat flow is in equilibrium with the heat
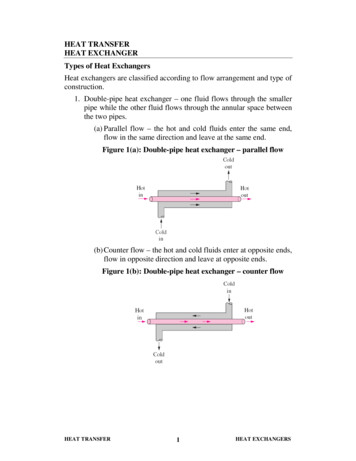
96Page 4 of 33T. Spohn et al.flow from the deeper interior. In general, the temperature gradient needs to be measured ata depth where perturbations caused by variations in solar insolation and atmospheric disturbances are sufficiently small. Other disturbances may be due to past climate change (Mellonand Jakosky 1992) caused by e.g., obliquity variations (Laskar et al. 2004) but these shouldbe sufficiently small at the InSight landing site near the equator. However, it is worth noting that for the mid and upper latitudes, climate induced signals can actually dominate thesurface heat flow. Moreover, regional context needs to be considered (Siegler and Smrekar2014). In any case, no near surface temperature gradient and thermal conductivity data havehitherto been taken at Mars and the InSight mission will be the first to attempt to measureits surface heat flow.In the absence of direct measurements, martian heat flow has been estimated from thedeformation of the lithosphere under mechanical loads (e.g., Schultz and Watters 2001; McGovern et al. 2004; Grott et al. 2005; Ruiz et al. 2009; Phillips et al. 2008), yet large uncertainties are associated with this method. Interpretation of the obtained heat flow estimates isfurther complicated by the fact that the time of load emplacement does not necessarily represent the time the lithospheric shape was frozen-in, as lithospheric deformation will usuallycontinue after loading is finished. This is due to lithospheric stress relaxation by creep (Albert and Phillips 2000), a process particularly important for multi-layer rheologies (Brownand Phillips 2000). Further, the crater retention age of the corresponding surfaces may notrepresent the time of deformation (Beuthe et al. 2012), as they may have been overprintedby later activity.Therefore, direct heat flow measurements are needed to constrain the thermal state ofMars (e.g., Grott et al. 2007; Dehant et al. 2012). Without plate tectonics, Mars can beconsidered geophysically less complex than the Earth and average surface heat flow onMars can likely be constrained from measurements at only a few well chosen sites (Plesaet al. 2016a). Terrestrial heat flow is also affected by hydrothermal circulation which has notoperated on Mars for billions of years. Surface heat flow variations on Mars are expectedto be mostly driven by differences in crustal thickness as well as by the distribution of heatproducing elements and this contribution (Hahn et al. 2011) can be estimated from modelsof crustal thickness (Zuber et al. 2000; Neumann et al. 2004; Wieczorek and Zuber 2004)as well as gamma ray spectroscopy data (Taylor et al. 2006a,b). Mantle dynamics shouldplay a smaller role as far as variations in regional heat flow are concerned (Grott et al. 2010;Plesa et al. 2016a) except perhaps for major plumes such as possibly underneath Tharsis andElysium. Even a single measurement will serve as an important anchoring point for modelsof the martian thermal evolution, and global estimates can be obtained by extrapolating thelocal measurement using complementary global data-sets.One example for a model of the present-day heat flow is shown in Fig. 1 (see Plesa et al.2015, 2016a for a more detailed discussion), where surface heat flow is shown as a functionof geographical location. The map has been calculated from a model of the thermal evolution of Mars from after core formation to the present using a 3D mantle convection code.Estimates of crustal thickness (Neumann et al. 2004), the distribution of heat producing elements (Taylor et al. 2006a), as well as their bulk abundance (Wänke and Dreibus 1994)served as model input. The convection model takes a temperature and pressure dependentviscosity as well as pole-to-equator surface temperature variations into account. As shownin Fig. 1, surface heat flow varies between 17 and 37 mW m 2 between the Hellas basinand the Tharsis province, respectively, and variations generally follow the trend imposedby the assumed crustal thickness, while mantle upwellings play a minor role. Note that thepredicted areas of highest heat flow near Tharsis and Elysium coincide with areas for whichvolcanic resurfacing has been fairly recent (Neukum et al. 2004; Hauber et al. 2011; Vaucheret al. 2009a,b).
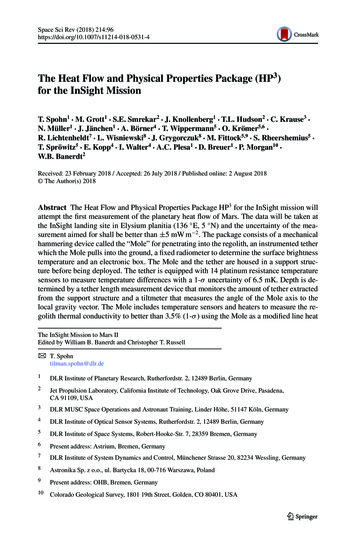
InSight HP3Page 5 of 33 96Fig. 1 Color coded map of the present-day surface heat flow on Mars as predicted by 3D thermal evolutionmodels (Plesa et al. 2015, 2016a). A bulk concentration of heat producing elements following Wänke andDreibus (1994) has been assumed. It is further assumed that the crust is enriched in heat producing elementsby a factor of 10 as suggested by gamma ray data (Taylor 2008). The crust thickness model has been adoptedfrom Wieczorek and Zuber (2004) and is based on recent gravity and topography data. A detailed descriptionof the model and parameter values can be found in Plesa et al. (2016a). The asterisk marks the planned InSightlanding sitePlesa et al. (2015, 2016a) have calculated average surface heat flow values for Mars usingvarious models of the planet’s bulk composition and concluded that some of the compositional models might be distinguishable if the globally averaged surface heat flow of Marswere known. While the models of Treiman et al. (1986) and Wänke and Dreibus (1994) givesimilar values of average surface heat flow between 22.5 and 26.6 mW m 2 and cannot bedistinguished from each other, the model by Lodders and Fegley (1997) implies an averageheat flow about twice as large. For the model of Morgan and Anders (1979), an average surface heat flow of about 30 mW m 2 is calculated. However, this model has a higher Th thanK abundance, which is inconsistent with the elemental abundance ratios obtained for themartian meteorites and the crustal abundances measured from orbit (Taylor et al. 2006a,b).Even with a single point measurement, considering the predicted variation of the heat flowbetween these models and across the surface, HP3 should help to narrow the uncertainties inthe composition of Mars.1.2 Brief Description of the Instrument and Outline of the PaperThe basic components of the Heat Flow and Physical Properties Package are shown in Fig. 2.HP3 will use the Mole, a self-impelling, slow penetrator of about 400 mm length and 27 mmdiameter to carry the Science Tether, a tether equipped with 14 platinum resistance temperature sensors (PT100) to a target depth of at least 3 m and up to 5 m. The instrumented sciencetether is termed TEM-P (for Thermal Excitation and Measurement-Passive), for brevity. Thetemperature measurement will be complemented by measurements of the thermal conductivity using a modified line heat source method at 50 cm intervals as the Mole advancesinto the subsurface. This will be accomplished by heating foils (TEM-A, short for ThermalExcitation and Measurement-Active) integrated in the Mole outer hull that are served with aconstant power and will measure the temperature increase upon heating. The latter is a measure of the heat conducted to the surrounding regolith and thus of its thermal conductivity.
96Page 6 of 33T. Spohn et al.Fig. 2 Elements of the Heat Flow and Physical Properties Package (HP3 ) flight model. Top right: SupportStructure Assembly (SSA) with the cover of the tether compartment removed. The science tether is storedin the upper compartment, the engineering tether in the lower. The Mole is stored vertically in the center ofthe tube, the Mole launch lock is visible at its top. The grappling hook used for deployment of the SSA ontothe martian surface is also attached to the top of the tube. Middle right: Mole and science tether mounted tothe support equipment used for transport. The Mole length is 400 mm from the tip to the end of the backcap.Left: Section of the science tether TEM-P close to the Mole facing end showing the absolute and relativedepth encoding on its left and right edge, respectively. The distance of the three (of 14) temperature sensorsvisible from the tip of the Mole is 497, 727, and 977 mm (from bottom to top), respectively. Bottom middle:The HP3 radiometer. Bottom right: The HP3 back end electronics box, which is mounted inside the lander’swarm electronics box
InSight HP3Page 7 of 33 96The path of the mole will be traced using TLM (short for Tether Length Measurement device) which measures the length of tether paid-out and STATIL (short for STAtic TIltmeter)which measures the attitude of the mole. Before being deployed, the Mole and the tetherwill be housed in the Support Structure Assembly (SSA) which also houses the TLM. Thepackage further includes a radiometer (RAD) mounted on the lander to measure the surfacebrightness temperature. The package will be commanded and data will be handled througha backend electronics (BEE) box housed within the warm electronics box on the lander. TheBEE will be connected to the SSA by the so-called engineering tether. Before deployment,the latter is stored in the SSA as well.The requirements for the sensors, depth of measurement and its duration will be discussed in detail in the following Sect. 2. The hardware will be described in detail in Sect. 3.The heat flow error budget will be discussed in Sect. 4 and the instrument operations inSect. 5.2 Surface Heat Flow, Regolith and Measurement Requirements2.1 Measuring the Planetary Surface Heat FlowIn order to determine the heat flow to the uncertainty required by the mission science goalsof 5 mW m 2 surface thermal perturbations must be avoided as much as possible. OnEarth’s continents, measurements are usually taken in boreholes that are tens to hundredsof meters deep (Pollack et al. 1993), as the shallow subsurface temperatures are dominatedby seasonal temperature changes. The situation is different for the oceanic lithosphere, asthe close-to-constant water temperature at depth allows for measurements to be taken in theupper 5 m of seafloor sediment (Bullard 1954). The technical difficulties associated withdrilling boreholes of sufficient depths on planets other than the Earth have so far only beenovercome during the Apollo program, and successful heat flow measurements have beenperformed during the Apollo 15 and 17 missions. The astronauts emplaced sensors to depthsof 1.38 m and 2.34 m at the Apollo 15 and 17 sites (Langseth et al. 1972, 1976), respectively.The Apollo 16 probe also reached 2 m depth, but the read-out tether was damaged and nomeasurements could be taken. Measurements with such comparatively shallow depth arefeasible because of the low thermal conductivity of the lunar regolith that prevents surfacetemperature perturbations to propagate to larger depths.Heat flow measurements on Mars are expected to be more challenging than on the Moon:First, boreholes on Mars need to be deeper than on the Moon due to the larger expected thermal conductivity on Mars. Though thin, the martian atmosphere within regolith pore spacesconsiderably increases its conductivity compared to the regolith on an atmosphereless body(e.g., Hütter et al. 2008; Piqueux and Christensen 2009a,b). Cements in the regolith (Piqueuxand Christensen 2009b) and aeolian sorting of regolith particle sizes may increase interparticle contact and make the martian regolith more conductive to heat. Martian regoliththermal conductivity is therefore expected to be larger than lunar values by a factor of twoto five (e.g., Grott et al. 2010), requiring measurements on Mars to be both deeper and oflonger duration to achieve the required level of uncertainty.Another difference between the upcoming martian heat flow measurement and the Apolloexperiments is the way the probe will be deployed: While the Apollo astronauts used handheld rotary percussion drill systems to emplace the probes away from surface perturbations(Langseth et al. 1972; Heiken et al. 1991), the HP3 instrument will be placed onto the surfaceby a robotic arm with limited reach. Therefore, perturbations caused by the landing system
96Page 8 of 33T. Spohn et al.and the lander itself need to be taken into account during data analysis (Grott 2009; Kiefer2012). One of these perturbations is the blowing-away of surface dust during landing, ashas been observed for the Phoenix and Curiosity landing sites (Daubar et al. 2015). Thedust removal may result in albedo changes and that, in turn, may change the heat balance.Timescales for dust resettling have been estimated from HIRISE data as well as the rebrightening of rover tracks (Geissler et al. 2010), and resettling can take up to a martian yearor longer. Aeolian sediment transport seems to be the dominant process for re-brightening(Geissler et al. 2010), while fallout of dust from the atmosphere seems to play only a minorrole.Another source of thermal perturbations is the lander itself, which casts shadows duringdaytime and acts as a radiator during the night. In total, the lander is estimated to change theaverage surface temperature by up to 4 K in the vicinity of the lander (Siegler et al. 2017),and lander induced perturbations can thus have a significant influence on the surface energybalance. Care must be taken to remove these contributions during data analysis, and the HP3radiometer will be used to determine the surface brightness temperature variation over theduration of the mission and thus the surface boundary condition for modeling the subsurfacedata.Dust loading of the martian atmosphere is a potential additional source of perturbationthat may affect the surface heat flow measurement. Models using dust opacity data obtainedby the Mars Exploration Rover Opportunity (Lemmon et al. 2015), however, indicate thatthe subsurface heat flow only moderately varies following a global dust storm and that theperturbations are less than 2.5 mW m 2 at depths below 3 m for a thermal conductivity of0.05 W m 1 K 1 . Regional dust storms, which are of shorter duration and smaller magnitudeintroduce even considerably smaller perturbations (Plesa et al. 2016b).Finally, the martian spin axis lacks stabilization due to the absence of a large moon,and chaotic obliquity changes have been predicted from dynamical simulations (Laskaret al. 2004). These calculations are supported by geological evidence that suggests climatechanges on timescales of a few million years (Mustard et al. 2001; Kreslavsky and Head2002; Head et al. 2003; Helbert et al. 2005). However, it has been shown that such long termsignals have only a small effect on the subsurface thermal gradient (Grott et al. 2007), especially if an equatorial landing site is chosen (Mellon and Jakosky 1992). Recently, Lorenz(2015) estimated the influence of a sunspot driven change in insolation on subsurface temperatures, concluding that the signal might be detectable in the InSight data.2.2 Mars Surface and Regolith Properties at the InSight Landing SiteThe physical properties of the regolith at the landing site are of utmost importance to thesuccess of the HP3 experiment. The rate of advancement of the Mole and the final depthreached depend on the soil mechanical properties (e.g., Lichtenheldt et al. 2014; Sewerynet al. 2014). The uncertainty of the heat flow measurement will depend on the thermal properties of the regolith (e.g., Grott et al. 2010). Unfortunately, these values are not well knownfor Mars in general and not for the InSight landing site. What is known about the regolithhas been reviewed in detail with a specific focus on the needs of the InSight mission byGolombek et al. (2017) and by Morgan et al. (2018). In this section, we will restrict ourselves to a short compilation of the most relevant parameter values.High resolution images of the landing site from the HIRISE camera on the Mars Reconnaissance Orbiter (MRO) and thermal emission spectral data at various wavelengths fromthe Viking Thermal Mapper and the Thermal Emission Spectrometer TES on Mars GlobalSurveyor (MGS) have been used to estimate the surface and regolith properties of the landing
InSight HP3Page 9 of 33 96site, such as rock abundance. The landing ellipse has very low rock abundance (Golombeket al. 2017) of only a few percent (fractional area covered by high-thermal inertia rock),an important observation for Mole success. Aeolian processes such as those causing desertpavement on Earth (e.g., Golombek et al. 2006) and granular convection (e.g., the Brazil-nuteffect (e.g., Güttler et al. 2013)) induced by impacts or seismic shaking may cause the rockabundance to decrease with depth. Most rocks at the landing site are concentrated aroundrocky ejecta craters larger than 30-200 m in diameter (Golombek et al. 2013, 2017) wherethe rock abundance can reach up to 35%. The crater size and ejecta observations have beenused to estimate and map the thickness of the regolith giving depths to the underlying competent layer of between 3 and 17 m (e.g., Warner et al. 2017). The competent layer is likelystrong intact basalt (Golombek et al. 2013, 2017). If the Mole encounters a rock larger than afew 10s of cm as it moves forward, it could be blocked from further advancement. The likelihood of such an encounter between the surface and the required (3 m) or target (5 m) depthshas been calculated to be 43% and 59%, respectively. This estimate uses the most pessimisticmodels, where the surface rock abundance is taken as 5% and the Mole is stopped by anyrock regardless of shape or orientation if it is 10 cm or larger. If less conservative assumptions are made about surface rock abundance (e.g., 2.5% or less) and demonstrated capabilities of the Mole are allowed for (e.g., the Mole can push rocks up to 15 cm out of its waywithin the regolith, and can also deflect around rocks encountered at angles 45 degrees),the probability of success increases to 98% and 90%, respectively (Golombek et al. 2017).The thermophysical properties of the landing site also suggest that the regolith that makesup the surface material is conducive to emplacing the heat flow probe (Golombek et al.2017), where low-cohesion, moderate to poorly-sorted and sand-sized grains are amongthe most favorable for Mole movement. The thermal inertia ranges from 130 to 220 witha median value of 180 J m 2 K 1 s 1/2 , the albedo is 0.25, and dust cover index is 0.94(Golombek et al. 2017). Comparison with the thermal inertias of existing landing sites andthe regolith present (Golombek et al. 2008) suggests that the InSight landing site regolithis composed of cohesionless or low cohesion sand (cohesions of less than a few kPa, angleof internal friction of 30–40 ), with bulk density of 1000–1600 kg m 3 , particle sizes of 150–250 µm (fine sand), that extends to a depth of at least several tens of centimeters, andwith surficial dust (of low abundance) less than 1–2 µm (Golombek et al. 2017). Tests withQuartz sand at DLR Bremen have shown that the Mole can advance to 5 m depth in suchsands within less than 10 hours.With the above estimates of a representative thermal inertia and a near surface densitytimes heat capacity of 8 105 J m 3 (Morgan et al. 2018), the thermal conductivity at thesurface can be estimated to be 0.017 to 0.048 W m 1 K 1 . Using relationships establishedin the laboratory (Presley and Christensen 1997; Presley and Craddock 2006), the thermalconductivity is likely dominated by that of the CO2 gas contained in the regolith. The lattervaries primarily with gas pressure and particle s
96 Page 2 of 33 T. Spohn et al. source. The Mole is planned to advance at least 3 m—sufficiently deep to reduce errors from daily surface temperature forcings—and up to 5 m into the martian regolith.