![[IRT] Item Response Theory - Stata](/img/54/irt.jpg)
Transcription
STATA ITEM RESPONSE THEORYREFERENCE MANUALRELEASE 14 A Stata Press PublicationStataCorp LLCCollege Station, Texas
Copyright c 1985–2015 StataCorp LLCAll rights reservedVersion 14Published by Stata Press, 4905 Lakeway Drive, College Station, Texas 77845Typeset in TEXISBN-10: 1-59718-157-9ISBN-13: 978-1-59718-157-0This manual is protected by copyright. All rights are reserved. No part of this manual may be reproduced, storedin a retrieval system, or transcribed, in any form or by any means—electronic, mechanical, photocopy, recording, orotherwise—without the prior written permission of StataCorp LLC unless permitted subject to the terms and conditionsof a license granted to you by StataCorp LLC to use the software and documentation. No license, express or implied,by estoppel or otherwise, to any intellectual property rights is granted by this document.StataCorp provides this manual “as is” without warranty of any kind, either expressed or implied, including, butnot limited to, the implied warranties of merchantability and fitness for a particular purpose. StataCorp may makeimprovements and/or changes in the product(s) and the program(s) described in this manual at any time and withoutnotice.The software described in this manual is furnished under a license agreement or nondisclosure agreement. The softwaremay be copied only in accordance with the terms of the agreement. It is against the law to copy the software ontoDVD, CD, disk, diskette, tape, or any other medium for any purpose other than backup or archival purposes.The automobile dataset appearing on the accompanying media is Copyright c 1979 by Consumers Union of U.S.,Inc., Yonkers, NY 10703-1057 and is reproduced by permission from CONSUMER REPORTS, April 1979.Stata,, Stata Press, Mata,, and NetCourse are registered trademarks of StataCorp LLC.Stata and Stata Press are registered trademarks with the World Intellectual Property Organization of the United Nations.NetCourseNow is a trademark of StataCorp LLC.Other brand and product names are registered trademarks or trademarks of their respective companies.For copyright information about the software, type help copyright within Stata.The suggested citation for this software isStataCorp. 2015. Stata: Release 14 . Statistical Software. College Station, TX: StataCorp LLC.
Contentsirt . . . . . . . . . . . . . . . . . . . . . . . . . . . . . . . . . . . . . . . . . . . . . . . . . . . Introduction to IRT modelsControl Panel . . . . . . . . . . . . . . . . . . . . . . . . . . . . . . . . . . . . . . . . . . . . . . . . . IRT Control Panel118irt 1pl . . . . . . . . . . . . . . . . . . . . . . . . . . . . . . . . . . . . . . . . . . . . . . One-parameter logistic modelirt 1pl postestimation . . . . . . . . . . . . . . . . . . . . . . . . . . . . . . . . Postestimation tools for irt 1pl2737irt 2pl . . . . . . . . . . . . . . . . . . . . . . . . . . . . . . . . . . . . . . . . . . . . . . Two-parameter logistic modelirt 2pl postestimation . . . . . . . . . . . . . . . . . . . . . . . . . . . . . . . . Postestimation tools for irt 2pl4253irt 3pl . . . . . . . . . . . . . . . . . . . . . . . . . . . . . . . . . . . . . . . . . . . . Three-parameter logistic modelirt 3pl postestimation . . . . . . . . . . . . . . . . . . . . . . . . . . . . . . . . Postestimation tools for irt 3pl5869irt grm . . . . . . . . . . . . . . . . . . . . . . . . . . . . . . . . . . . . . . . . . . . . . . . . . . Graded response modelirt grm postestimation . . . . . . . . . . . . . . . . . . . . . . . . . . . . . . . Postestimation tools for irt grm7485irt nrm . . . . . . . . . . . . . . . . . . . . . . . . . . . . . . . . . . . . . . . . . . . . . . . . . Nominal response model 90irt nrm postestimation . . . . . . . . . . . . . . . . . . . . . . . . . . . . . . . Postestimation tools for irt nrm 100irt pcm . . . . . . . . . . . . . . . . . . . . . . . . . . . . . . . . . . . . . . . . . . . . . . . . . . . . . Partial credit model 105irt pcm postestimation . . . . . . . . . . . . . . . . . . . . . . . . . . . . . . . Postestimation tools for irt pcm 115irt rsm . . . . . . . . . . . . . . . . . . . . . . . . . . . . . . . . . . . . . . . . . . . . . . . . . . . . . Rating scale model 120irt rsm postestimation . . . . . . . . . . . . . . . . . . . . . . . . . . . . . . . Postestimation tools for irt rsm 129irt hybrid . . . . . . . . . . . . . . . . . . . . . . . . . . . . . . . . . . . . . . . . . . . . . . . . . . . Hybrid IRT models 134irt hybrid postestimation . . . . . . . . . . . . . . . . . . . . . . . . . . . Postestimation tools for irt hybrid 146estat report . . . . . . . . . . . . . . . . . . . . . . . . . . . . . . . . . . . . . . . Report estimated IRT parameters 152irtgraph icc . . . . . . . . . . . . . . . . . . . . . . . . . . . . . . . . . . . . . . . . . Item characteristic curve plot 159irtgraph tcc . . . . . . . . . . . . . . . . . . . . . . . . . . . . . . . . . . . . . . . . . Test characteristic curve plot 171irtgraph iif . . . . . . . . . . . . . . . . . . . . . . . . . . . . . . . . . . . . . . . . . Item information function plot 176irtgraph tif . . . . . . . . . . . . . . . . . . . . . . . . . . . . . . . . . . . . . . . . . Test information function plot 182dif . . . . . . . . . . . . . . . . . . . . . . . . . . . . . . . . . . . . . Introduction to differential item functioning 188diflogistic . . . . . . . . . . . . . . . . . . . . . . . . . . . . . . . . . . . . . . . . . . . . . . . . Logistic regression DIF 191difmh . . . . . . . . . . . . . . . . . . . . . . . . . . . . . . . . . . . . . . . . . . . . . . . . . . . . Mantel–Haenszel DIF 196Glossary . . . . . . . . . . . . . . . . . . . . . . . . . . . . . . . . . . . . . . . . . . . . . . . . . . . . . . . . . . . . . . . . . . . .203Subject and author index . . . . . . . . . . . . . . . . . . . . . . . . . . . . . . . . . . . . . . . . . . . . . . . . . . . . . .207i
Cross-referencing the documentationWhen reading this manual, you will find references to other Stata manuals. For example,[U] 26 Overview of Stata estimation commands[R] regress[D] reshapeThe first example is a reference to chapter 26, Overview of Stata estimation commands, in the User’sGuide; the second is a reference to the regress entry in the Base Reference Manual; and the thirdis a reference to the reshape entry in the Data Management Reference Manual.All the manuals in the Stata Documentation have a shorthand ]Getting Started with Stata for MacGetting Started with Stata for UnixGetting Started with Stata for WindowsStata User’s GuideStata Base Reference ManualStata Bayesian Analysis Reference ManualStata Data Management Reference ManualStata Functions Reference ManualStata Graphics Reference ManualStata Item Response Theory Reference ManualStata Longitudinal-Data/Panel-Data Reference ManualStata Multilevel Mixed-Effects Reference ManualStata Multiple-Imputation Reference ManualStata Multivariate Statistics Reference ManualStata Power and Sample-Size Reference ManualStata Programming Reference ManualStata Structural Equation Modeling Reference ManualStata Survey Data Reference ManualStata Survival Analysis Reference ManualStata Time-Series Reference ManualStata Treatment-Effects Reference Manual:Potential Outcomes/Counterfactual OutcomesStata Glossary and Index[M]Mata Reference Manualiii
Titleirt — Introduction to IRT modelsDescriptionRemarks and examplesReferencesAlso seeDescriptionItem response theory (IRT) is used in the design, analysis, scoring, and comparison of tests andsimilar instruments whose purpose is to measure unobservable characteristics of the respondents. Thisentry discusses some fundamental and theoretical aspects of IRT and illustrates these with workedexamples.Binary response modelsirt 1plOne-parameter logistic modelirt 2plTwo-parameter logistic modelirt 3plThree-parameter logistic modelCategorical response modelsirt grmGraded response modelirt nrmNominal response modelirt pcmPartial credit modelirt rsmRating scale modelMultiple IRT models combinedirt hybridHybrid IRT modelRemarks and examplesResearchers are often interested in studying abilities, personality traits, and other unobservablecharacteristics. Throughout this manual, we most often refer to the unobserved characteristic of interestas the latent trait, but we will sometimes also use the term ability.Latent traits cannot be measured directly, because they are unobservable, but they can be quantifiedwith an instrument. An instrument is simply a collection of items designed to measure a person’slevel of the latent trait. For example, a researcher interested in measuring mathematical ability (latenttrait) may design a test (instrument) consisting of 100 questions (items).When designing the instrument or analyzing data from the instrument, the researcher is interestedin how each individual item relates to the trait and how the group of items as a whole relates to thistrait. IRT models allow us to study these relationships.IRT models are used extensively in the study of cognitive and personality traits, health outcomes, andin the development of item banks and computerized adaptive testing. Some examples of applied workinclude measuring computer anxiety in grade school children (King and Bond 1996), assessing physicalfunctioning in adults with HIV (Wu, Hays, Kelly, Malitz, and Bozzette 1997), and measuring thedegree of public policy involvement of nutritional professionals (Boardley, Fox, and Robinson 1999).1
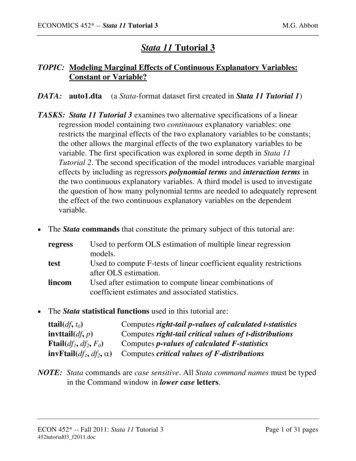
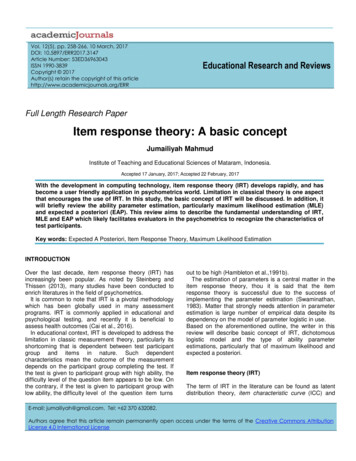
2irt — Introduction to IRT modelsThe bulk of the theoretical work in IRT comes from the fields of psychometrics and educational measurement with key early contributions from Rasch (1960), Birnbaum (1968), Wright andStone (1979), and Lord (1980). Some good introductory IRT reading includes Hambleton, Swaminathan, and Rogers (1991), McDonald (1999), Embretson and Reise (2000), Bond and Fox (2007),and de Ayala (2009). More advanced treatments are presented, for example, in Fischer and Molenaar (1995), van der Linden and Hambleton (1997), Baker and Kim (2004), and De Boeck andWilson (2004).The main concept in IRT is the item characteristic curve (ICC). The ICC describes the probabilitythat a person “succeeds” on a given item (individual test question). In the following graph, we cansee an ICC for one item intended to measure ability. Notice that the probability of this broadly definedsuccess increases as ability increases.0.25Pr(success).5.751Item Characteristic Curve 4 3 2 10Ability1234ICCs will be different for different items. The probability of success on an item is a function ofboth the level of the latent trait and the properties of the item. The latent trait is commonly denoted byθ. The value of θ for a given person is called the person location. The item properties are parameters,commonly known as difficulty and discrimination, that are estimated in the IRT model.The difficulty parameter, or item location, commonly denoted by b, represents the location of anitem on the ability scale. For example, the following graph plots the ICC for items q1, q2, and q3,with difficulty parameters 1, 0, and 1, respectively.
irt — Introduction to IRT models3.25Pr(success).5.751ICC for items with varying difficulty0item q1item q2item q3 4 3 2 10Ability1234Item q1 is the least difficult, and item q3 is the most difficult. Notice that the change in difficultyshifts the ICC along the ability scale (that is, the horizontal axis or x axis). The probability of successon item q1 is higher than the probability of success for the other two items at any ability level. Wecan say item q1 is less difficult than the others because a person would need only an ability levelgreater than 1 on this ability scale to be expected to succeed on item q1. On the other hand, aperson would need an ability level above 0 to be expected to succeed on item q2 and an ability levelabove 1 to be expected to succeed on item q3.In designing an instrument intended to differentiate between all levels of a latent trait, a researchershould try to have items with difficulties spread across the full range of the trait.The second item parameter, discrimination, is related to the slope of the ICC. Discrimination iscommonly denoted by a. This item parameter tells us how fast the probability of success changeswith ability near the item difficulty. An item with a large discrimination value has a high correlationbetween the latent trait and the probability of success on that item. In other words, an item with alarge discrimination parameter can distinguish better between low and high levels of the latent trait.In the graph above, all three items have the same discrimination. In the graph below, all threeitems have the same difficulty, but they have different discrimination values. A highly discriminatingitem differentiates better, around its difficulty value, between persons of similar levels of the latenttrait.
4irt — Introduction to IRT models.25Pr(success).5.751ICC for items with varying discrimination0item q1item q2item q3 4 3 2 10Ability1234Imagine two persons, one with ability just below zero, and the other with ability just above zero.According to the ICC for item q1, these persons would have a similar probability of success onthis item. According to the ICC for item q3, the person with the higher ability level would have asubstantially higher probability of success on this item.Using an IRT model, we can estimate the discrimination and difficulty parameters, a and b, foreach item on an instrument designed to measure a particular latent trait. Throughout this manual, weassume that a single latent trait is sufficient to explain a person’s response behavior on the groupof items. More technically, we assume a unidimensional latent space. We also assume that after wecondition on ability, a person’s responses to an item are independent of his or her responses to otheritems. This is called a conditional independence or a local independence assumption.We can now express a generic functional form of an ICC asPr(success a, b, θ) F {a(θ b)}The difference term (θ b) tells us that the probability of success is a function of the distancebetween item location and person location. When θ b, that is, when item difficulty is matched toa person’s latent trait level, the individual is equally likely to pass or fail the item. When θ b,the individual is more likely to succeed than to fail. Because we can obtain the same distance withdifferent choices of θ and b, we need to provide a metric for θ to identify the model. We do so byassuming θ N (0, 1), which also puts the item difficulty parameter on the same scale as the standardnormal distribution. With the standard normal scale, items with negative difficulties are consideredto be relatively easy, and items with positive difficulties are considered to be relatively hard.For any IRT model, we assume F (·) to be of correct functional form and increasing with the valueof the latent trait. Because probabilities are bounded between 0 and 1, F (·) is usually a variation ofa cumulative logistic distribution.Through choices of F (·) and specification of certain constraints on the estimated parameters, wecan fit a variety of different types of IRT models. Using the irt commands, we can fit IRT modelsto binary, ordinal, and nominal items. Below we demonstrate an IRT model with binary items and anIRT model with ordinal items. For additional information and examples of the models available forbinary items, see [IRT] irt 1pl, [IRT] irt 2pl, and [IRT] irt 3pl. For models with ordinal items, see[IRT] irt grm, [IRT] irt rsm, and [IRT] irt pcm. For models with nominal items, see [IRT] irt nrm. Inaddition to fitting these models, we can better understand each item and its relationship to the latenttrait through a variety of graphs, as demonstrated in the examples below.
irt — Introduction to IRT models5From a broader statistical perspective, IRT models can be viewed as extensions of (unidimensional)confirmatory factor analysis (CFA) models to binary and categorical outcomes and as special cases ofgeneralized linear mixed-effects models; see chapter 1 in De Boeck and Wilson (2004) and chapter 3in Skrondal and Rabe-Hesketh (2004) for a theoretical discussion and Zheng and Rabe-Hesketh (2007)for applied examples.Example 1: Binary IRT modelsIn this example, we present IRT analysis of binary data and highlight some postestimation featuresof irt. We use an abridged version of the mathematics and science data from De Boeck andWilson (2004). Student responses to test items are coded 1 for correct and 0 for incorrect. Here welist the first five observations. use http://www.stata-press.com/data/r14/masc1(Data from De Boeck & Wilson (2004)). list in 00000000000001001100101010Looking across the rows, we see that the first student correctly answered items q1, q2, q3, andq8, the second student correctly answered items q3, q8, and q9, and so on.Let’s say the goal of the test is to assess students’ mathematical ability and perhaps classify thestudents into groups, for example, gifted, average, and remedial. We could look at the total test scorefor each student, but the problem is that the total score depends on the composition of the test.If the test comprises easy items, most students will appear to be gifted, and if the test compriseshard items, most students will be assigned to the remedial group. When the model fits the data, anattractive property of IRT is that, except for measurement error, parameter estimates are invariant;that is, examinee ability estimates are not test dependent, and item parameter estimates are not groupdependent.
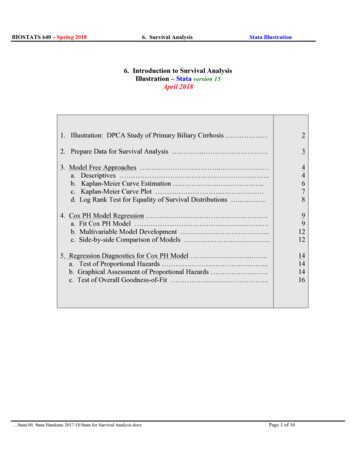
6irt — Introduction to IRT modelsWe fit a 1PL model to binary items q1–q9 as follows. irt 1pl q1-q9Fitting fixed-effects model:Iteration 0:log likelihoodIteration 1:log likelihoodIteration 2:log likelihoodIteration 3:log likelihoodFitting full model:Iteration 0:log likelihoodIteration 1:log likelihoodIteration 2:log likelihoodIteration 3:log likelihoodOne-parameter logistic modelLog likelihood -4142.3516Coef. -4275.6606-4269.7861-4269.7825-4269.7825 -4153.3609 -4142.374 -4142.3516 -4142.3516Std. Err.Number of obsz 800P z [95% Conf. q9Looking at the output table, we see that the first row reports the estimate of the item discriminationparameter, labeled Discrim. In a 1PL model, this parameter is shared by all items. The estimateof 0.85 suggests the items are not particularly discriminating; that is, in the vicinity of a givendifficulty estimate, any two students with distinct abilities would have similar predicted probabilitiesof responding correctly to an item. The remaining rows report the estimates of the difficulty parameters,labeled Diff, for each item. The items appear to cover a wide range of the item difficulty spectrum,with item q8 being the lowest (bb8 2.41) and item q5 being the highest (bb5 1.65).We use estat report to arrange the output in a particular sort order, which, in our example,makes it easy to see which items are easy and which are hard; see [IRT] estat report for details.
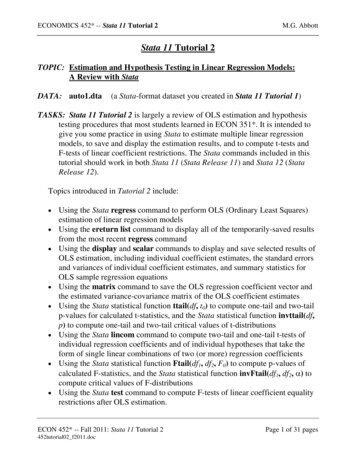
irt — Introduction to IRT models. estat report, sort(b) byparmOne-parameter logistic modelLog likelihood -4142.3516Coef.Number of obsStd. Err.z 7800P z [95% Conf. 1.5613351.913295DiffTo visualize the item locations on the difficulty spectrum, we plot the ICCs for all items usingirtgraph icc; see [IRT] irtgraph icc for details. irtgraph icc, blocation legend(off) xlabel(,alt)Item Characteristic CurvesProbability1.50 4 1.82 .707.3211.33 2.41 1.19 .122 .6931.65Theta4The probabilities represent the expected scores for each item along the latent trait continuum.For the 1PL model, the midpoint probability for each item corresponds with the estimated difficultyparameter.The sum of the probabilities gives us the expected score on the whole test. A plot of the expectedscore against the latent trait is called a test characteristic curve (TCC). Below we plot the TCC forour model using irtgraph tcc; see [IRT] irtgraph tcc for details. The scorelines(2 7) optionspecifies that droplines corresponding to the expected scores of 2 and 7 also be plotted. Accordingto the estimated TCC, these expected scores correspond with the latent trait locations 2.1 and 1.6,respectively.
8irt — Introduction to IRT models. irtgraph tcc, scorelines(2 7)Test Characteristic Curve9Expected Score720 4 2.11.64ThetaThe invariance property of IRT holds only if the model fits the data. One informal method to checkitem fit is to superimpose empirical proportions on an ICC. If the predicted ICC follows closely theempirical trace line implied by the proportions, an item is assumed to have a satisfactory fit.To calculate the empirical proportions, we predict the latent trait and collapse the items by thelatent trait. We then call irtgraph icc with option addplot() to superimpose the proportions onthe ICC. predict Theta, latent(option ebmeans assumed)(using 7 quadrature points). collapse q*, by(Theta). irtgraph icc q1, addplot(scatter q1 Theta) title("ICC and empirical proportions for q1")ICC and empirical proportions for q1Probability1.50 4 20Theta24We see that the fit of the ICC to the implied empirical trace line is poor. This is true for all itemsin the model. It is possible that a 2PL model may be more appropriate for this item. Before we fit a2PL model, we store our estimates for later use.
irt — Introduction to IRT models. estimates store onepTo fit a 2PL model to the data, we type. use http://www.stata-press.com/data/r14/masc1(Data from De Boeck & Wilson (2004)). irt 2pl q1-q9Fitting fixed-effects model:Iteration 0:log likelihoodIteration 1:log likelihoodIteration 2:log likelihoodIteration 3:log likelihoodFitting full model:Iteration 0:log likelihoodIteration 1:log likelihoodIteration 2:log likelihoodIteration 3:log likelihoodIteration 4:log likelihoodTwo-parameter logistic modelLog likelihood -4118.4697Coef. -4275.6606-4269.7861-4269.7825-4269.7825 Std. Err.Number of obszP z 800[95% Conf. 2-.9619361q2q3q4q5q6q7q8q99
10irt — Introduction to IRT modelsNow each item has its own discrimination parameter that models the slope of the ICC for thatitem. In a 1PL model, the discrimination for all items was estimated to be 0.85. Looking at item q1in the output table above, we see that its discrimination is estimated to be 1.62, which correspondsto a steeper slope and should result in a better item fit.Because the 1PL model is nested in a 2PL model, we can perform a likelihood-ratio test to seewhich model is preferred. lrtest onep .Likelihood-ratio test(Assumption: onep nested in .)LR chi2(8) Prob chi2 47.760.0000The near-zero significance level favors the model that allows for a separate discrimination parameterfor each item.Continuing with the 2PL model, we can also plot the amount of information an item providesfor estimating the latent trait. A plot of item information against the latent trait is called an iteminformation function (IIF). We use irtgraph iif to obtain the IIFs for all items in the model; see[IRT] irtgraph iif for details. irtgraph iif, legend(pos(1) col(1) ring(0))Item Information Functions.8q1q2q3q4q5q6q7q8q9Information.6.4.20 4 20Theta24For a 2PL model, IIFs are unimodal and symmetric, and each item provides the maximum amountof information at its estimated difficulty parameter. The height of an IIF and therefore the amount ofinformation an item provides around the difficulty parameter is proportional to the item’s estimateddiscrimination. Items q1 and q8 are most discriminating and have the steepest IIFs.We can sum up all the IIFs to obtain a test information function (TIF). The TIF plot tells us howwell the instrument can estimate person locations; see [IRT] irtgraph tif for details.
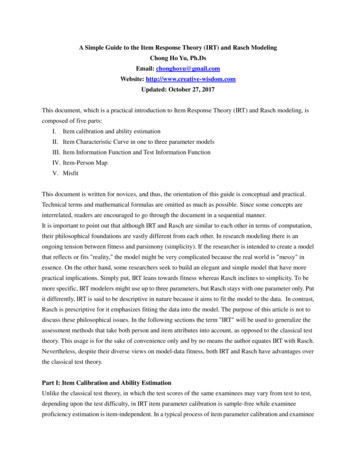
irt — Introduction to IRT models11. irtgraph tif, se1.61.5Information2.7.8Standard Error2.5.93Test Information Function 4 20ThetaTest information24Standard errorThe test provides maximum information for persons approximately located at θ 0.5. As wemove away from that point in either direction, the standard error of the TIF increases, and theinstrument provides less and less information about θ.The TIF is useful in designing instruments targeted at obtaining precise estimates of a person’slatent trait level at specified intervals. If our interest lies in identifying gifted and remedial students,we would like the instrument to be more precise at the extrema of the ability range. If we wish tohave a similar precision of ability estimate across the entire ability range, we would like to see arelatively flat TIF. Because the TIF is a sum of IIFs, we can obtain the desired shape of the TIF byincorporating items targeted at a specified ability interval.The last binary model, not shown here, is a 3PL model. This model adds to the 2PL model byaccommodating the possibility of guessing. We discuss this model in the [IRT] irt 3pl entry.Example 2: Categorical IRT modelsCategorical IRT models include models for ordered and unordered responses. Here we present agraded response model (GRM) for ordered responses.The GRM is an extension of the 2PL model to categorical outcomes. To illustrate the model, weuse the data from Zheng and Rabe-Hesketh (2007). charity.dta contains five survey questions,ta1 through ta5, measuring faith and trust in charity organizations. Responses are strongly agree(0), agree (1), disagree (2), and strongly disagree (3). Higher scores indicate higher levels of distrust.Here we list the first five observations.
12irt — Introduction to IRT models. use http://www.stata-press.com/data/r14/charity(Data from Zheng & Rabe-Hesketh (2007)). list in 1/5, 01.0211Looking across the first row, we see that the first respondent did not provide an answer to itemsta1 and ta5, answered 2 on item ta2, and answered 1 on items ta3 and ta4. All irt commandsexclude missing items for a given observation from the likelihood calculation but keep the nonmissingitems for that observation. If you wish to remove the entire observation from the model, add thelistwise option at estimation time.
irt — Introduction to IRT models13We fit a GRM as follows:. irt grm ta1-ta5Fitting fixed-effects model:Iteration 0:log likelihoodIteration 1:log likelihoodFitting full model:Iteration 0:log likelihoodIteration 1:log likelihoodIteration 2:log likelihoodIteration 3:log likelihoodIteration 4:log likelihoodGraded response modelLog likelihood -5159.2791Coef. -5467.3926 -5467.3926 Number of obs 945Std. Err.zP z [95% Conf. 3ta1DiscrimDiff 1 2 3ta2DiscrimDiff 1 2 3ta3DiscrimDiff 1 2 3ta4DiscrimDiff 1 2 3ta5DiscrimDiff 1 2 3Because the GRM is derived in terms of cumulative probabilities, the estimated category difficultiesrepresent a point at which a person with ability equal to a given difficulty has a 50% chance ofresponding in a category equal to or higher than the difficulty designates; see [IRT] irt grm for details.For example, looking at the estimated parameters of item ta5, we see that a per
naar(1995),van der Linden and Hambleton(1997),Baker and Kim(2004), andDe Boeck and Wilson(2004). The main concept in IRT is the item characteristic curve (ICC). The ICC describes the probability that a person "succeeds" on a given item (individual test question). In the following graph, we can see an ICC for one item intended to measure .