Transcription
Vol. 12(5), pp. 258-266, 10 March, 2017DOI: 10.5897/ERR2017.3147Article Number: 53ED36963043ISSN 1990-3839Copyright 2017Author(s) retain the copyright of this nal Research and ReviewsFull Length Research PaperItem response theory: A basic conceptJumailiyah MahmudInstitute of Teaching and Educational Sciences of Mataram, Indonesia.Accepted 17 January, 2017; Accepted 22 February, 2017With the development in computing technology, item response theory (IRT) develops rapidly, and hasbecome a user friendly application in psychometrics world. Limitation in classical theory is one aspectthat encourages the use of IRT. In this study, the basic concept of IRT will be discussed. In addition, itwill briefly review the ability parameter estimation, particularly maximum likelihood estimation (MLE)and expected a posteriori (EAP). This review aims to describe the fundamental understanding of IRT,MLE and EAP which likely facilitates evaluators in the psychometrics to recognize the characteristics oftest participants.Key words: Expected A Posteriori, Item Response Theory, Maximum Likelihood EstimationINTRODUCTIONOver the last decade, item response theory (IRT) hasincreasingly been popular. As noted by Steinberg andThissen (2013), many studies have been conducted toenrich literatures in the field of psychometrics.It is common to note that IRT is a pivotal methodologywhich has been globally used in many assessmentprograms. IRT is commonly applied in educational andpsychological testing, and recently it is beneficial toassess health outcomes (Cai et al., 2016).In educational context, IRT is developed to address thelimitation in classic measurement theory, particularly itsshortcoming that is dependent between test participantgroup and items in nature. Such dependentcharacteristics mean the outcome of the measurementdepends on the participant group completing the test. Ifthe test is given to participant group with high ability, thedifficulty level of the question item appears to be low. Onthe contrary, if the test is given to participant group withlow ability, the difficulty level of the question item turnsout to be high (Hambleton et al.,1991b).The estimation of parameters is a central matter in theitem response theory, thou it is said that the itemresponse theory is successful due to the success ofimplementing the parameter estimation (Swaminathan,1983). Matter that strongly needs attention in parameterestimation is large number of empirical data despite itsdependency on the model of parameter logistic in use.Based on the aforementioned outline, the writer in thisreview will describe basic concept of IRT, dichotomouslogistic model and the type of ability parameterestimations, particularly that of maximum likelihood andexpected a posteriori.Item response theory (IRT)The term of IRT in the literature can be found as latentdistribution theory, item characteristic curve (ICC) andE-mail: jumailiyah@gmail.com. Tel: 62 370 632082.Authors agree that this article remain permanently open access under the terms of the Creative Commons AttributionLicense 4.0 International License
Mahmuditem characteristic function (ICF). This item characteristiccurve is presented in an item characteristic relation curvewith participant characteristics which is shown on theabscissa while the ordinate shows the probability of theitem answer.The test participant characteristics and itemcharacteristics are related by model in the form offunction or graphical curve (Naga, 1992b). Each questionitem is represented by an ICC showing the relationbetween correct answer probability and the testparticipant ability.In classic theory, the item characteristics will depend onthe ability level of the test participants, if the item iscompleted by participant with high ability, the item showslow difficulty level, in contrast, for participant with low ormedium ability, the item will show high difficulty level. Onthe other hand, item response theory predicts theparticipants' ability from their ability in answering the testitems correctly, the higher their ability, the higher theprobability of correct answer they provide. Likewise, thehigher the item difficulty level, the higher the testparticipants' ability to answer the item correctly. Despite aclaim stating that modern theory cannot substitute classictheory (Zanon et al., 2016), based on the aforementioneddescription, the basic concept of item response theory isconsidered a strong theory compared to that of classictheory.Moreover, recent technology development has madeIRT implementation far easier. Yet, the theory requiresgeneral assumptions or conditions of item responsetheory to satisfy by the items and the test participantsincluding:1. Unidimensional2. Local independency, and parameter invariance.Unidimensional specifically means an exam measureonly one characteristic of the participants (Crocker andAlgina, 1986). Firstly, unidimensional means the examonly measure one character or one ability of the testparticipants. For instance, one set measures ability incalculation and does not disclose the test participantability in understanding or mastering language.Statistically, unidimensional can be calculated with factoranalysis indicated by one dominant factor.Secondly, local independency means that the influenceof participant ability and test item are considered constantin which the participants' response to question item haveno relation statistically. “This assumption will be satisfiedwhen the participants' answer to one item does notinfluence the answer to another item. The participants'answer to several test items is expected to have nocorrelation" (Hambleton et al., 1991c). The implication ofthis assumption results in items analyzable item per item,and likewise the participants are analyzed per individual.Thirdly, parameter invariance that is, "the function of259item characteristics is constant or remains unchangedalbeit the participant group answering the items changes.In the same group, their characteristics will remainunchanged despite the items they answer change”(Naga, 1992b). The invariance is reviewed from the pointof item characteristics and the participant characteristics,difficulty level and distinguishing capacity of the items willremain notwithstanding the question items are answeredby high ability group or low ability group. The participantability will be constant or remain unchanged despite theitems they answer change.The most essential assumptions in item responsetheory are unidimensional and local independency(Embretson and Reise, 2000a). This opinion was alsoproposed by Hambleton (1989). One of the mostcommon assumptions is that in any test, only one abilityis measured by the items instrument. This assumption iscalled unidimensional assumption (Azwar, 2004).Dichotomous logistic modelFurthermore, the advantage of item response theory inrelation with the analysis of the test result is to presentthe basis for making prediction, estimation or conclusionon the participants’ ability. The process of educationmeasurement starts with scoring the item response of theparticipant and response pattern matrix is developed,carrying out initial check on the data conformity bychoosing the parameter model, estimating the itemparameter and the participants ability, and composing thescaling transformation (Hambleton and Swaminathan,1985)Some types of data are analyzed with item responseanalysis model such as dichotomous, polytomous andcontinuous data. In dichotomous data, response to oneitem is shown in two categories such as: true-false, yesno, agree-don't agree. Particularly, the participants’ abilitytest consists of two categories with true or false content.In a test with multiple choice format of five answersoption, the categorization of respondents answer will begrouped into two response categories that is, true or falsewhere correct response will score one and incorrectresponse will score zero (Bejar, 1983)There are three types of logistic model of itemresponse theory that is, single parameter model, dualparameters model, and triple parameters model. Thethree models differ in the number of parameter tocalculate in describing the item characteristics. The singleparameter model calculates only the item difficulty level(bi), while the distinguishing capacity of item (ai) scoresone or constant and the guessing parameter scores (ci)zero. The dual parameters model calculates the itemdifficulty level (bi) and the item distinguishing capacity(ai), while the guessing parameter (ci) scores zero.Whereas, the triple parameters model calculates the
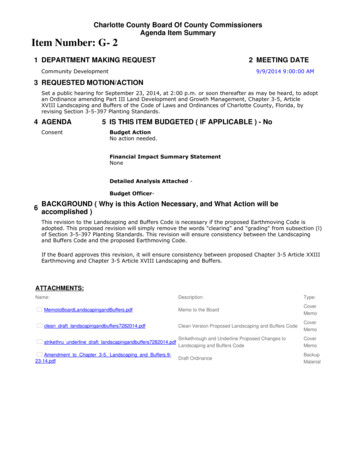
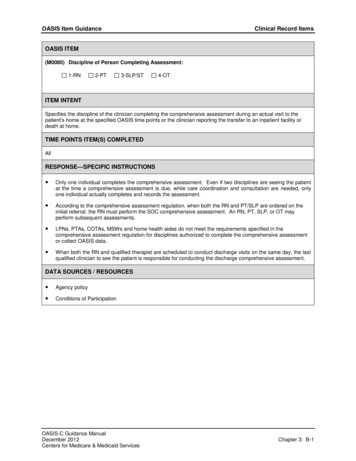
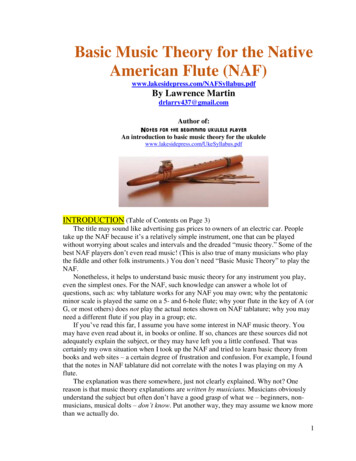
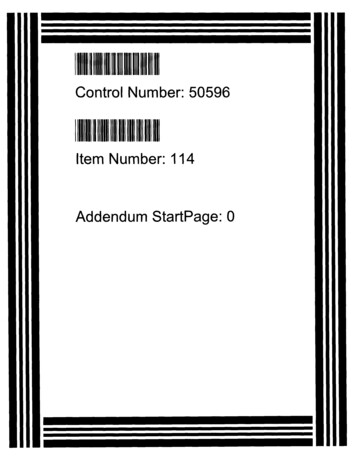
Educ. Res. Rev.Probability of correct response260Figure 1. Item curve of single parameter logistic model (Hambleton et al.,1991c).three parameters that is, bi, ai and ci.level of the items while bi value close to 2.0 indicateshigh difficulty level of the items or difficult question item(Hambleton et al., 1991c).Single parameter logistic modelThe description of single parameter model in an itemcharacteristics curve, bi parameter is a parameterlocation shown in ability scale, named item difficulty level.The higher the item difficulty level, the more to the rightits position in a curve (Lord, 1980b) (Figure 1).In Figure 1, item difficulty level parameter (bi) is a pointin the ability scale to have the opportunity of 50% toanswer correctly. There are three items: the third itemsshow the most right item, and therefore they are theitems with the highest difficulty level (bi 1.0), while thefirst items show the left most items which are the itemswith the lowest difficulty level (bi -1.0), and the seconditems are the items with medium difficulty level that is, b 0.To be able to answer 50% of the first items correctly,participant ability of minimal -1.0 is necessary( 1.0) . To be able to answer 50% of the third itemscorrectly, participant ability of minimal 1 is necessary. 0( 1.0) . The higher bi scores, the higher the abilitynecessary to answer 50% of them correctly. The higher b iscores, the more difficult the items or otherwise, the lowerbi scores, the easier the items.When the ability value is transformed with mean 0and deviation standard 1, the bi value will vary from 2.0 to 2.0. bi value close to - 2.0 indicates low difficultyDual parameter logistic modelIn single parameter model, the form of the curve is similarwhile the dual parameter logistic model calculates thecurves with different curve slopes. The difference in itemscurve indicates the difference of ai value. Items withsteep curve indicates high distinguishing capacity or highai value, while gradient item curve indicates low difficultylevel or low ai value. Subsequently, a chart is presentedshowing two item characteristics with equal and differentdistinguishing capacity (ai) and difficulty level (bi)(Embretson and Reise, 2000b) (Figure 2).Figure 2 shows 4 items with equal and differentdifficulty level, and distinguishing capacity. The first andfourth item have equal difficulty level that is, bi 1, thiscan mean that both items requires participants’ ability of 1.0 to be able to answer 50% of the items correctly.However, both items have different distinguishingcapacity that is, the first items with 0.5 while the fourthitem is ai 1 showing more gradient curve on the firstitems than that of the fourth's, the third items shows steepcurve due to high distinguishing capacity (ai 3), and thesecond items on the left most indicate lowest difficultylevel (bi -1) having the same gradient with the fourthitems since they have the same distinguishing capacity(ai 1).
Mahmud261Item parametersTraitTraitlevelLevelFigure 2. Item Curve of Dual Parameter Logistic Model (Embretson and Reise, 2000b).Theoretically, parameter ai is located at scale - to . However, a difficult case occurs to ai negative value,or it is better to remove items with negative distinguishingcapacity due to possible error, and this indicates correctanswer probability decreases when the ability levelincreases. ai is also unlikely to occur if it is bigger than2.0. The ai value commonly ranges from 0.0 to 2.0. Dualparameter logistic model formula are:figure out the parameter value in a measurement. Thedetermination of parameter value is known as parameterestimation, item parameter and ability parameter;participant ability value estimation is called scoring anditem parameter estimation is called calibration.Ability parameter estimationItem response theory ability estimation(1)Pi ( j ) the j test participant probability with abilityanswer ( j ) the item i correctly (item i 1, 2, 3. n)bi difficulty level parameter of item iai distinguishing capacity of item in number of item in the test.e number with value of 2.718D scaling factor made in order the logistic functionclose to ogive normal function (Embretson and Reise,2000d).Furthermore, to find out the items value (ai and bi) andthe participants ability ( ) in logistic model, we need toEstimation means the process of estimating or predicting.”The estimation contains the finding of value according toparameters of an expression with certain methods”(Makridakis et al.,1999). Estimation is made on regressionmodel and item response theory model, yet they have thefollowing differences:1. Regression model is commonly applied to variable withlinear relation, while parameter logistic model comes withnonlinear relation between question items and participantability.2. Independent variable in the regression is a variablethat can be observed while in item response theory, theparticipants ability independent variable ( ) cannot beobserved (Hambleton et al., 1991a). Since actual value ofitem parameter and participant ability are unknown,analysis and estimation
262Educ. Res. Rev.on respondent ability and items parameter are carriedout.At its emergence in 1950s, item response theory did notgain popularity due to the lack of worthy statisticalestimation procedure (Birnbaum, 1968). After analysismade by using computer, estimation carried out by Bockand Lieberman (1970) shows that computer-madeestimation can be done despite its limitation, that is,analysis is carried out on small number of question itemsand participants sample. The estimation of parameters isa central matter in the item response theory, even it issaid that the item response theory is successful due tothe success of implementing and procedure availabilitythat is up the mark of parameter estimation (Chen W-Hand Thissen, 1999).Item parameter estimation is with the assumption thatthe participants’ ability is known or otherwise, and theitem parameter is known to estimate the participants’ability. The participants’ ability estimation with testinstrument where the items have been calibrated; thequestions whose item characteristics have calculated willbe saved in item bank and will be re-used according tothe objectives and information function of the target test.“Ability estimation procedure can be performed withmaximum likelihood (ML), maximum a posteriori (MAP),and expected a posteriori (EAP), while items estimationcan be performed with estimation approaches includingMaximum Likelihood (ML), Bayesian, logistic regressionand heuristic estimation” (Embretson and Reise, 2000c).Ability estimation with maximum likelihood method iscarried out through calculation process with variousscoring algorithm. The researcher focuses on twomethods that is, MLE and EAP, and provides the detailsfor each method. Estimation method description viewedfrom theoretical point to facilitate the understanding.Based on the writer's experience, the analysis obtainedwith MLE and EAP methods is not exactly the same. Thismay be influenced by factors in data sampling (Mahmudet al., 2016).Ability estimation and item estimation can be carriedout simultaneously that is, an estimation process in whichitem parameter estimation is carried out with abilityestimation. The first step is to estimate the itemparameter, and the result will be used to estimate theability parameter before using it as a value to estimatethe item parameter in the subsequent stage.Henceforth, iteration is carried out in which the valueobtained in the current round will be taken as the initialvalue for the subsequent round; this iteration is carriedout until the value difference between one round andanother becomes a shade of difference calledconvergent. The iteration process will stop when itreaches the convergent, and the parameter valueobtained on the convergent will become the parameterestimation value to figure out.Maximum likelihood estimation (MLE)Maximum likelihood is a common method for modelparameter estimation, sufficiently effective with largesample and valid model application (Longford, 2008). The“likelihood” means probability or possibility, while"maximum" means the highest extent.Therefore, maximum likelihood” is the occurrence withthe highest possibility. In the literatures on item responsetheory, ”Maximum likelihood is a mode of total likelihood”(Bock, 2003). The highest opportunity will depend on theprobability of the correct answers and incorrect answersby the participants, and also on the logistic parameteremployed, thus, the determination of maximum abilityvalue is carried out through iteration calculation (Baker,2001).Ability estimation with maximum likelihood method is acalculation process which aims to figure out maximumability (θ) value of each participant with the symbol ofLi ( ) and value of Pj ( ) obtained from formula 1.Afterwards, the calculation process with formula 2 toformula 5 that can be carried out to calculate abilityestimation with maximum likelihood method throughiteration process in Bilog MG program is: nlog Li ( ) xij log e Pj ( ) (1 xij ) log e 1 Pj ( )j 1 Li ( ) Maximum ability value for each participantPj ( ) Ability probability on each item such as(2)shown in formula 1.xij the number of correct itemsxij the number of incorrect itemsThe maximum likelihood value of each participant's abilityLi ( )is derived in the form of logarithm equalized tozero with the following formula: log Li ( ) n xij Pj ( ) log( ) 0j 1 Pj ( )[1 Pj ( )] (3)ML estimation, , is calculated with Fisher scoringmethod named “Fisher information”. Theoretically, themethod that can be employed in iteration techniquevaries. Yet, common methods to employ are Newton–Raphson and Fisher. The logic in both approaches does
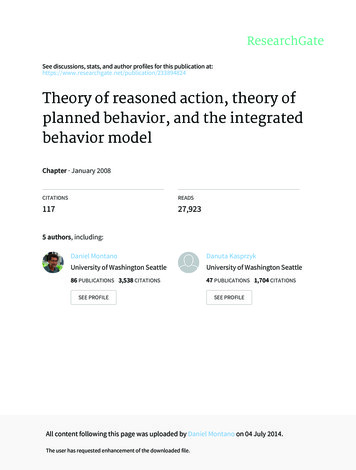
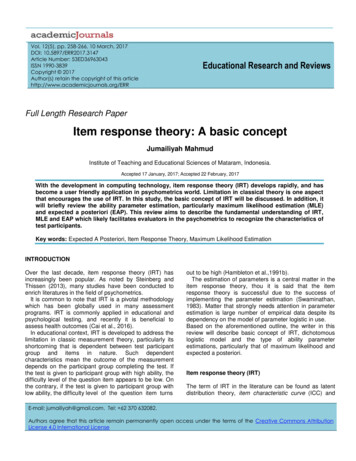
Mahmudnot have significant differences in which Fisher methodemploys "Fisher Information" while Newton-Raphsonemploys "Hessian" as the second "partial derivative"(Brown, 2014). For simplification purpose, the writeremploys Fisher method with information function formulafor dual parameter model as follows:n I ( ) ai2 Pj ( ) 1 Pj ( )j 1(4)I(θ) information function of respondent's abilityθ respondent's ability levelai distinguishing capacity of item iUpon obtaining the ability information score of duallogistic parameter model, the iteration can be determinedwith the following formula: ˆt 1 ˆt I 1( ˆ) log Li ( ˆ) (5) ˆt 1 ability estimation score in the current round ˆt ability estimation score in the previous roundI ( ˆ) information function of the ability log Li ( ˆ) Maximum likelihood estimation scoreof a respondentThe calculation is carried out until the ability score doesnot change in the last round as of the previous round orconvergent. The convergent criterion is 0.05 or 0.01, oreven less such as 0.001. With the convergent calculation, ability estimation score ( ) is obtained.In fact, constraint in the logistic model is commonlyencountered. Theoretically, the curve in logistic modelextends towards 0 or 1 asymptotically. This means thatthe curve will reach 0 or 1 at infinite point that theestimation method is incapable of estimating theparameter when there are items or participants make allcorrect answer or all incorrect answer (Naga, 1992a).Expected A posteriori (EAP) bayesLord (1980a) described possible use of Bayes estimationsince education field usually “give test to the sameparticipant year to year with parallel test or similar test.263Thereby, good description on ability frequency distributionin participants group can be represented”.Birnbaum paradigm is employed to estimate itemparameter, and participant parameter individually andsimultaneously as implemented in LOGIST program. InBilog or Bilog MG program, estimation is made in twostages, the first stage is items estimation followed byability estimation. Data analyzed in maximum likelihoodestimation is the data from the participants’ response orsample data. Bayes estimation procedure uses prior dataand sample data which is used in maximum likelihoodapproach. During the initial use of Bayes approach,Swaminathan and Gifford (1985) used the hierarchyBayesian estimation procedure, yet it was complicated toimplement due to the lack of computer program availablefor such purpose. Researchers have adopted morepragmatic approach in which Bayesian approach isconsidered a tool to improve parameter estimation”(Baker and Kim, 2004a).Posterior distribution estimation is a combination ofprior distribution and sample distribution. The combinationbased on Bayes rule on conditioned probability oftenencounters complicated constraint, and this rendersdifficulty in formulating posterior distribution in statisticswhile Bayes estimation remains opposed due to the useof prior distribution as researcher's subjectiveconsideration (Baker, 1991).Despite Bayes estimation is presumed complicatedfrom other review point, item response estimation isemployed for its practicality, and complicated calculationin accordance with the new development in computerfield that is getting steady and simpler. The estimationdoes not use integration but is based on discretedistribution in “Mislevy quadrature point”.In fact, Baker, on Bayes estimation stated “the latestadvancement in IRT estimation procedure is Bayesestimation implemented for the first time in BILOGprogram (Mislevy and Bock, 1986), that it will be able toaddress various issues that comes with simultaneousestimation approach in JMLE method” (Baker, 1991).EAP ability estimation method estimates respondentability for response pattern of all correct and all incorrect.This method is part of Bayes approach derived from theaverage of posterior distribution, and does not use anymode. Analysis strategy logic employs Bayes principlesin BILOG using Mislevy Histogram, a histogramdescription showing an area in a curve (Baker and Kim,2004b). Figure 3 facilitates the understanding in abilityestimation with Bayes approach as follows:1. Determining Xk (k 1, 2, 3, . q) called nodes. BilogMG default includes 15 nodes.2. There is density in ordinate area that is, histogramordinate. Density or weight is usually taken from normaldistribution as well as from empirical data.3. Since BILOG program does not use Hermit-Gauss that
Educ. Res. Rev.Height of density264Figure 3. Area in a curve (Baker and Kim, 2004b).applies integration, but "Mislevy histogram" instead whilethe it is assumed as normal distribution, then X k valuecan be figured out, A(Xk) weight shows the gap betweenXk and other Xk 1. If Xk shows the same gap than A(Xk)value can be figured out by: one divided into manynodes, otherwise if Xk does not have the same gap thenA(Xk) is Xk where Xk 1 is called weight.4. Calculating L (Xk) value Pj ( ) shows ability probabilityin an item like that obtained from formula 1, while theformula notation is based on Mislevy Histogram usingPj ( ) P( X k )and Xk k , while L.is likelihood function of participant ability with formula inthe form of multiplication such that that is indicated informula 6.P(Xk). Therefore,uij1 uijnL( X k ) Pi ( X k ) Qi ( X k )i 1L( X k )(6) maximum ability value for eachparticipant kXk ability levelPiQiuij1 – uij correct answer probability incorrect answer probability. the number of correct answer the number of incorrect answer5. Calculating ability estimation valueq X k L( X k ) A( X k )k 16. E ( j U j , ) j q L( X k ) A( X k )k 1(7)E( j U j , ) j is average ability level, provide thatparticipants' response in dichotomous 0 or 1 scoring isknownE( j )Xk expected ability value k ability levelA(Xk) weight, indicating gap between Xk and Xk 1 item parameter valueq the number of node (quadrature point), the numberof group by ability level.EAP method will be able to analyze or calculate theparticipant ability notwithstanding that they make allcorrect answer or all incorrect answer; the calculationprocess is carried out without iteration but based onaverage answer score for each participant on answeringa number of items.Relevant to the aforementioned discussion, the workingprinciple of Bayes method starts from posterior data ascombination of sample data and prior data or initial data.In education field, prior data can be obtained from databefore the study's data collection. In the implementationof item parameter or ability parameter estimation, priordata can be made as artificial data by Bilog MG programusing formula 8 and 9 (Baker and Kim, 2004b).
Mahmud N L( X k ) A( X k ) fik qj 1 L( X ) A( X ) k k 1 kfik(8) artificial examinee for each participant ability (Xk)Xk k ability levelA(Xk) weight, indicating gap between Xk and Xk 1q the number of node (quadrature point), the number ofgroup by ability level. N uij L( X k ) A( X k ) rik qj 1 L( X ) A( X ) k 1 kk rikthe ability estimate with EAP method uses formula 6, 7,8, and 9. In actual context, formula 6 is quite similiar toformula 1, but they have different term and symbol asfurther implemented with Mislevy Histogram. Formula 8and 9 are used to create prior artificial data by Bilog MG.CONCLUSIONThe implementation of IRT as a rigid theory entation analysis can be further carried out. Ingeneral, the assumption does not require any test,however, when assumption test is performed then it canbe considered a requirement test even beyond the threeassumption tests that is, fitness model test to figure outwhether the empiric data (items) is suitable for IRTanalysis .Item characteristics including difficulty level (b),distinguishing capacity (a) and correct answer (c); itemcharacteristics calculated in the analysis influence themathematics model employed and logistic parametermodel. Difficulty level only, indicates its single parameterlogistic model; difficulty level and distinguishing capacityindicate dual parameter logistic model; and calculatingthe three characteristic indicates triple parameter logisticmodel.There are three methods that can be used in abilityestimation are, MLE of maximum likelihood group, BayesEAP, and Bayes MAP of Bayes (not discussed) group.Bayes group uses prior data, empirical data andcombination of both data, posterior data, in the analysis.Prior data can be generated by BILOG MG program asartificial data using formulas. While theoretically,Maximum likelihood method does not use prior data. Thismethod is said to have no bias elements yet it often failsin ability and items analysis to determine the estimationvalue; the failure to determine the value on item data allanswered correctly and all answered incorrectly.2(9) artificial data of correct answer in item i of abilitylevel (Xk)Xk 265 k ability levelA(Xk) weight, indicating gap between Xk and Xk 1uij the number of correct answerq the number of node (quadrature point), the number ofgroup by ability level.The aforementioned discussion includes two abilityestimation methods from maximum likelihood approachthat is, maximum likelihood estimation method and fromBayes approach that is, expected a posteriori abilityestimation method. They differ in:1. Calculation procedure, formulas used in the calculation.Maximum likelihood method calculates through iterationprocess while expected a posteriori ability estimationmethod calculates through average answer of eachparticipant for each ability level.2. For participants with all correct answer or all incorrectanswer in maximum likelihood estimation method, theimplementation of joint maximum likelihood estimation(JLME) will not bring calculation result, yet, in thecalculation via Bilog MG program, the ability estimationresult will be displayed.3. Maximum likelihood estimation calculation data isbased on sample data, while expected a posteriorimethod uses prior data generated by Bilog MG programusing formula 8 and 9 as described earlier.In this review, it is understood that ability estimate withMLE method implements formula 2, 3, 4, and 5, whereasCONFLICT OF INTERESTSThe author has not declared any conflict of interests.REFERENCESAzwar S (2004). Dasar-dasar Psikometri. Yogyakarta: Pustaka pelajar.Baker FB (1991). Comparison of minimum logit chi-square andBayesian item parameter estimation. Br. J. Math. Stat. Psychol.44(2):299-313. doi: 10.1111/j.2044-8317.1991.tb00963.x.Baker FB (2001). Estimating an Examinee's Ability. In: Boston C,Rudner L, editors. The Basics of Item Response Theory: ERICClearinghouse on Assessment and Evaluation. pp. 85-102.Baker FB, Kim S-H (2004a). Bayesian Parameter EstimationProcedures. In: Baker FB, Kim S-H, editors. Item Response TheoryParameter Estimation Techniques, Second Edition. Monticello, NewYork: Marcel Dekker. pp. 171-201.
266Educ. Res. Rev.Baker FB, Kim SH (2004b). Parameter Estimation via MMLE and an EMAlgorithm. In: Baker FB, Kim S-H, editors. Item Response TheoryParameter Estimation Techniques, Second Edition. Monticello, NewYork: Marcel Dekker. pp. 157-75.Bejar I (1983). Introduction to Item Response Models and TheirAssumptions. In: Hambleton RK, editor. Applications of ItemResponse Theory. Vancouver, Canada: Educational ResearchInstitute of british Columbia. pp. 1-23.Birnbaum A (1968). Som
Item response theory: A basic concept Jumailiyah Mahmud Institute of Teaching and Educational Sciences of Mataram, Indonesia. Accepted 17 January, 2017; Accepted 22 February, 2017 With the development in computing technology, item response theory (IRT) develops rapidly, and has b